Single-cell analysis of experience-dependent transcriptomic states in the mouse visual cortex - PubMed (original) (raw)
. 2018 Jan;21(1):120-129.
doi: 10.1038/s41593-017-0029-5. Epub 2017 Dec 11.
Daniel R Hochbaum 2 3, M Aurel Nagy 1, Marcelo Cicconet 4, Keiramarie Robertson 3, Lucas Cheadle 1, Rapolas Zilionis 5 6, Alex Ratner 7, Rebeca Borges-Monroy 8, Allon M Klein 5, Bernardo L Sabatini 9, Michael E Greenberg 10
Affiliations
- PMID: 29230054
- PMCID: PMC5742025
- DOI: 10.1038/s41593-017-0029-5
Single-cell analysis of experience-dependent transcriptomic states in the mouse visual cortex
Sinisa Hrvatin et al. Nat Neurosci. 2018 Jan.
Erratum in
- Publisher Correction: Single-cell analysis of experience-dependent transcriptomic states in the mouse visual cortex.
Hrvatin S, Hochbaum DR, Nagy MA, Cicconet M, Robertson K, Cheadle L, Zilionis R, Ratner A, Borges-Monroy R, Klein AM, Sabatini BL, Greenberg ME. Hrvatin S, et al. Nat Neurosci. 2018 Jul;21(7):1017. doi: 10.1038/s41593-018-0112-6. Nat Neurosci. 2018. PMID: 29752482
Abstract
Activity-dependent transcriptional responses shape cortical function. However, a comprehensive understanding of the diversity of these responses across the full range of cortical cell types, and how these changes contribute to neuronal plasticity and disease, is lacking. To investigate the breadth of transcriptional changes that occur across cell types in the mouse visual cortex after exposure to light, we applied high-throughput single-cell RNA sequencing. We identified significant and divergent transcriptional responses to stimulation in each of the 30 cell types characterized, thus revealing 611 stimulus-responsive genes. Excitatory pyramidal neurons exhibited inter- and intralaminar heterogeneity in the induction of stimulus-responsive genes. Non-neuronal cells showed clear transcriptional responses that may regulate experience-dependent changes in neurovascular coupling and myelination. Together, these results reveal the dynamic landscape of the stimulus-dependent transcriptional changes occurring across cell types in the visual cortex; these changes are probably critical for cortical function and may be sites of deregulation in developmental brain disorders.
Conflict of interest statement
Competing Financial Interests
The authors declare no competing financial interests.
Figures
Figure 1. Workflow and identification of cell types
(a) 6–7-week-old animals were housed in dark for 7 days and exposed to light for 0 (control), 1, or 4 h. V1 was dissociated into single cells and processed by inDrop sequencing. (b) FISH of the immediate-early genes (IEGs) Fos and Npas4 from animals exposed to light for 0 and 1 h (left). Nuclei are pseudo-colored by expression level of Fos (magenta) or Npas4 (green) FISH probes (Online Methods). Scale bar=100 um. Quantification of FISH across time points, with mean and 95% confidence intervals denoted by gray lines (right). A random subset (10%) of the raw data was selected for visualization. For both Fos and Npas4, cells=2,667 for 0 h, cells=2,683 for 1 h. ***p<10−200, Mann-Whitney U-test, two-sided. Experiments repeated on 2 cortical slices per timepoint. (**c**) qRT-PCR for _Fos_ relative to _Gapdh_ comparing a standard and an optimized cell dissociation protocol designed to limit IEG induction during dissociation. Mean denoted by horizontal line. ***p=2.7×10⁻⁴ and 3×10⁻⁵, _ns_ p=0.39, (standard vs optimized 0 h, optimized 0 vs 1 h, standard 0 vs 1h respectively), n=4 animals, unpaired t-test, two-sided. (**d**) RNA-Seq analysis of cocktail-treated and control cells collected from n=4 animals per condition. 114 genes that were significantly differentially expressed are denoted in blue (FDR <0.01, |fold change|>2, limma). 45 of these genes were also differentially expressed between cocktail-treated light-stimulated and light-unstimulated samples (Supplementary Fig. 2), denoted in orange. Axes units are log10 [(TMM-normalized CPM)+0.1]. (e) t-SNE plot of 47,209 cells from V1 of 23 animals. Colors denote main cell types. (f) Dendrogram and violin plots showing the distribution of expression of selected marker genes across all 30 analyzed cell types hierarchically clustered by variable gene expression.
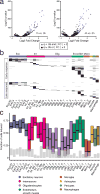
Figure 2. Identification of sensory stimulus-regulated genes
(a) Sample volcano plots for ExcL23 cells indicating genes identified as sensory stimulus-regulated (|log2 fold change| >1 and FDR<0.05) for 1 vs 0 h (left) and 4 vs 0 h (right) comparisons. Colored dots represent sensory stimulus-regulated genes. The analysis was performed independently across thirty cell types (Supplementary Fig. 12). (b) Heatmap of all 611 stimulus-regulated genes grouped into ERGs and LRGs by cell type. Each horizontal black line represents a stimulus-regulated gene. (c) Estimation of the percentage of cells with stimulus-regulated transcriptional changes (Online Methods) at 1 h (colored bars) compared to 0 h (gray bars). We define induction as requiring either two, three, or four induced genes within each cell from a cell-type-specific set to consider the cell induced. These are plotted as lower, central, and upper lines of the box (Online Methods).
Figure 3. Diversity of experience-regulated ERGs
(a) Number of cell types in which each ERTF is sensory experience-regulated. Inset: Cumulative distribution of the number of cell types in which each gene is experience-regulated. Stimulus-regulated LRGs were shared across fewer cell types than ERTFs (p=2×10⁻⁵, Mann–Whitney U-test, two-sided, nERTFs=38, nLRGs=176, nERnon-TF=205 genes). (b) Heatmap of log2 fold changes between 1 and 0 h of the 19 ERTFs shared across at least 3 cell types. ERTFs are hierarchically clustered into 4 groups based on gene expression across all variable genes as in Fig. 1f. (c) Left: Representative FISH images of Fos indicates induction across several cell types. Right: Quantification of FISH for Fos expression over cell types. A random subset (25%) of the raw data is plotted to aid visualization. For Vglut1, n0h=1,616, n1h=2,324; for Gad1/2, n0h=156, n1h=497; for Aldh1l1, n0h=121, n1h=477; for Pecam1, n0h=542, n1h=510 cells. ***p<10−39, Mann-Whitney U-test, two-sided. Mean and 95% confidence intervals denoted by gray lines. Experiments repeated on 2–8 cortical slices per timepoint. (d) Mean pairwise Pearson correlations across individual excitatory neurons at 1 h calculated using ERTF expression (left, r=0.23±0.13, mean±s.d.), shuffled ERTF expression (middle, r=0.002±0.017), and expression-matched non-induced genes (right, r=0.002±0.029), n =91 pairwise comparisons. Correlations between ERTFs are significantly higher than between shuffled ERTFs or expression-matched non-induced genes (p=0, p=0, Mann-Whitney U-test, two-sided, respectively). (e) Distributions of pairwise Pearson correlations of ERTFs (n=91 pairwise comparisons), ERTFs with shuffled expression, and of expression-matched non-induced genes across excitatory neuronal subtypes at 1 h. ERTFs are more highly correlated than either shuffled ERTFs or similarly expressed non-induced genes. ***p<1×10⁻²⁴, Mann-Whitney U-test, two-sided. (f) Left: 3-color FISH images of Fos, Egr1, and Nr4a1 expression at 1 h post-light stimulation in excitatory neurons (Vglut1+). Middle, Right: Quantification of FISH. Scatter plots between Egr1 and Fos, and Nr4a1 and Fos co-expression. Expression was highly correlated (Pearson r=0.74, 0.76 respectively; n=3162, 778 cells respectively). Scale bars=5 um. Data collected from 4 cortical slices for Egr1 and Fos co-expression, and 1 cortical slice for Nr4a1 and Fos co-expression.
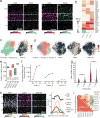
Figure 4. Sensory experience-induced transcriptional responses in V1 excitatory neurons
(a) FISH of Cbln4 with Rorb, a layer 4-specific marker, at 0 (control) and 4 h post light stimulus. Nuclei are pseudo-colored by expression level of Cbln4 or Rorb (Online methods). Scale bars=150 um. Experiments repeated on 2 cortical slices per condition. (b) Heatmap of log2 fold change in expression of LRGs across layer 5 subtypes between 4 and 0 h. (c) Left: t-SNE plot showing Layer 2/3 excitatory neuronal subtypes. Right: Overlay of Cdh13 expression. Scale bar indicates normalized expression per cell. n=2941 cells. (d) Left: t-SNE plot of Layer 4 excitatory neuronal subtypes. Right: Overlay of selected marker expression. Scale bar indicates normalized expression per cell. n=3198 cells. (e) Estimation of the percentage of cells with stimulus-regulated transcriptional changes (Online Methods) at 1 h (colored bars), compared to 0 h (gray bars). We define induction as requiring either two, three, or four induced genes within each cell from a cell-type-specific set to consider the cell induced. These are plotted as lower, central, and upper lines of the box (Online Methods). (f) Mean expression of Cbln4 across layer 4 subtypes (nExc4_1=732, 468, 783 cells; n Exc4_2=343, 214, 210 cells; n Exc4_3=136, 137, 175 cells; for 0, 1, 4 h timepoints respectively), S.E.M. denoted by bars. (g) FISH quantification of Cbln4 across layer 4 subtypes (Calb1+/Rorb+ and _Calb1_−/Rorb+). 0 h expression not significantly different between cell types, n=97, 209 cells respectively, p=0.062, Mann-Whitney U-test, two-sided. 4 h expression significantly higher in Calb1+/Rorb+ than _Calb1_−/Rorb+ (n=127, 286 cells respectively), ***p<10−17, Mann-Whitney U-test, two-sided. Mean and 95% confidence intervals denoted by gray lines. (h) Left: Rorb (yellow), Calb1 (magenta), and Hsd11b1 (cyan) expression in layer 4 by FISH, scale bars=100 um. Right: Quantification of the anatomical distribution of FISH-defined cell types across layer 4 from n=13 cortical slices. Negative/positive values on x-axis correspond to distance from the center of layer 4 towards the slice surface (negative) or towards deeper cortical layers (positive). Shaded area around lines indicates 95% confidence intervals around mean. Calb1+/_Rorb_+ (n=1626 cells) population is enriched superficially within layer 4 as defined by _Rorb_+ (n=4066 cells) and an increase in cell density (black). Hsd11b1+/Rorb+/Calb− (n=851 cells) population is enriched in ventral layer 4 and into superficial layer 5. For further analysis, see Supplementary Fig. 21. (i) Top right: pairwise Pearson correlation between excitatory subtypes calculated using LRG expression (n=55 genes). Bottom left: Same analysis with expression-matched non-stimulus-regulated genes (n=55 genes). Non-stimulus regulated genes are more correlated across excitatory subtypes than stimulus-regulated LRGs.
Figure 5. Inhibitory neuronal LRGs
(a) Cell type enriched LRGs across inhibitory cell types. Transcripts per cell represent the mean depth-normalized expression across all cells. Fold change is calculated between 4 and 0 h. (b) Scaled mean expression of Crh, Crhbp, and Crhr1 across all cell types.
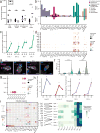
Figure 6. Light-induced transcriptional changes in non-neuronal cells
(a) qRT-PCR of Klf4 across cortical regions in 0 and 1 h light-exposed animals, mean denoted by horizontal bar. Klf4 induction is only significant in V1, p=0.02, unpaired t-test, two-sided. n=4 animals for all 0 h samples, n=3 animals for 1 h motor and prefrontal cortex, n=4 for 1 h somatosensory and visual cortex. (b) Total number of sensory-stimulus-regulated genes across cell types. (c) Mean expression of the LRG Angpt2 across endothelial and smooth muscle cells across all three stimulus conditions (nENDO_1=1111, 1107, 1109; nENDO_2=33, 65, 25; nSM_1=115, 92, 116; nSM_2=104, 109, 85 cells; for 0, 1, 4 h respectively). *FDR<.05, fold change>2, Monocle2. S.E.M. denoted by bars. (d) Induction at 1 h of ERTFs enriched in vasculature-associated cells. (e) FISH of single Pecam1+ cells at 0 and 1 h co-labeled with Atf3 and Klf4, scale bars=5 um. Experiments repeated on 2 cortical slices per timepoint. (f) Quantification of FISH for Atf3 and Klf4 in _Pecam1_+ cells across 0 and 1 h (for Atf3, n0h=275, n1h=326; for Klf4, n0h=182, n1h=224 cells). p<10−22, Mann-Whitney U-test, two-sided. Mean and 95% confidence intervals denoted by gray lines. Data from 2 cortical slices per timepoint. (**g**) Fold-change in expression between 0 and 4 h samples of light-induced genes in oligodendrocytes and OPCs. (**h**) Mean expression of _Egr1_ in ExcL23, Int_Sst_2, and OPCs across all stimulus conditions (nExcL23=150, 706, 1107; nInt_Sst_2=59, 52, 70; nOPC_1=645, 472, 608; nOPC_2=31, 27, 43 cells; 0, 1, 4 h respectively). *FDR <.05, fold change>2, Monocle2. S.E.M. denoted by bars. (i) Left: Heatmap of induction of ligands in non-oligodendrocyte cell types with receptors enriched in OPCs at both 1 and 4 h time points. Right: Scaled mean expression of OPC-enriched receptors. Lines between heatmaps denote ligand-receptor pairs.
Similar articles
- Nuclear RNA-seq of single neurons reveals molecular signatures of activation.
Lacar B, Linker SB, Jaeger BN, Krishnaswami SR, Barron JJ, Kelder MJE, Parylak SL, Paquola ACM, Venepally P, Novotny M, O'Connor C, Fitzpatrick C, Erwin JA, Hsu JY, Husband D, McConnell MJ, Lasken R, Gage FH. Lacar B, et al. Nat Commun. 2016 Apr 19;7:11022. doi: 10.1038/ncomms11022. Nat Commun. 2016. PMID: 27090946 Free PMC article. - A single-cell transcriptomic atlas of sensory-dependent gene expression in developing mouse visual cortex.
Xavier AM, Lin Q, Kang CJ, Cheadle L. Xavier AM, et al. Development. 2025 Oct 15;152(20):dev204244. doi: 10.1242/dev.204244. Epub 2025 Mar 27. Development. 2025. PMID: 40018816 - Experience-dependent plasticity of mouse visual cortex in the absence of the neuronal activity-dependent marker egr1/zif268.
Mataga N, Fujishima S, Condie BG, Hensch TK. Mataga N, et al. J Neurosci. 2001 Dec 15;21(24):9724-32. doi: 10.1523/JNEUROSCI.21-24-09724.2001. J Neurosci. 2001. PMID: 11739581 Free PMC article. - Neurotrophin/Trk receptor signaling mediates C/EBPalpha, -beta and NeuroD recruitment to immediate-early gene promoters in neuronal cells and requires C/EBPs to induce immediate-early gene transcription.
Calella AM, Nerlov C, Lopez RG, Sciarretta C, von Bohlen und Halbach O, Bereshchenko O, Minichiello L. Calella AM, et al. Neural Dev. 2007 Jan 25;2:4. doi: 10.1186/1749-8104-2-4. Neural Dev. 2007. PMID: 17254333 Free PMC article. - The dynamics of visual responses in the primary visual cortex.
Shapley R, Hawken M, Xing D. Shapley R, et al. Prog Brain Res. 2007;165:21-32. doi: 10.1016/S0079-6123(06)65003-6. Prog Brain Res. 2007. PMID: 17925238 Review.
Cited by
- The neurons that restore walking after paralysis.
Kathe C, Skinnider MA, Hutson TH, Regazzi N, Gautier M, Demesmaeker R, Komi S, Ceto S, James ND, Cho N, Baud L, Galan K, Matson KJE, Rowald A, Kim K, Wang R, Minassian K, Prior JO, Asboth L, Barraud Q, Lacour SP, Levine AJ, Wagner F, Bloch J, Squair JW, Courtine G. Kathe C, et al. Nature. 2022 Nov;611(7936):540-547. doi: 10.1038/s41586-022-05385-7. Epub 2022 Nov 9. Nature. 2022. PMID: 36352232 Free PMC article. - Regulation of Neuronal Differentiation, Function, and Plasticity by Alternative Splicing.
Furlanis E, Scheiffele P. Furlanis E, et al. Annu Rev Cell Dev Biol. 2018 Oct 6;34:451-469. doi: 10.1146/annurev-cellbio-100617-062826. Epub 2018 Jul 20. Annu Rev Cell Dev Biol. 2018. PMID: 30028642 Free PMC article. Review. - Single sample sequencing (S3EQ) of epigenome and transcriptome in nucleus accumbens.
Xu SJ, Heller EA. Xu SJ, et al. J Neurosci Methods. 2018 Oct 1;308:62-73. doi: 10.1016/j.jneumeth.2018.07.006. Epub 2018 Jul 18. J Neurosci Methods. 2018. PMID: 30031009 Free PMC article. - Deciphering Brain Complexity Using Single-cell Sequencing.
Mu Q, Chen Y, Wang J. Mu Q, et al. Genomics Proteomics Bioinformatics. 2019 Aug;17(4):344-366. doi: 10.1016/j.gpb.2018.07.007. Epub 2019 Oct 3. Genomics Proteomics Bioinformatics. 2019. PMID: 31586689 Free PMC article. Review. - The role of astrocyte structural plasticity in regulating neural circuit function and behavior.
Lawal O, Ulloa Severino FP, Eroglu C. Lawal O, et al. Glia. 2022 Aug;70(8):1467-1483. doi: 10.1002/glia.24191. Epub 2022 May 10. Glia. 2022. PMID: 35535566 Free PMC article. Review.
References
- Hensch TK. Critical period plasticity in local cortical circuits. Nat. Rev. Neurosci. 2005;6:877–888. - PubMed
- Wiesel TN, Hubel DH. SINGLE-CELL RESPONSES IN STRIATE CORTEX OF KITTENS DEPRIVED OF VISION IN ONE EYE. J. Neurophysiol. 1963;26:1003–1017. - PubMed
- Zucker RS, Regehr WG. Short-term synaptic plasticity. Annu. Rev. Physiol. 2002;64:355–405. - PubMed
- Bading H. Nuclear calcium signalling in the regulation of brain function. Nat. Rev. Neurosci. 2013;14:593–608. - PubMed
Publication types
MeSH terms
Substances
Grants and funding
- R37 NS028829/NS/NINDS NIH HHS/United States
- R37 NS046579/NS/NINDS NIH HHS/United States
- P30 NS072030/NS/NINDS NIH HHS/United States
- T32 AG000222/AG/NIA NIH HHS/United States
- T32 GM007753/GM/NIGMS NIH HHS/United States
- R01 NS028829/NS/NINDS NIH HHS/United States
- U54 HD090255/HD/NICHD NIH HHS/United States
- R33 CA212697/CA/NCI NIH HHS/United States
- R01 NS046579/NS/NINDS NIH HHS/United States
LinkOut - more resources
Full Text Sources
Other Literature Sources
Molecular Biology Databases


