Pharmacologic Targeting of Red Blood Cells to Improve Tissue Oxygenation - PubMed (original) (raw)
Clinical Trial
. 2018 Sep;104(3):553-563.
doi: 10.1002/cpt.979. Epub 2018 Jan 17.
Affiliations
- PMID: 29238951
- PMCID: PMC6590078
- DOI: 10.1002/cpt.979
Clinical Trial
Pharmacologic Targeting of Red Blood Cells to Improve Tissue Oxygenation
James D Reynolds et al. Clin Pharmacol Ther. 2018 Sep.
Abstract
Disruption of microvascular blood flow is a common cause of tissue hypoxia in disease, yet no therapies are available that directly target the microvasculature to improve tissue oxygenation. Red blood cells (RBCs) autoregulate blood flow through S-nitroso-hemoglobin (SNO-Hb)-mediated export of nitric oxide (NO) bioactivity. We therefore tested the idea that pharmacological enhancement of RBCs using the S-nitrosylating agent ethyl nitrite (ENO) may provide a novel approach to improve tissue oxygenation. Serial ENO dosing was carried out in sheep (1-400 ppm) and humans (1-100 ppm) at normoxia and at reduced fraction of inspired oxygen (FiO2 ). ENO increased RBC SNO-Hb levels, corrected hypoxia-induced deficits in tissue oxygenation, and improved measures of oxygen utilization in both species. No adverse effects or safety concerns were identified. Inasmuch as impaired oxygenation is a major cause of morbidity and mortality, ENO may have widespread therapeutic utility, providing a first-in-class agent targeting the microvasculature.
© 2017 American Society for Clinical Pharmacology and Therapeutics.
Conflict of interest statement
CONFLICT OF INTEREST
Dr. Reynolds has a financial interest in Miach Medical Innovations. Dr. Stamler has financial interests in Nivalis Therapeutics (formerly Nitrox), Adamas Pharma, LifeHealth, and Vindica Pharm. Drs. Moon, Piantadosi, Reynolds, and Stamler hold patents related to renitrosylation of blood, some of which have been licensed for commercial development. Both institutions are aware of these conflicts and appropriate management plans are in place. None of the other authors have relevant conflicts to disclose.
Figures
Figure 1
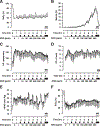
Responses to ethyl nitrite (ENO) dosing during hypoxia in sheep (n = 9). Time courses are presented as mean ± standard deviation of (a) percent arterial blood oxygen saturation, SaO2%; (b) percent methemoglobin, Met-Hb%; (c) heart rate, HR, in beats per min; (d) cardiac output, CO, in liters per min; (e) mean pulmonary arterial pressure, mPAP, in mm Hg; and (f) percent systemic venous oxygen saturation, SvO2%. The standard deviations (error bars) are marked every 15 min for clarity. Hypoxia was initiated for 60 min starting at time 0 (normoxic baseline) followed by ENO dosing from 1–400 ppm with each dose administered for 45 min followed by a 15-min washout period (solid rectangles). Met-Hb levels rose with dose escalation, providing a biomarker of ENO exposure. MB demarcates the i.v. administration of 1 mg/kg methylene blue to rapidly reduce metHb levels.
Figure 2
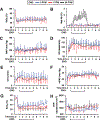
Responses during and after ethyl nitrite (ENO) dosing in hypoxic sheep. Time courses are presented as mean ± standard deviation of (a) percent arterial blood oxygen saturation, SaO2%; (b) percent methemoglobin, Met-Hb%; (c) mean arterial pressure, MAP, in mm Hg; (d) heart rate, HR, in beats per min; (e) cardiac output, CO, in liters per min; (f) mean pulmonary arterial pressure, mPAP, in mm Hg; (g) percent systemic venous oxygen saturation, SvO2%; and (h) systemic vascular resistance, SVR, in dynes*sec*cm−5. The standard deviations (error bars) are marked every 30 min for clarity. Hypoxia was initiated for 1 h starting at time 0 (normoxic baseline) then sheep received either 0 (n = 8; blue line), 1 (n = 8; red line), or 50 (n = 7; black line) ppm ENO for 4 h followed by an additional 4 h under hypoxia alone. ENO produced significant dose-dependent increases in CO and declines in SvO2 and SVR that carried into the postexposure period. See text for additional details.
Figure 3
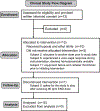
Human trial flow chart. Clinical trial process for subjects who volunteered to participate in the ethyl nitrite (ENO) dosing study.
Figure 4
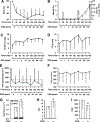
Responses to ethyl nitrite (ENO) during hypoxia in humans (n = 10). Time courses are presented as mean ± standard deviation of (a) percent arterial blood oxygen saturation, SaO2%; (b) percent change in S-nitrosylated hemoglobin, SNO-Hb (bars) and percent methemoglobin, Met-Hb% (line); (c) mean pulmonary arterial pressure, mPAP, in mm Hg; (d) cardiac output, CO, in liters per min; (e) systemic vascular resistance, SVR, in dynes*sec*cm−5; and (f) oxygen consumption, VO2, expressed as milliliters per min. Hypoxia was initiated at time 0 (normoxic baseline) followed by ENO dosing from 1–100 ppm with each dose administered for 20 min (no washout). Levels of SNO-Hb and Met-Hb escalated with ENO dose. Absolute values for the change in SNO-Hb, FeNOHb, and total NOHb are presented in (g) and demonstrate the selective S-nitrosylating activity of ENO. Total NOHb increased significantly from 1.27 ± 0.48 per Hb×10−3 to 1.87 ± 0.66 (_P_=0.005) after the 100 ppm dose, reflecting an increase in SNO-Hb (white bar; _P_=0.007), without change in FeNOHb (black bar; _P_=0.737). Also along the bottom row, group means are presented for (h) maximum CO and (i) minimum SVR (independent of ENO dose; ± ENO). CO increased significantly while SVR declined vs. their respective hypoxic baseline (all P < 0.05).
Figure 5
Effect of ethyl nitrite (ENO) on tissue oxygenation (StO2) and oxygen utilization in humans. (a) Calf muscle oxygenation measured with near infrared spectroscopy during hypoxia and dosing with 1–100 ppm ENO; each dose was administered for 20 min (no washout). Initiation of hypoxia (time 0; normoxic baseline) produced a significant decline in StO2 (*P < 0.05). For doses >10 ppm ENO, calf oxygenation increased, reaching normoxic levels at 40 ppm. At study completion, muscle StO2 was at normoxic (prehypoxic) levels (_P_=1.00). (b) Consistent with an ENO-induced increase in peripheral oxygen utilization there was a direct linear relationship between muscle StO2 and arterial-venous oxygen content difference (A-V Δ O2, mL/dL; _r_=0.44). (c) Brain StO2 declined with hypoxia, then remained significantly lower than the prehypoxic starting point throughout ENO dosing (*P < 10−7). (d) Consistent with the persistent decrease in cerebral oxygenation, there was no relationship between brain StO2 and A-V Δ O2 difference (_r_=0.09).
Similar articles
- Role of Nitric Oxide Carried by Hemoglobin in Cardiovascular Physiology: Developments on a Three-Gas Respiratory Cycle.
Premont RT, Reynolds JD, Zhang R, Stamler JS. Premont RT, et al. Circ Res. 2020 Jan 3;126(1):129-158. doi: 10.1161/CIRCRESAHA.119.315626. Epub 2019 Oct 8. Circ Res. 2020. PMID: 31590598 Free PMC article. Review. - Hemoglobin β93 Cysteine Is Not Required for Export of Nitric Oxide Bioactivity From the Red Blood Cell.
Sun CW, Yang J, Kleschyov AL, Zhuge Z, Carlström M, Pernow J, Wajih N, Isbell TS, Oh JY, Cabrales P, Tsai AG, Townes T, Kim-Shapiro DB, Patel RP, Lundberg JO. Sun CW, et al. Circulation. 2019 Jun 4;139(23):2654-2663. doi: 10.1161/CIRCULATIONAHA.118.039284. Epub 2019 Mar 25. Circulation. 2019. PMID: 30905171 Free PMC article. - Optimized S-nitrosohemoglobin Synthesis in Red Blood Cells to Preserve Hypoxic Vasodilation Via _β_Cys93.
Hausladen A, Qian Z, Zhang R, Premont RT, Stamler JS. Hausladen A, et al. J Pharmacol Exp Ther. 2022 Jul;382(1):1-10. doi: 10.1124/jpet.122.001194. Epub 2022 May 5. J Pharmacol Exp Ther. 2022. PMID: 35512801 Free PMC article. - Nitrite and S-Nitrosohemoglobin Exchange Across the Human Cerebral and Femoral Circulation: Relationship to Basal and Exercise Blood Flow Responses to Hypoxia.
Bailey DM, Rasmussen P, Overgaard M, Evans KA, Bohm AM, Seifert T, Brassard P, Zaar M, Nielsen HB, Raven PB, Secher NH. Bailey DM, et al. Circulation. 2017 Jan 10;135(2):166-176. doi: 10.1161/CIRCULATIONAHA.116.024226. Epub 2016 Nov 15. Circulation. 2017. PMID: 27881556 Clinical Trial. - Red Blood Cell-Mediated S-Nitrosohemoglobin-Dependent Vasodilation: Lessons Learned from a β-Globin Cys93 Knock-In Mouse.
Premont RT, Reynolds JD, Zhang R, Stamler JS. Premont RT, et al. Antioxid Redox Signal. 2021 Apr 20;34(12):936-961. doi: 10.1089/ars.2020.8153. Epub 2020 Jul 23. Antioxid Redox Signal. 2021. PMID: 32597195 Free PMC article. Review.
Cited by
- Role of Nitric Oxide Carried by Hemoglobin in Cardiovascular Physiology: Developments on a Three-Gas Respiratory Cycle.
Premont RT, Reynolds JD, Zhang R, Stamler JS. Premont RT, et al. Circ Res. 2020 Jan 3;126(1):129-158. doi: 10.1161/CIRCRESAHA.119.315626. Epub 2019 Oct 8. Circ Res. 2020. PMID: 31590598 Free PMC article. Review. - ZOOMICS: Comparative Metabolomics of Red Blood Cells From Old World Monkeys and Humans.
Bertolone L, Shin HK, Stefanoni D, Baek JH, Gao Y, Morrison EJ, Nemkov T, Thomas T, Francis RO, Hod EA, Zimring JC, Yoshida T, Karafin M, Schwartz J, Hudson KE, Spitalnik SL, Buehler PW, D'Alessandro A. Bertolone L, et al. Front Physiol. 2020 Oct 23;11:593841. doi: 10.3389/fphys.2020.593841. eCollection 2020. Front Physiol. 2020. PMID: 33192610 Free PMC article. - Response by Lundberg et al to Letter Regarding Article, "Hemoglobin β93 Cysteine Is Not Required for Export of Nitric Oxide Bioactivity From the Red Blood Cell".
Lundberg JO, Cabrales P, Tsai AG, Patel RP, Kim-Shapiro DB. Lundberg JO, et al. Circulation. 2019 Nov 5;140(19):e760-e761. doi: 10.1161/CIRCULATIONAHA.119.043151. Epub 2019 Nov 4. Circulation. 2019. PMID: 31682526 Free PMC article. No abstract available. - S-Nitrosylated hemoglobin predicts organ yield in neurologically-deceased human donors.
Nazemian R, Matta M, Aldamouk A, Zhu L, Awad M, Pophal M, Palmer NR, Armes T, Hausladen A, Stamler JS, Reynolds JD. Nazemian R, et al. Sci Rep. 2022 Apr 22;12(1):6639. doi: 10.1038/s41598-022-09933-z. Sci Rep. 2022. PMID: 35459243 Free PMC article. - ZOOMICS: Comparative Metabolomics of Red Blood Cells From Guinea Pigs, Humans, and Non-human Primates During Refrigerated Storage for Up to 42 Days.
Bertolone L, Shin HKH, Baek JH, Gao Y, Spitalnik SL, Buehler PW, D'Alessandro A. Bertolone L, et al. Front Physiol. 2022 Mar 21;13:845347. doi: 10.3389/fphys.2022.845347. eCollection 2022. Front Physiol. 2022. PMID: 35388289 Free PMC article.
References
- Singel DJ & Stamler JS Chemical physiology of blood flow regulation by red blood cells: the role of nitric oxide and S-nitrosohemoglobin. Annu. Rev. Physiol 67, 99–145 (2005). - PubMed
- McMahon TJ et al. Nitric oxide in the human respiratory cycle. Nat. Med 8, 711–717 (2002). - PubMed
- Gow AJ & Stamler JS Reactions between nitric oxide and haemoglobin under physiological conditions. Nature 391, 169–173 (1998). - PubMed
- Doctor A & Stamler JS Nitric oxide transport in blood: a third gas in the respiratory cycle. Comprehen. Phys 1, 541–568 (2011). - PubMed
Publication types
MeSH terms
Substances
LinkOut - more resources
Full Text Sources
Other Literature Sources


