Control of cell morphology and differentiation by substrates with independently tunable elasticity and viscous dissipation - PubMed (original) (raw)
Control of cell morphology and differentiation by substrates with independently tunable elasticity and viscous dissipation
Elisabeth E Charrier et al. Nat Commun. 2018.
Abstract
The mechanical properties of extracellular matrices can control the function of cells. Studies of cellular responses to biomimetic soft materials have been largely restricted to hydrogels and elastomers that have stiffness values independent of time and extent of deformation, so the substrate stiffness can be unambiguously related to its effect on cells. Real tissues, however, often have loss moduli that are 10 to 20% of their elastic moduli and behave as viscoelastic solids. The response of cells to a time-dependent viscous loss is largely uncharacterized because appropriate viscoelastic materials are lacking for quantitative studies. Here we report the synthesis of soft viscoelastic solids in which the elastic and viscous moduli can be independently tuned to produce gels with viscoelastic properties that closely resemble those of soft tissues. Systematic alteration of the hydrogel viscosity demonstrates the time dependence of cellular mechanosensing and the influence of viscous dissipation on cell phenotype.
Conflict of interest statement
The authors declare no competing financial interests.
Figures
Fig. 1
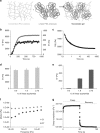
Structure and mechanical characterization of the viscoelastic PAA gels. a Cartoon representing the association of an elastic network of PAA with a viscous solution of linear PAA to form a viscoelastic gel. Trapping of linear chains of PAA in a network of PAA leads to the formation of a viscoelastic gel. b Evolution of G’ and G” during the polymerization of a viscoelastic gel: G’ and G” both increase during the formation of the branched PAA network. G’, light gray (left axis); G”, dark gray (right axis). c Representative plot of the stress relaxation of a viscoelastic gel containing 2.75% linear polyacrylamide: evolution of the shear modulus over time under a 10% strain. d Average value of G’ as characterized by a 2% oscillating shear stress at a frequency of 0.159 Hz and 2% strain; n = 5 gels per condition. Error bars represent the standard error. e Average value of G” as characterized by a 2% oscillating shear stress at the frequency of 0.159 Hz and 2%strain; n = 5 gels per condition. Error bars represent the standard error. f Values of G’ and G” as a function of the oscillation frequency for the highly viscous gel (designed as the G’ = 5 kPa, G” = 500 Pa gel). The frequency sweep was performed from 0.005 Hz to 10 Hz. G’ shows a weak frequency dependence while G” varies over a decade in the range of frequencies probed. g Creep and recovery of the viscoelastic gel containing 2.75% of linear PAA. The creep compliance was followed during the application of a stress of 100 Pa for 50 s, and then the recovery was monitored for 50 s
Fig. 2
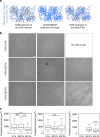
Characterization of protein crosslinking to the surface of the gel. a Principle of the measurement. The AFM tip is brought close to the gel until a contact is made between the anti-collagen antibody on the tip and the protein at the surface of the gel. Then the tip is retracted until the contact breaks at the values noted as _L_adh and _F_adh. b Boxplot of the adhesion forces between the anti-collagen I antibody and the collagen I presented on the networked or the linear PAA. c Boxplot of the adhesion length between the anti-collagen I antibody and the collagen I presented on the networked or the linear PAA. *Statistically significant difference with a _p_-value of <0.01, as calculated by non-parametric Tukey's tests
Fig. 3
Characterization of 3T3 cell spreading on collagen I-coated gels. a Cartoon representing the three ways to conjugate collagen I to viscoelastic PAA gels. Adhesion proteins are crosslinked to the elastic part of the gel by adding NHS during the polymerization of the PAA network. Collagen I is crosslinked to both forms of PAA in the gel by sulfoSANPAH treatment. Collagen I is conjugated to the viscous part of the gel by adding NHS during the polymerization of the linear PAA. b Bright field images of 3T3 cells after 24 h of spreading on gels with G’ = 5 kPa and variable G”, coated with 50 µg/ml collagen I. Scale bar = 50 µm. c Average projected cell area of 3T3 fibroblasts after 24 h (right) on gels functionalized with collagen I on the elastic part of the gel (left) or on the elastic and the viscous part of the gel (right). Sample size: NHS gels 0 Pa n = 179 cells, 200 Pa n = 185 cells, 500 Pa n = 187 cells; sulfoSANPAH gels: 0 Pa n = 314 cells, 200 Pa n = 314 cells, 500 Pa n = 315 cells. ***Statistically significant difference with a _p_-value of <0.01, as calculated by non-parametric Tukey's tests; “ns” indicates no statistical difference
Fig. 4
Characterization of 3T3 spreading on fibronectin-coated gels. a Cartoon representing the three ways fibronectin was crosslinked to viscoelastic PAA gels. b Bright field images of 3T3 cells after 24 h on gels with G’ = 5 kPa and variable G” coated with 0.1 mg/ml human fibronectin. Scale bar = 50 μm. c Average projected cell area of 3T3 fibroblasts after 24 h on gels functionalized with fibronectin on the elastic part of the gel (left), on the elastic and the viscous part of the gel (middle) and on the linear PAA (viscous; right). Sample size: NHS gels 0 Pa n = 118 cells, 200 Pa n = 127 cell, 500 Pa n = 104 cells; sulfoSANPAH gels: 0 Pa n = 116 cells, 200 Pa n = 119 cells, 500 Pa n = 144 cells ***Statistically significant differences with a _p_-value of <0.01, as calculated by non-parametric Tukey's tests; “ns” indicates no statistical difference
Fig. 5
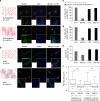
Analysis of actin stress fibers and paxillin patches of 3T3 fibroblasts incubated for 24 h on gels presenting collagen I. a Confocal images of paxillin (green), actin (blue) and the nucleus (pink) of 3T3 cells on 5 kPa elastic gels (top) and viscoelastic gels (bottom) with 50 µg/ml collagen I coating both forms of PAA. Scale bars = 20 µm, insets are magnification x3 of the dotted boxes. b Confocal images of paxillin (green), actin (blue) and nuclei (pink) of 3T3 cells incubated for 24 h on 5 kPa elastic gels (top) and viscoelastic gels (bottom), both with 50 µg/ml collagen I coating the crosslinked network of PAA. Scale bars = 20 µm, insets are magnification x3 of the dotted boxes. c Percentage of cells containing stress fibers on elastic and viscoelastic gels as a function of G” and the type of PAA presenting collagen I. Sample size: NHS 0 Pa n = 8 cells, NHS 500 Pa n = 13 cells, sulfoSANPAH 0 Pa n = 24 cells, sulfoSANPAH 500 Pa n = 34 cells. d Percentage of cells containing paxillin clusters as a function of G” and the type of PAA presenting collagen I. Sample size: NHS 0 Pa n = 8 cells, NHS 500 Pa n = 13 cells, sulfoSANPAH 0 Pa n = 24 cells, sulfoSANPAH 500 Pa n = 34 cells. e Average number of paxillin patches per cell as a function of the value of G” and the mode of presenting collagen I at the surface of the gel. Sample size: NHS 0 Pa n = 8 cells, NHS 500 Pa n = 13 cells, sulfoSANPAH 0 Pa n = 24 cells, sulfoSANPAH 500 Pa n = 34 cells. Error bars represent the standard error. f Average size of paxillin clusters as a function of the G” of the substrate and the mode of presenting collagen I to the cells. Sample size: NHS 0 Pa n = 8 cells, NHS 500 Pa n = 13 cells, sulfoSANPAH 0 Pa n = 24 cells, sulfoSANPAH 500 Pa n = 34 cells. ***Statistically significant differences with a _p_-value of <0.01, as calculated by non-parametric Tukey's tests
Fig. 6
Analysis of actin stress fibers and paxillin patches of 3T3 cell incubated for 24 h on fibronectin-coated PAA gels. a Confocal images of paxillin (green), actin (blue) and nuclei (pink) staining of 3T3 cells sitting on an elastic gel (top) and a viscoelastic gel (bottom) coated with 100 µg/ml fibronectin on the crosslinked network and the linear PAA. Scale bars = 20 µm, insets are magnification x3 of the dotted boxes. b Confocal images of paxillin (green), actin (blue) and nuclei (magenta) of 3T3 cell sitting on an elastic gel (top) and a viscoelastic gel (G” = 500 Pa, bottom) coated with 100 µg/ml fibronectin on the crosslinked network of PAA. Scale bars = 20 µm, insets are magnification x3 of the dotted boxes. c Confocal images of paxillin (green), actin (blue) and nuclei (magenta) of 3T3 cell on a 5 kPa viscoelastic gel presenting fibronectin on the linear PAA. Scale bars = 20 µm, insets are magnification x3 of the dotted boxes. d Percentage of cells containing stress fibers on elastic and viscoelastic gels as a function of G” and the type of PAA presenting fibronectin. Sample size: NHS 0 Pa n = 22 cells, NHS 500 Pa n = 20 cells, sulfoSANPAH 0 Pa n = 24 cells, sulfoSANPAH 500 Pa n = 27 cells. e Percentage of cells containing paxillin clusters as a function of G” and the type of PAA presenting fibronectin. Sample size: NHS 0 Pa n = 22 cells, NHS 500 Pa n = 20 cells, sulfoSANPAH 0 Pa n = 24 cells, sulfoSANPAH 500 Pa n = 27 cells. f Average number of paxillin patches by cell as a function of the value of G” and the type of PAA presenting fibronectin. Sample size: NHS 0 Pa n = 22 cells, NHS 500 Pa n = 20 cells, sulfoSANPAH 0 Pa n = 24 cells, sulfoSANPAH 500 Pa n = 27 cells. Error bars represent the standard error. g Size of paxillin clusters as a function of G” and the way to present collagen I to the cells. Sample size: NHS 0 Pa n = 22 cells, NHS 500 Pa n = 20 cells, sulfoSANPAH 0 Pa n = 24 cells, sulfoSANPAH 500 Pa n = 27 cells. ***Statistically significant differences with a _p_-value of <0.01, as calculated by non-parametric Tukey's tests
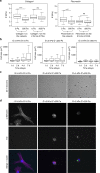
Fig. 7
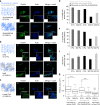
Analysis of the effect of viscoelasticity on 3T3 cell stiffness and hepatic stellate cell differentiation. a Young’s modulus of 3T3 fibroblasts as a function of G”. Cells were incubated for 24 h on 5 kPa elastic (G” = 0 Pa) and viscoelastic (G” = 500 Pa) gels coated with collagen I (left) or fibronectin (right). Sample size: Collagen I gels NHS 0 Pa n = 76 cells, NHS 500 Pa n = 68 cells, sulfoSANPAH 0 Pa n = 112 cells, sulfoSANPAH 500 Pa n = 104 cells; fibronectin gels NHS 0 Pa n = 187 cells, NHS 500 Pa n = 176 cells, sulfoSANPAH 0 Pa n = 149 cells, sulfoSANPAH 500 Pa n = 139 cells. b The evolution over 7 days of the projected area of hepatic stellate cells on elastic (left) and viscoelastic gels (middle and right). The distribution of cell area values becomes broader over time. This shift toward greater values is characteristic of the differentiation of part of the cell population into myofibroblasts. Sample size: 5 kPa 0 Pa gel day 1 n = 114 cells, day 2 n = 117 cells, day 4 n = 117 cells, day 7 n = 70 cells; 5 kPa 200 Pa gel day 1 n = 112 cells, day 2 n = 108 cells, day 4 n = 119 cells, day 7 = 114 cells; 5 kPa 500 Pa gel day 1 n = 113 cells, day 2 n = 95 cells, day 4 n = 107 cells, day 7 = 106 cells. c Bright field images of myofibroblasts incubated for 24 h on elastic and viscoelastic PAA gels coated with collagen I. Myofibroblasts have a smaller area on viscoelastic gels; on the gels with G” = 500 Pa, cell morphology is similar to that of undifferentiated cells. Scale bar = 50 µm. d Fluorescence images of myofibroblasts incubated for 24 h on elastic and viscoelastic PAA gels coated with collagen I. Nuclei (blue) are stained with Hoechst, α-smooth muscle actin (magenta) has been stained by immunofluorescence and lipid droplets (green) were stained with Bodipy® 493/503. Scale bar = 20 μm. ***Statistically significant differences with a _p_-value of <0.01, as calculated by non-parametric Tukey's tests; “ns” indicates no statistical difference
Similar articles
- A Novel Method to Make Polyacrylamide Gels with Mechanical Properties Resembling those of Biological Tissues.
Pogoda K, Charrier EE, Janmey PA. Pogoda K, et al. Bio Protoc. 2021 Aug 20;11(16):e4131. doi: 10.21769/BioProtoc.4131. eCollection 2021 Aug 20. Bio Protoc. 2021. PMID: 34541049 Free PMC article. - Elasticity-dependent response of malignant cells to viscous dissipation.
Charrier EE, Pogoda K, Li R, Wells RG, Janmey PA. Charrier EE, et al. Biomech Model Mechanobiol. 2021 Feb;20(1):145-154. doi: 10.1007/s10237-020-01374-9. Epub 2020 Aug 12. Biomech Model Mechanobiol. 2021. PMID: 32785801 Free PMC article. - Dynamic viscoelastic properties of processed soft denture liners: Part I--Initial properties.
Wagner WC, Kawano F, Dootz ER, Koran A 3rd. Wagner WC, et al. J Prosthet Dent. 1995 May;73(5):471-7. doi: 10.1016/s0022-3913(05)80077-0. J Prosthet Dent. 1995. PMID: 7658398 - Effects of extracellular matrix viscoelasticity on cellular behaviour.
Chaudhuri O, Cooper-White J, Janmey PA, Mooney DJ, Shenoy VB. Chaudhuri O, et al. Nature. 2020 Aug;584(7822):535-546. doi: 10.1038/s41586-020-2612-2. Epub 2020 Aug 26. Nature. 2020. PMID: 32848221 Free PMC article. Review. - Characterizing and Engineering Biomimetic Materials for Viscoelastic Mechanotransduction Studies.
Cacopardo L, Guazzelli N, Ahluwalia A. Cacopardo L, et al. Tissue Eng Part B Rev. 2022 Aug;28(4):912-925. doi: 10.1089/ten.TEB.2021.0151. Epub 2021 Dec 6. Tissue Eng Part B Rev. 2022. PMID: 34555953 Free PMC article. Review.
Cited by
- Determination by Relaxation Tests of the Mechanical Properties of Soft Polyacrylamide Gels Made for Mechanobiology Studies.
Pérez-Calixto D, Amat-Shapiro S, Zamarrón-Hernández D, Vázquez-Victorio G, Puech PH, Hautefeuille M. Pérez-Calixto D, et al. Polymers (Basel). 2021 Feb 20;13(4):629. doi: 10.3390/polym13040629. Polymers (Basel). 2021. PMID: 33672475 Free PMC article. - Opposite responses of normal hepatocytes and hepatocellular carcinoma cells to substrate viscoelasticity.
Mandal K , Gong Z , Rylander A , Shenoy VB , Janmey PA . Mandal K , et al. Biomater Sci. 2020 Mar 7;8(5):1316-1328. doi: 10.1039/c9bm01339c. Epub 2020 Jan 6. Biomater Sci. 2020. PMID: 31903466 Free PMC article. - A blueprint of the topology and mechanics of the human ovary for next-generation bioengineering and diagnosis.
Ouni E, Peaucelle A, Haas KT, Van Kerk O, Dolmans MM, Tuuri T, Otala M, Amorim CA. Ouni E, et al. Nat Commun. 2021 Sep 23;12(1):5603. doi: 10.1038/s41467-021-25934-4. Nat Commun. 2021. PMID: 34556652 Free PMC article. - Engineering the viscoelasticity of gelatin methacryloyl (GelMA) hydrogels via small "dynamic bridges" to regulate BMSC behaviors for osteochondral regeneration.
Liu C, Yu Q, Yuan Z, Guo Q, Liao X, Han F, Feng T, Liu G, Zhao R, Zhu Z, Mao H, Zhu C, Li B. Liu C, et al. Bioact Mater. 2022 Aug 6;25:445-459. doi: 10.1016/j.bioactmat.2022.07.031. eCollection 2023 Jul. Bioact Mater. 2022. PMID: 37056254 Free PMC article. - Controlled Quenching of Agarose Defines Hydrogels with Tunable Structural, Bulk Mechanical, Surface Nanomechanical, and Cell Response in 2D Cultures.
Piazza F, Parisse P, Passerino J, Marsich E, Bersanini L, Porrelli D, Baj G, Donati I, Sacco P. Piazza F, et al. Adv Healthc Mater. 2023 Oct;12(26):e2300973. doi: 10.1002/adhm.202300973. Epub 2023 Jul 9. Adv Healthc Mater. 2023. PMID: 37369130 Free PMC article.
References
Publication types
MeSH terms
Substances
LinkOut - more resources
Full Text Sources
Other Literature Sources
