Structural basis for DNMT3A-mediated de novo DNA methylation - PubMed (original) (raw)
. 2018 Feb 15;554(7692):387-391.
doi: 10.1038/nature25477. Epub 2018 Feb 7.
Rui Lu 2 3, Pengcheng Wang 4, Yang Yu 4, Dongliang Chen 2 3, Linfeng Gao 4, Shuo Liu 4, Debin Ji 5, Scott B Rothbart 3 6, Yinsheng Wang 4 5, Gang Greg Wang 2 3, Jikui Song 1 4
Affiliations
- PMID: 29414941
- PMCID: PMC5814352
- DOI: 10.1038/nature25477
Structural basis for DNMT3A-mediated de novo DNA methylation
Zhi-Min Zhang et al. Nature. 2018.
Abstract
DNA methylation by de novo DNA methyltransferases 3A (DNMT3A) and 3B (DNMT3B) at cytosines is essential for genome regulation and development. Dysregulation of this process is implicated in various diseases, notably cancer. However, the mechanisms underlying DNMT3 substrate recognition and enzymatic specificity remain elusive. Here we report a 2.65-ångström crystal structure of the DNMT3A-DNMT3L-DNA complex in which two DNMT3A monomers simultaneously attack two cytosine-phosphate-guanine (CpG) dinucleotides, with the target sites separated by 14 base pairs within the same DNA duplex. The DNMT3A-DNA interaction involves a target recognition domain, a catalytic loop, and DNMT3A homodimeric interface. Arg836 of the target recognition domain makes crucial contacts with CpG, ensuring DNMT3A enzymatic preference towards CpG sites in cells. Haematological cancer-associated somatic mutations of the substrate-binding residues decrease DNMT3A activity, induce CpG hypomethylation, and promote transformation of haematopoietic cells. Together, our study reveals the mechanistic basis for DNMT3A-mediated DNA methylation and establishes its aetiological link to human disease.
Conflict of interest statement
Author Information
The authors declare no competing financial interests
Figures
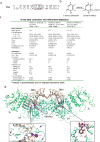
Extended Data Figure 1. Structures of the DNMT3A–DNMT3L tetramer in complex with the 10/11-mer DNA
a, The sequence of the 10/11-mer DNA duplex used for structural study. b, Chemical formula of the covalent adduct of DNMT3A and 2′-deoxy-Zebularine. c, Data collection and refinement statistics. Each dataset was collected from a single crystal. d, Ribbon representations of the DNMT3A–DNMT3L tetramer in complex with the 10/11-mer DNA duplex and AdoHcy. DNMT3A, DNMT3L and DNA are colored in light blue, green and wheat, respectively, and AdoHcy shown in sphere representation. The boxed areas show expanded views for the CpG sites (purple and yellow), the DNA-binding TRD and catalytic loops (left box) and the flipped out 2′-deoxy-Zebularine (dZ6′) surrounded by conserved catalytic residues (right box). The Fo–Fc omit map of dZ6′ (pink) is contoured at 3σ level. The hydrogen-bonding interactions are depicted as dashed lines.
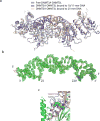
Extended Data Figure 2. Intermolecular interactions between the DNMT3A–DNMT3L tetramer and DNA
a, Structural overlay of free DNMT3A-DNMT3L (PDB 2QRV) with the 10/11-mer DNA and 25-mer DNA-bound states. b, Stick representation of the 25-mer DNA duplex bound to the DNMT3A-DNMT3L tetramer, with the 2Fo-Fc omit map contoured at 1σ level. c, The two helices of DNMT3A that interact with DNMT3L (shown in green) are colored in pink (α4 and α5 in accordance with the numeration in Extended Data Figure 3g) and preceded by two DNA contact loops, colored in blue. The flipped out Zebularine (Z5) is colored in purple. The bound AdoHcy molecule is shown in sphere representation.
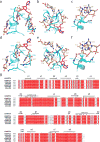
Extended Data Figure 3. Various intermolecular interactions between the two DNMT3A monomers and DNA
a–f, DNA binding by the first and second DNMT3A monomer (defined as 3A and 3A′, respectively, in Fig. 1c) includes the intermolecular interactions between DNMT3A’s TRD loop and DNA major groove (a,d), between DNMT3A’s catalytic loop and DNA minor groove (b,e), and between DNMT3A’s homodimeric interface and DNA backbone (c,f). The hydrogen-bonding interactions are shown as dashed lines. The water molecules are shown as purple spheres. g, Structure-based sequence alignment of DNMT3 proteins from human (hDNMT3A and hDNMT3B), mouse (mDnmt3a and mDnmt3b) and zebrafish (zDnmt3a and zDnmt3b). Completely conserved residues are colored in white and highlighted in red. Partially conserved residues are colored in red. Secondary structures are shown above the aligned sequences. The DNA binding residues as revealed by this study are marked with black triangles.
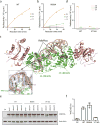
Extended Data Figure 4. The essential roles for the CpG-engaging residues of DNMT3A, R836 and V716, in DNMT3A-mediated CpG versus non-CpG methylations
a, b, DNA methylation kinetics analysis of wild-type (DNMT3AWT, panel a) and R836A-mutated (DNMT3AR836A, panel b) DNMT3A using the CpG-, CpA- or CpT-containing DNA substrates (n = 3 biological replicates). Purified DNMT3A–DNMT3L tetramer complex was used for measurements, followed by fitting with first-order exponential equation. c, Ribbon representation of the crystal structure of DNMT3AR836A–DNMT3L tetramer in complex with the 25-mer DNA, with the CpG recognition by one of the DNMT3A monomer shown in expanded view. The 2Fo-Fc omit map of DNA was contoured at 0.8σ level, and colored in light blue. d, Methylation assay using either DNMT3AWT or DNMT3AV716G on CG-, CA- and CT-containing DNA (n = 3 biological replicates). e, Immunoblots detect reconstituted expression of the indicated DNMT3A among TKO mouse ES cells, either the pooled stable-expression cell population or single cell-derived clonal lines. Shown is a representative blot of two independent experiments. For gel source data, see Supplementary Figure 1. f, Liquid chromatography–mass spectrometry (LC-MS) analysis reveals the global 5-mC levels (as calculated by 5-mdC/dG in y-axis) in the TKO ES cells after stable transduction of EV or the indicated DNMT3A (n = 3 biological replicates). Data are mean ± s.d. EV, empty vector.
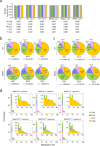
Extended Data Figure 5. eRRBS reveals distribution of cytosine methylations in each sequence context among TKO ES cells with reconstituted expression of either DNMT3AWT or DNMT3AR836A
a, The rates of bisulfite conversion for the indicated sequence context in each sample as determined by the unmethylated lambda DNA spike-in control. CpN, all cytosines. b, c, Piecharts showing the percentage of methylated cytosines (total number n shown at the bottom of each plot) identified among the DNMT3AWT or DNMT3AR836A-expressing TKO ES cells in each sequence context. The methylated cytosines were called using a stringent binomial distribution–based filter to eliminate false positives from incomplete bisulfite conversion, with a false discovery rate (FDR) of 1% and 0.1% set for panel b and c, respectively. d, Distribution of methylation levels (% in x-axis) for the indicated sequence context. Insert panels show a closed view of the distribution at sites with intermediate to high levels of cytosine methylation.
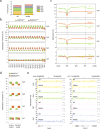
Extended Data Figure 6. CpG and non-CpG methylations induced by DNMT3AWT versus DNMT3AR836A in the TKO ES cells
a, Overall methylation levels of cytosines at four different sequence contexts as detected by eRRBS. Shown on y-axis is the averaged methylation level of all cytosines within the mouse genome as calculated by normalization of the detected methylation cytosines over total cytosine numbers in the TKO ES cells reconstituted with either DNMT3AWT (left) or DNMT3AR836A (right). b, Global levels of CpG and CpH (H= A, C or T) methylation induced by DNMT3AWT (green) or DNMT3AR836A (red) across the mouse chromosomes of the TKO ES cells. Shown are boxplots of 10 kb-bin-averaged methylation levels of each mouse chromosome. c, Global levels of CpG and CpH methylation induced by DNMT3AWT (green) versus DNMT3AR836 (red) across all annotated genes. Each gene was divided into 100 equally sized bins and the 10 Kb flanking region was divided into 50 equally sized bins. Averaged methylation levels were plotted for each bin. TSS, transcription start site; TES, transcription end site. d, Global levels of CpG and CpH methylation induced by DNMT3AWT (green) versus DNMT3AR836A (red) on the two opposite DNA strands. Shown are boxplots of 10 kb-bin-averaged CpG, CpA, CpC and CpT methylation levels of each strand. e, Representative gene-wide views of CpG and CpH methylations at Foxp1 and Dock1, which are grouped into either forward (+) or reverse (-) DNA strand. Shown are cytosines covered by at least 15 reads from eRRBS data, with each site designated by a vertical line. Panels a-e use the combined dataset of three biological replicates per group. Box plots depict the interquartile range, and whiskers depict 1.5× interquartile range.
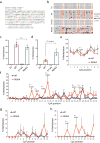
Extended Data Figure 7. Sanger bisulfite sequencing to validate the cytosine methylation levels mediated by DNMT3A, either WT or defective in recognizing the CpG substrate, among the TKO mouse ES cells
a, Sequence of the examined major satellite DNA region. Primers used for bisulfite PCR are denoted with 5′ and 3′ primer paring. The counts for cytosines, highlighted in color, are 9 for the CG dinucleotide, 33 for CA, 14 for CT, and 13 for CC. b, A representative result for bisulfite sequencing analysis of the major satellite repeat region described above in the TKO cells expressing EV, WT DNMT3A or the indicated mutant. Each row represents one DNA clone and each column represents one site of cytosine, either methylated (filled) or unmethylated (open). c, d, Percentage of methylation mediated by DNMT3A or the indicated mutant at CpG (c) and non-CG (d) sites within the examined major satellite DNA region in the TKO ES cells. Data are mean ± s.d.; n= 4 independent bisulfite sequencing experiments as shown in b. e-h, Average cytosine methylation levels at each individual site grouped by the CpG (e), CpA (f), CpT (g) or CpC (h) context in the examined major satellite DNA among the TKO ES cells reconstituted with DNMT3AWT versus DNMT3AR836A (n = 4 biological replicates; mean ± s.d., with the labeled p values). EV, empty vector. Statistical analysis used two-tailed Student’s t-test: n.s., not significant.
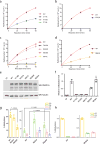
Extended Data Figure 8. Effect of hematological cancer-associated mutations of DNMT3A on DNA methylation in vitro and in mouse TKO ES cells
a, Methylation kinetics of DNMT3A with mutations located at the catalytic loop, in comparison to DNMT3AWT. b, Methylation kinetics of DNMT3A with an active site mutation, R792H. c, Methylation kinetics of DNMT3A with mutations located at the TRD loop. d, Methylation kinetics of DNMT3A with the hotspot mutation R882H. For panels a-d, DNMT3A–DNMT3L complex was used for the measurements (n = 3 biological replicates), followed by fitting with first-order exponential equation. These data were measured independently from data shown in Fig. 4c. e, Immunoblot detects stable reconstitution of DNMT3AWT or the indicated DNMT3A mutant in the TKO ES cells. Shown is a representative blot of two independent experiments. For gel source data, see Supplementary Figure 1. f, LC-MS analysis reveals the global 5-mC levels (as calculated by 5-mdC/dG) in the TKO ES cells after stable transduction of empty vector (EV) or the indicated DNMT3A. Plotted are the methylation levels relative to TKO cells expressing DNMT3AWT. Data are mean ± s.d.; n = 4 biological replicates. g, Individual bisulfate sequencing detects the methylation level of cytosines in each sequence context within a major satellite DNA site at chromosome 2 in the TKO cells reconstituted with DNMT3AR836W (right), in comparison to DNMT3AWT (left) or DNMT3AR836A (middle; as determined in Fig. 3g) (n = 4; mean ± s.d.). Statistical analysis used two-tailed Student’s t-test. h, In vitro methylation of CG, CA or CT-containing DNA using DNMT3AWT (left) or DNMT3AR836W (right) in complex with DNMT3L, reacted for 40 min (n = 3 biological replicates). Plotted are the methylation levels relative to CG-containing DNA substrates. Data are mean ± s.d.
Extended Data Figure 9. Effect of hematological cancer-associated mutations of DNMT3A on genomic DNA methylation in the TF-1 leukemia cells
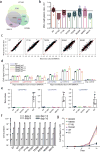
a, Immunoblot of the TF-1 cells stably transduced with Myc-tagged DNMT3A, either WT or the indicated cancer-associated mutants. EV, empty MSCV vector. Shown is a representative blot of two independent experiments. For gel source data, see Supplementary Figure 1. b, Profiling of the indicated DNMT3A-expressing TF-1 cell lines with the HumanMethylation_450K BeadChip array reveals the mean methylation beta values for all examined CpGs. Each dot represents a biological replicate, i.e., an independently derived stable-expression cell line (n = 3-8 biological replicates per group; mean ± s.d.). Statistical analysis used two-tailed Student’s t-test. NS, not significant. c, Density plot of methylation beta values for all examined CpGs in the indicated DNMT3A-expressing TF-1 cell lines. The inserted box shows a zoom-in view for densities for highly methylated DNA sites among the indicated samples. Data are mean ± s.d., with the labeled p values. Statistical analysis used two-tailed Student’s t-test: NS, not significant. d, Sanger bisulfite sequencing of the indicated regions from TF-1 cell lines stably transduced with EV, DNMT3AWT or the indicated cancer-associated mutant. Individual CpG sites (circles) are filled with black (methylated) or white (unmethylated). Red circles denote the CpG sites covered by the Illumina Infinium 450K DNA methylation array. Data are mean ± s.d.; n = 3 biological replicates. e, Methylation values of the indicated CpG sites (labeled by red circles in d) based on the measurements with the Infinium 450K DNA methylation arrays (n = 3-8 biological replicates; mean ± s.d.).
Extended Data Figure 10. Effect of hematological cancer-associated DNMT3A mutations on DNA hypo-methylation and cytokine-independent growth of the TF-1 leukemia cells
a, Venn diagram of CpG sites with hypo-methylation induced by either one of the three indicated strong DNA-binding-defective mutants of DNMT3A, V716D, K841E and R792H. b, c, Bar plots (b) and scatter plots (c) showing methylation difference at the 605 commonly hypo-methylated CpG sites identified in panel a among the TF-1 cells with stable transduction of either DNMT3AWT or the indicated mutant, in comparison to empty MSCV vector (EV). A black line in b indicates EV control (n = 3-8 biological replicates per group; mean ± s.d.). Plotted in c are mean methylation beta values of each individual CpG in the indicated DNMT3A experimental group (x-axis) and control EV group (y-axis; n = 3-8 biological replicates per group). d, e, Comparable occupancy of DNMT3A and its mutant forms at the indicated genomic loci with affected DNA methylation, as measured by ChIP analysis of the Myc-tagged DNMT3AWT or mutants in TF-1 stable-expression cell lines. Tested sites by ChIP-qPCR in panel d (n = 3 biological replicates; mean ± s.d.) included three CpG sites showing hypo-methylation due to expression of mutant DNMT3A (left; also see Extended Data Fig. 9e), three sites showing hyper-methylation due to expression of DNMT3AWT (middle; also see panel e, which shows mean methylation beta values from measurements with the Infinium 450K DNA methylation arrays, n = 3-8 biological replicates; mean ± s.d.), and a negative control locus (right; the GAPDH transcription start site). The anti-Myc antibody was used for ChIP and the EV-expressing TF-1 cells used as cell control for unspecific binding. f, Proliferation of the indicated DNMT3A stable-expression TF-1 cells in the presence of a supporting cytokine, GM-CSF (n = 2 biological replicates; mean ± s.d.). g, Proliferation of the indicated DNMT3A-expressing TF-1 cells after GM-CSF withdrawal (n = 3 biological replicates; mean ± s.d.).
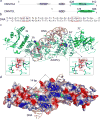
Figure 1. Structure of the DNMT3A–DNMT3L tetramer in complex with a 25-mer DNA duplex containing two CpG sites
a, Domain architectures of DNMT3A and DNMT3L, with the C-terminal domains marked with arrowheads. b, DNA sequence used for structural study. Z, Zebularine. c, d, Ribbon (c) and surface (d) representations of DNMT3A–DNMT3L bound to DNA and AdoHcy. The Zebularines anchored at the two active sites are 14-bp away and shown in expanded views, with hydrogen-bonding interactions depicted as dashed lines and the Fo–Fc omit map (pink) of Z5 or Z20′ contoured at 3σ level.
Figure 2. Structure comparison of free and DNA-bound DNMT3A–DNMT3L tetramer
a, Schematic view of the intermolecular interactions between DNMT3A and DNA. The hydrogen-bonding, electrostatic and van der Waals contacts are represented by red, blue and black arrows, respectively. Water-mediated hydrogen bonds are labeled with letter ‘W’. b, Structural overlay of free (grey) and DNA-bound (cyan) DNMT3A–DNMT3L. The disordered TRD loops in free DNMT3A-DNMT3L are depicted as dotted lines. c, The TRD loop (blue) in DNA-bound DNMT3A is stabilized by hydrogen-bonding interactions (dashed lines) with R882 and Q886. d, Structural overlay of the catalytic loop between free (grey) and DNA-bound (blue) DNMT3A. e, DNA intercalation by DNMT3A V716.
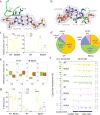
Figure 3. DNMT3A–CpG interactions
a, b, Interactions of R836 (a) and V716-P718 (b) with one CpG site. The hydrogen bonds and water molecule are shown as dashed lines and purple sphere, respectively. Nucleotides in the second CpG site are shown in parenthesis. c, 40-min in vitro methylation using DNMT3AWT–DNMT3L or DNMT3AR836A–DNMT3L complex (n = 3 biological replicates). d, Composition of all called methylated cytosines (mC) in TKO ESCs reconstituted with DNMT3AWT or DNMT3AR836A. An mC is defined using a binomial distribution-based filter with FDR less than 1% (n = 21,678,839 for WT and n = 25,272,362 for R836A). e, f, eRRBS revealing averaged CpG and non-CpG methylations, either at global levels (e) or at a representative major satellite DNA region (f), that are induced by DNMT3AWT versus DNMT3AR836A among 3 independent lines of TKO ESCs. Shown in e are boxplots of 10 kb-bin-averaged methylation levels for each sequence context. +/−, forward/reverse strand. Box plots and whiskers depict the interquartile and 1.5× interquartile ranges, respectively. g, Individual bisulfate sequencing detecting the methylation level of CG, CA, CT or CC sites within a major satellite DNA site at chromosome 2 in TKO cells expressing DNMT3AWT or DNMT3AR836A (n = 4). Data are mean ± s.d. Statistical analysis used two-tailed Student’s t-test. ***, p < 0.001.
Figure 4. Hematological cancer-associated mutations of the DNMT3A–DNA interaction residues
a, b, Surface (a) and stick (b) views of DNMT3A’s DNA-contacting residues found mutated in hematological cancer. Mutation sites are colored blue in a. The hydrogen-bonding interactions and water molecule are shown as dashed lines and purple sphere, respectively. c, In vitro methylation of CpG DNA using DNMT3AWT or its hematological cancer-associated mutants (n = 3). d, DNMT3A immunoblots (top) and LC-MS-based quantification of mC (bottom, n = 3 biological replicates) among TKO ESCs re-expressing DNMT3AWT alone (##, non-tagged) or together with the equal amount of the indicated DNMT3A mutant (#, tagged). Shown is a representative blot of two independent experiments. For gel source data, see Supplementary Figure 1. e, Scatter plots showing mean methylation beta values of each individual CpG among TF1 cells with stable expression of the indicated DNMT3A mutant (y-axis; n = 3-8 biological replicates) in comparison to empty vector controls (EV, x-axis), with significantly differentially methylated CpGs depicted in red. f, Proliferation of the indicated DNMT3A-expressing TF-1 cells under cytokine-poor conditions (n = 3). Data are mean ± s.d. Statistical analysis used two-tailed Student’s t-test. ***, p < 0.001.
Comment in
- DNMT3A DNA-Binding Residues Provide Specificity for CpG DNA Methylation.
[No authors listed] [No authors listed] Cancer Discov. 2018 Apr;8(4):OF14. doi: 10.1158/2159-8290.CD-RW2018-028. Epub 2018 Feb 16. Cancer Discov. 2018. PMID: 29453236
Similar articles
- Structure of Dnmt3a bound to Dnmt3L suggests a model for de novo DNA methylation.
Jia D, Jurkowska RZ, Zhang X, Jeltsch A, Cheng X. Jia D, et al. Nature. 2007 Sep 13;449(7159):248-51. doi: 10.1038/nature06146. Epub 2007 Aug 22. Nature. 2007. PMID: 17713477 Free PMC article. - Structural insights into CpG-specific DNA methylation by human DNA methyltransferase 3B.
Lin CC, Chen YP, Yang WZ, Shen JCK, Yuan HS. Lin CC, et al. Nucleic Acids Res. 2020 Apr 17;48(7):3949-3961. doi: 10.1093/nar/gkaa111. Nucleic Acids Res. 2020. PMID: 32083663 Free PMC article. - Structural basis for impairment of DNA methylation by the DNMT3A R882H mutation.
Anteneh H, Fang J, Song J. Anteneh H, et al. Nat Commun. 2020 May 8;11(1):2294. doi: 10.1038/s41467-020-16213-9. Nat Commun. 2020. PMID: 32385248 Free PMC article. - Alterations to DNMT3A in Hematologic Malignancies.
Venugopal K, Feng Y, Shabashvili D, Guryanova OA. Venugopal K, et al. Cancer Res. 2021 Jan 15;81(2):254-263. doi: 10.1158/0008-5472.CAN-20-3033. Epub 2020 Oct 21. Cancer Res. 2021. PMID: 33087320 Free PMC article. Review. - Genetic Studies on Mammalian DNA Methyltransferases.
Dan J, Chen T. Dan J, et al. Adv Exp Med Biol. 2016;945:123-150. doi: 10.1007/978-3-319-43624-1_6. Adv Exp Med Biol. 2016. PMID: 27826837 Review.
Cited by
- The ferroptosis landscape in acute myeloid leukemia.
Ma Z, Ye W, Huang X, Li X, Li F, Lin X, Hu C, Wang J, Jin J, Zhu B, Huang J. Ma Z, et al. Aging (Albany NY). 2023 Nov 29;15(22):13486-13503. doi: 10.18632/aging.205257. Epub 2023 Nov 29. Aging (Albany NY). 2023. PMID: 38032290 Free PMC article. - A New Insight into MYC Action: Control of RNA Polymerase II Methylation and Transcription Termination.
Scagnoli F, Palma A, Favia A, Scuoppo C, Illi B, Nasi S. Scagnoli F, et al. Biomedicines. 2023 Jan 30;11(2):412. doi: 10.3390/biomedicines11020412. Biomedicines. 2023. PMID: 36830948 Free PMC article. - Structure-guided functional suppression of AML-associated DNMT3A hotspot mutations.
Lu J, Guo Y, Yin J, Chen J, Wang Y, Wang GG, Song J. Lu J, et al. Nat Commun. 2024 Apr 10;15(1):3111. doi: 10.1038/s41467-024-47398-y. Nat Commun. 2024. PMID: 38600075 Free PMC article. - Overgrowth-intellectual disability disorders: progress in biology, patient advocacy and innovative therapies.
Atterton C, Trew I, Cale JM, Aung-Htut MT, Grens K, Kiernan J, Delagrammatikas CG, Piper M. Atterton C, et al. Dis Model Mech. 2025 May 1;18(5):dmm052300. doi: 10.1242/dmm.052300. Epub 2025 May 12. Dis Model Mech. 2025. PMID: 40353642 Free PMC article. Review. - Substrate deformation regulates DRM2-mediated DNA methylation in plants.
Fang J, Leichter SM, Jiang J, Biswal M, Lu J, Zhang ZM, Ren W, Zhai J, Cui Q, Zhong X, Song J. Fang J, et al. Sci Adv. 2021 Jun 2;7(23):eabd9224. doi: 10.1126/sciadv.abd9224. Print 2021 Jun. Sci Adv. 2021. PMID: 34078593 Free PMC article.
References
- Okano M, Bell DW, Haber DA, Li E. DNA methyltransferases Dnmt3a and Dnmt3b are essential for de novo methylation and mammalian development. Cell. 1999;99:247–257. - PubMed
- Okano M, Xie S, Li E. Cloning and characterization of a family of novel mammalian DNA (cytosine-5) methyltransferases. Nat Genet. 1998;19:219–220. - PubMed
- Bird A. DNA methylation patterns and epigenetic memory. Genes Dev. 2002;16:6–21. - PubMed
- Goll MG, Bestor TH. Eukaryotic cytosine methyltransferases. Annu Rev Biochem. 2005;74:481–514. - PubMed
- Bourc’his D, Xu GL, Lin CS, Bollman B, Bestor TH. Dnmt3L and the establishment of maternal genomic imprints. Science. 2001;294:2536–2539. - PubMed
Publication types
MeSH terms
Substances
Grants and funding
- R01 CA218600/CA/NCI NIH HHS/United States
- R01 CA215284/CA/NCI NIH HHS/United States
- R01 CA211336/CA/NCI NIH HHS/United States
- P30 CA016086/CA/NCI NIH HHS/United States
- S10 OD021832/OD/NIH HHS/United States
- 5R21ES025392/NH/NIH HHS/United States
- R21 ES025392/ES/NIEHS NIH HHS/United States
- R35 GM119721/GM/NIGMS NIH HHS/United States
- R35 GM124736/GM/NIGMS NIH HHS/United States
LinkOut - more resources
Full Text Sources
Other Literature Sources
Molecular Biology Databases
