Tuning dCas9's ability to block transcription enables robust, noiseless knockdown of bacterial genes - PubMed (original) (raw)
Tuning dCas9's ability to block transcription enables robust, noiseless knockdown of bacterial genes
Antoine Vigouroux et al. Mol Syst Biol. 2018.
Abstract
Over the past few years, tools that make use of the Cas9 nuclease have led to many breakthroughs, including in the control of gene expression. The catalytically dead variant of Cas9 known as dCas9 can be guided by small RNAs to block transcription of target genes, in a strategy also known as CRISPRi. Here, we reveal that the level of complementarity between the guide RNA and the target controls the rate at which RNA polymerase "kicks out" dCas9 from the target and completes transcription. We use this mechanism to precisely and robustly reduce gene expression by defined relative amounts. Alternatively, tuning repression by changing dCas9 concentration is noisy and promoter-strength dependent. We demonstrate broad applicability of this method to the study of genetic regulation and cellular physiology. First, we characterize feedback strength of a model auto-repressor. Second, we study the impact of amount variations of cell-wall synthesizing enzymes on cell morphology. Finally, we multiplex the system to obtain any combination of fractional repression of two genes.
Keywords: CRISPRi; CRISPR‐dCas9; gene‐expression noise; peptidoglycan cell wall; single‐cell.
© 2018 The Authors. Published under the terms of the CC BY 4.0 license.
Figures
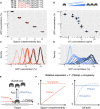
Figure 1. In saturating conditions, CRISPR knockdown can modulate gene expression over a large dynamic range without generating noise
- A, B
Average cellular GFP concentration obtained (A) by changing guide RNA‐target complementarity at a constant high dCas9 concentration or (B) by varying dCas9 levels with increasing concentration of the aTc inducer. Relative GFP concentrations are obtained by high‐throughput microscopy and given relatively to the non‐targeting spacer at high dCas9 expression. Individual points represent independent replicates. Horizontal bars represent the median of three replicates. - C, D
Distribution of GFP concentrations for each experiment in panels (A and B). Curves of the same color represent replicates of the same condition. - E
Mechanistic model of dCas9‐mediated repression. The expression level of a dCas9‐targeted gene is reduced by the product of two probabilities: the probability P(stop) of dCas9 blocking RNAP upon collision if occupying the target, and the probability of dCas9 occupying the target (termed occupancy). The occupancy is determined by binding constant k on, dCas9 concentration [dCas9], and dCas9 unbinding rate k out. The unbinding rate k out, in turn, is the sum of transcription‐independent unbinding rate and kick‐out rate due to collision with the RNAP (see Materials and Methods for details). - F
The two panels schematically illustrate the behavior of the probability of dCas9 blocking RNAP P(stop) and dCas9 occupancy if repression strength is controlled by guide RNA complementarity (left) or dCas9 concentration (right), respectively.
Source data are available online for this figure.
Figure 2. In saturating conditions, CRISPR knockdown by mismatched guide RNAs does not depend on the concentration of active dCas9 complexes
- Left: Schematic of the assay used to investigate dependence on dCas9 complex concentration. R20 is a spacer targeting RFP with a perfect match. R11 targets RFP with 11 bp of complementarity. C is a non‐targeting spacer. Introducing the spacer C in the CRISPR array acts as a decoy and halves the concentration of active dCas9 complex. Right: Northern blot measurement of the concentration of the processed guide RNA R20, reflecting the amount of complexes carrying R20 at the moment of the measurement. Error bars represent standard deviations of three biological replicates. a.u.: arbitrary units.
- Flow cytometry measurement of relative RFP expression levels, with each point representing one biological replicate. The values are normalized with respect to the non‐targeting CRISPR array (C‐C). Expression did not differ in the presence of the decoy (C‐R20 vs. R20‐R20, _P_‐value: 0.68), nor when the order of the array was reversed (C‐R20 vs. R20‐C, _P_‐value: 0.21), even with only 11 bp of complementarity (C‐R11 vs. R11‐R11, _P_‐value: 0.53). _P_‐values come from a two‐sided Student's _t_‐test applied to the natural logarithms of the mean expression (significance threshold: 0.017 after Bonferroni correction).
Source data are available online for this figure.
Figure 3. Relative repression by dCas9 is independent of promoter strength only in saturating conditions
Relative GFP expression measured by flow cytometry for two promoters of different strengths (P127 and PPhlf) and repressed using the same set of spacers for saturating (A, B) and non‐saturating (C) dCas9 concentrations.
- A, B
Raw GFP expression (A) and relative GFP expression with respect to a non‐targeting spacer (B) for a saturating dCas9 concentration. While PPhlF is about three times stronger than P127, the relative expression levels after repression are similar for both promoters. - C
Experimental and predicted relative GFP expression for a non‐saturating dCas9 concentration (using a 40 times lower concentration of aTc). Repression is weaker for the stronger PPhlf promoter for up to six mismatches on the guide RNA, in quantitative agreement with the kick‐out model (see Appendix). Error bars: standard error of the mean of the computational prediction.
Source data are available online for this figure.
Figure 4. The efficiency of CRISPR knockdown is affected by high temperatures
Relative RFP expression measured by flow cytometry upon repression with different levels of complementarity and at different temperatures. The values are normalized with respect to the non‐targeting spacer at each temperature. Source data are available online for this figure.
Figure 5. CRISPR knockdown can be used to quantitatively characterize feedback loops
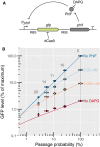
- Schematic of the synthetic feedback loop constructed for this experiment. The strength of the feedback can be modulated by addition of DAPG, an inhibitor of PhlF. RBS: ribosome binding site. T: transcription terminator.
- Flow cytometry measurements and fits to a theoretical model of relative GFP expression levels, where GFP is expressed from the artificial feedback loop presented in panel (A). GFP expression is normalized by the maximal level of GFP expressed constitutively from the PPhlF promoter alone (indicated as “No PhlF”). The GFP is repressed using four different guide RNAs with, respectively, 10, 11, 14, and 20 bp of complementarity. The passage probability 1 – P(stop) associated with each of these guide RNAs was measured in parallel on a strain expressing GFP constitutively from the P127 promoter. Adding different amounts of DAPG to the medium reduces the strength of the feedback, causing the steady‐state level to increase and repression to become more efficient. The colored lines represent the GFP expression as predicted by a mathematical model that was fitted to the data (see Appendix). For each DAPG concentration, a binding constant characterizing the strength of the feedback and a Hill coefficient were determined. Error bars: 95% confidence interval of the mean based on three biological replicates.
Source data are available online for this figure.
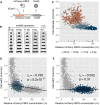
Figure 6. CRISPR knockdown of the mrdAB operon increases cell width at high repression strengths
- A
Schematic of the modified chromosomal locus of the mrdAB operon in strain AV08. - B
Cell shapes observed by phase‐contrast microscopy for cells grown in M63 minimal medium. Different repression levels of the mrdAB operon are compared to wild‐type Eschericha coli. Cells with different cell lengths were picked at random and images were rotated numerically. - C
Cell width as a function of the mCherry‐PBP2 concentration measured by fluorescence microscopy. Each point represents a cell, and colors represent different levels of spacer complementarity. The connected white dots represent the population averages (mean of three biological replicates). The dotted line represents the average cell width for wild‐type E. coli (mean of three replicates). The values are normalized with respect to the non‐targeting spacer. - D, E
Linear regression between mCherry‐PBP2 concentration level and cell width, for the strains repressed with 11 bp (panel D) and 0 bp (no repression, panel E). r S is the Spearman correlation coefficient (median of three biological replicates). The negative value indicates that cells with a lower level of PBP2/RodA tend to be wider. The _P_‐values (two‐sided _F_‐test) measure the certainty that the slope is different from 0.
Source data are available online for this figure.
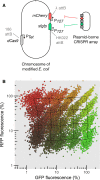
Figure 7. CRISPR knockdown can be multiplexed to modulate expression of two genes without cross‐talk
- Schematic of the strain expressing two reporters and PTet‐dCas9 integrated in the chromosome at phage attachment sites. The levels of the two reporters can be controlled using a plasmid‐borne CRISPR array coding for guide RNAs (diamonds) interspaced with CRISPR repeat motifs (squares), and also carrying the tracrRNA sequence (not shown).
- Relative GFP and RFP concentration given relatively to the non‐targeting spacer measured by high‐throughput microscopy for a collection of 20 CRISPR plasmids. Each point represents a single cell, and each color represents the population obtained with one CRISPR plasmid. The overlaid meshwork connects the median values of the different populations.
Source data are available online for this figure.
Similar articles
- Implementation of dCas9-mediated CRISPRi in the fission yeast Schizosaccharomyces pombe.
Ishikawa K, Soejima S, Masuda F, Saitoh S. Ishikawa K, et al. G3 (Bethesda). 2021 Apr 15;11(4):jkab051. doi: 10.1093/g3journal/jkab051. G3 (Bethesda). 2021. PMID: 33617628 Free PMC article. - A CRISPR Interference Platform for Efficient Genetic Repression in Candida albicans.
Wensing L, Sharma J, Uthayakumar D, Proteau Y, Chavez A, Shapiro RS. Wensing L, et al. mSphere. 2019 Feb 13;4(1):e00002-19. doi: 10.1128/mSphere.00002-19. mSphere. 2019. PMID: 30760609 Free PMC article. - Using an Inducible CRISPR-dCas9-KRAB Effector System to Dissect Transcriptional Regulation in Human Embryonic Stem Cells.
Parsi KM, Hennessy E, Kearns N, Maehr R. Parsi KM, et al. Methods Mol Biol. 2017;1507:221-233. doi: 10.1007/978-1-4939-6518-2_16. Methods Mol Biol. 2017. PMID: 27832543 - A CRISPRi-dCas9 System for Archaea and Its Use To Examine Gene Function during Nitrogen Fixation by Methanosarcina acetivorans.
Dhamad AE, Lessner DJ. Dhamad AE, et al. Appl Environ Microbiol. 2020 Oct 15;86(21):e01402-20. doi: 10.1128/AEM.01402-20. Print 2020 Oct 15. Appl Environ Microbiol. 2020. PMID: 32826220 Free PMC article. - dCas9-VPR-mediated transcriptional activation of functionally equivalent genes for gene therapy.
Riedmayr LM, Hinrichsmeyer KS, Karguth N, Böhm S, Splith V, Michalakis S, Becirovic E. Riedmayr LM, et al. Nat Protoc. 2022 Mar;17(3):781-818. doi: 10.1038/s41596-021-00666-3. Epub 2022 Feb 7. Nat Protoc. 2022. PMID: 35132255 Review.
Cited by
- Repurposing CRISPR-Cas Systems as Genetic Tools for the Enterobacteriales.
Backes N, Phillips GJ. Backes N, et al. EcoSal Plus. 2021 Dec 15;9(2):eESP00062020. doi: 10.1128/ecosalplus.ESP-0006-2020. Epub 2021 Jun 14. EcoSal Plus. 2021. PMID: 34125584 Free PMC article. Review. - Class-A penicillin binding proteins do not contribute to cell shape but repair cell-wall defects.
Vigouroux A, Cordier B, Aristov A, Alvarez L, Özbaykal G, Chaze T, Oldewurtel ER, Matondo M, Cava F, Bikard D, van Teeffelen S. Vigouroux A, et al. Elife. 2020 Jan 6;9:e51998. doi: 10.7554/eLife.51998. Elife. 2020. PMID: 31904338 Free PMC article. - Bacillus subtilis cell diameter is determined by the opposing actions of two distinct cell wall synthetic systems.
Dion MF, Kapoor M, Sun Y, Wilson S, Ryan J, Vigouroux A, van Teeffelen S, Oldenbourg R, Garner EC. Dion MF, et al. Nat Microbiol. 2019 Aug;4(8):1294-1305. doi: 10.1038/s41564-019-0439-0. Epub 2019 May 13. Nat Microbiol. 2019. PMID: 31086310 Free PMC article. - CRISPR Interference (CRISPRi) for Targeted Gene Silencing in Mycobacteria.
Wong AI, Rock JM. Wong AI, et al. Methods Mol Biol. 2021;2314:343-364. doi: 10.1007/978-1-0716-1460-0_16. Methods Mol Biol. 2021. PMID: 34235662 - A simplified strategy for titrating gene expression reveals new relationships between genotype, environment, and bacterial growth.
Mathis AD, Otto RM, Reynolds KA. Mathis AD, et al. Nucleic Acids Res. 2021 Jan 11;49(1):e6. doi: 10.1093/nar/gkaa1073. Nucleic Acids Res. 2021. PMID: 33221881 Free PMC article.
References
Publication types
MeSH terms
Substances
LinkOut - more resources
Full Text Sources
Other Literature Sources
Research Materials
Miscellaneous


