Integrative structure and functional anatomy of a nuclear pore complex - PubMed (original) (raw)
. 2018 Mar 22;555(7697):475-482.
doi: 10.1038/nature26003. Epub 2018 Mar 14.
Javier Fernandez-Martinez 2, Ilona Nudelman 2, Yi Shi 3, Wenzhu Zhang 3, Barak Raveh 1, Thurston Herricks 4, Brian D Slaughter 5, Joanna A Hogan 6, Paula Upla 7, Ilan E Chemmama 1, Riccardo Pellarin 1, Ignacia Echeverria 1, Manjunatha Shivaraju 5, Azraa S Chaudhury 2, Junjie Wang 3, Rosemary Williams 2, Jay R Unruh 5, Charles H Greenberg 1, Erica Y Jacobs 3, Zhiheng Yu 8, M Jason de la Cruz 8, Roxana Mironska 2, David L Stokes 7, John D Aitchison 4 9, Martin F Jarrold 6, Jennifer L Gerton 5, Steven J Ludtke 10, Christopher W Akey 11, Brian T Chait 3, Andrej Sali 1, Michael P Rout 2
Affiliations
- PMID: 29539637
- PMCID: PMC6022767
- DOI: 10.1038/nature26003
Integrative structure and functional anatomy of a nuclear pore complex
Seung Joong Kim et al. Nature. 2018.
Abstract
Nuclear pore complexes play central roles as gatekeepers of RNA and protein transport between the cytoplasm and nucleoplasm. However, their large size and dynamic nature have impeded a full structural and functional elucidation. Here we determined the structure of the entire 552-protein nuclear pore complex of the yeast Saccharomyces cerevisiae at sub-nanometre precision by satisfying a wide range of data relating to the molecular arrangement of its constituents. The nuclear pore complex incorporates sturdy diagonal columns and connector cables attached to these columns, imbuing the structure with strength and flexibility. These cables also tie together all other elements of the nuclear pore complex, including membrane-interacting regions, outer rings and RNA-processing platforms. Inwardly directed anchors create a high density of transport factor-docking Phe-Gly repeats in the central channel, organized into distinct functional units. This integrative structure enables us to rationalize the architecture, transport mechanism and evolutionary origins of the nuclear pore complex.
Conflict of interest statement
The authors declare no competing financial interests.
Figures
Extended Data Figure 1. Integrative structure determination of the S. cerevisiae NPC at 9 Å precision
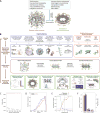
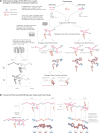
(A) A simplified schematic diagram of integrative structure determination of the S. cerevisiae NPC. Random initial structures of the Nups and their sub-complexes were optimized by satisfying spatial restraints implied by the input information. (B) The full description of Integrative structure determination of the S. cerevisiae NPC, proceeded through four stages– (Supplementary Table 3): (1) gathering data, (2) representing subunits and translating data into spatial restraints, (3) configurational sampling to produce an ensemble of structures that satisfies the restraints, and (4) analyzing and validating the ensemble structures and data (Supplementary Tables 2 to 4; Extended Data Figs. 7 and 8; Methods). The integrative structure modeling protocol (i.e., stages 2, 3, and 4) was scripted using the Python Modeling Interface (PMI) package, version 4d97507, a library for modeling macromolecular complexes based on our open-source Integrative Modeling Platform (IMP) package, version 2.6 (
https://integrativemodeling.org
). (C) Convergence of the structure score, for the 5,529 good-scoring NPC structures; the scores do not continue to improve as more structures are computed essentially independently. The error bar represents the standard deviations of the best scores, estimated by repeating sampling of NPC structures ten times (n=10, mean score values plotted). The red dotted line indicates the total score threshold (88,644.1) that defines the good-scoring NPC structures (Methods). (D) Distribution of scores for structure samples 1 (red) and 2 (blue), comprising the 5,529 good-scoring NPC structures (nsample1=2,359 and nsample2=3,170 structures). The non-parametric Kolmogorov-Smirnov two-sample test, (two-sided) indicates that the difference between the two score distributions is insignificant (p-value (1.0) > 0.05). In addition, the magnitude of the difference is small, as demonstrated by the Kolmogorov-Smirnov two-sample test statistic, D, of 0.045. Thus, the two score distributions are effectively equal. (E) Three criteria for determining the sampling precision (Y-axis), evaluated as a function of the RMSD clustering threshold (X-axis) (n=5,529 structures). First, the p-value is computed using the χ2-test (one-sided) for homogeneity of proportions (red dots). Second, an effect size for the χ2-test is quantified by the Cramer’s V value (blue squares). Third, the population of structures in sufficiently large clusters (containing at least 10 structures from each sample) is shown as green triangles. The vertical dotted grey line indicates the RMSD clustering threshold at which three conditions are satisfied (χ2-test p-value (0.75) > 0.05 (red, horizontal dotted line), Cramer’s V (0.065) < 0.10 (blue, horizontal dotted line), and the population of clustered structures (0.90) > 0.80 (green, horizontal dotted line)), thus defining the sampling precision of 9 Å. The three solid curves (in red, blue, and green) were drawn through the points, to help visualize the results. (F) Population of sample 1 and 2 structures in the three clusters obtained by threshold-based clustering using a RMSD threshold of 12 Å. The dominant cluster (cluster 1) contains 80.3% of the structures. Cluster precision is shown for each cluster. The precision of the dominant cluster defines the structure precision.
Extended Data Figure 2. Quantitative analysis of the mass and stoichiometry of the endogenous NPC (I)
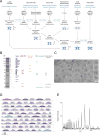
(A) A multipronged approach to accurately define the mass, stoichiometry, and composition of native macromolecular assemblies. Schematic representation is shown of the multiple orthologous methods that are integrated in our strategy for the analysis of native assemblies. The main experimental methods are listed on top, followed by the characteristic that they help to quantify (in blue) and the type of sample to which they were applied. The final outcome of each method is indicated (black arrows); the steps of each method that are compared to serve as a control cross-check are indicated (blue dashed lines). At bottom, the integration of the different data points into a final comprehensive description of the endogenous assembly is depicted. Small cartoon insets of the NPC are used to illustrate the analysis. (B) SDS-PAGE analysis of the affinity captured S. cerevisiae NPCs isolated from an MLP1-ppxPrA tagged strain (n>20 independent experiments). Molecular weight marker values are indicated to the left of the gel lane. Dots signify the main protein components of the isolated NPCs as identified by LC-MS (Extended Data Fig. 3C). Proteins are grouped and coloured by functional categories or membership of discrete macromolecular assemblies (blue - Nups; red - mRNA transport factors (TF); orange - Transport factors; green - TREX complex; grey - contaminants/others). For gel source data, see Supplementary Figure 1. (C) Cryo-EM analysis of the affinity captured NPCs (n>20 independent experiments). The particles have a clear preferred orientation (Methods). Some side views are presented in the inset. The central transporter is present in every NPC (indicated by “T”). Scale bar 1000 Å. (D) Schematic showing the primary amino acid sequence of the 148.2 kDa synthetic QconCAT-A. It includes two peptides for each Nup (thick bars), arranged in the indicated order. The native three amino acid residues flanking regions (thin bars) of each peptide were included to preserve the native trypsin target sequence. A sacrificial N-terminal 3×FLAG tag was included, as well as a C-terminal 6×His tag for purification under denaturing conditions. The stringent criteria used for the selection of the QconCAT peptides are described in detail in the Methods section. (E) MALDI-MS spectrum of intact, purified full-length stable isotopically labeled QconCAT-A, showing that a single species was detected. n+ (n=1,2,…,17) denotes the Qconcat-A protein species with n positive charges and 2M Qconcat-A protein dimer. The measured molecular weight of the stable isotopically labeled QconCAT-A was 149,049 ± 38 Da, agreeing with its calculated molecular weight of 148,200 Da (Methods).
Extended Data Figure 3. Quantitative analysis of the mass and stoichiometry of the endogenous NPC (II)
(A) Left, schematic localization of the Nup-GFP reporters selected for the in vivo calibrated imaging stoichiometry analyses. Nups were selected to represent every major NPC module and to provide comprehensive coverage of the assembly. Right, from the calibrated imaging data, Kernel density estimation of distributions of GFP proteins per Nup were calculated. n = 48 – 178. (B) Heat map of a yeast cell expressing Nup85-GFP. Image (right) was acquired as described in Methods. In addition, for illustration purposes, a max projection over z was done, and the image was smoothed with a Gaussian blur of radius 1. A heat map was used to illustrate intensity units, in raw photon counts. For the spot outlined in red, a 2 dimensional distribution of photon counts, and the corresponding Gaussian fit, are shown (left). (C) Stoichiometries of main components associated with the affinity captured NPCs, as determined by label-free MS quantitation (at least 3 peptides per protein). Proteins are grouped and coloured by functional categories or membership of discrete macromolecular assemblies. TREX complex components are included in the “Transport Factors” category and labeled with an asterisk. QConCAT-derived stoichiometries for all the Nups (dark grey bars) are shown for comparison.
Extended Data Figure 4. Cryo-ET strategy and the resulting 3D Cryo-ET map of the NPC exhibiting non-enforced local C2-symmetry axes in the inner ring
Labels throughout the figure are: C for cytoplasm, N for nucleoplasm, T for central transporter, S for core scaffold, MR for membrane ring, IR for inner ring. Scale bar 100 Å. (A) A diagram describing the methodology used to obtain the whole S. cerevisiae NPC Cryo-ET map (Methods). (B) 2D class averages are shown (protein white) which were calculated using the original unaligned sub-tomograms projected along the Z-axis. The overall thickness of the yeast NPC is apparent in a side view class, and the local C2-symmetry axes in the inner ring are also apparent (indicated with “2”). The transporter density is present in every class. (C) Left, top view of the Cryo-ET map with the two local C2-symmetry axes indicated by arrows and labels (sym 1 and sym 2). They are 22.5° apart, due to the C8-symmetry axis. Right, 2D projections of the top view, and two side views along the two local C2-symmetry axes (side 1 and side 2 projected along axes sym 1 and sym 2, respectively). (D) Seven cross-sections of the Cryo-ET map are shown on the right (1–7) with their positions in the 3D map indicated in the side view on the left. The local C2-symmetry of the inner-ring is apparent in cross-sections 2–6 mirrored about the central section in panel 4.
Extended Data Figure 5. Resolution estimates for the Cryo-ET map of the NPC and comparison of cross-sections between the intermediate, final and Relion Cryo-ET maps
(A) Top and (B) side views of the Cryo-ET map are colour-coded according to local resolution estimates (colour bar) and are shown at a low threshold to reveal weaker density features at the periphery of the NPC, which are more flexible. (C) Cross-sections are shown at a reduced scale, colour coded according to local resolution estimates (colour bar). A remnant of the pore membrane is present (M), encircling the entire mid-line of the NPC. Sections 3–5 are shown at a higher threshold. In section 3, the inner ring region is indicated by “spokes”. In section 4, local C2-symmetry axes are indicated by dashed arrows. (D) Thick sections of the inner ring are shown at a higher threshold, as viewed along the membrane plane. Note that the inner ring (indicated) is almost entirely in the 20–25 Å resolution range. C, cytoplasmic side; N, nuclear side; CR, cytoplasmic ring; NR, nuclear ring; M, pore membrane; T, central transporter. (E) Comparison of 5 cross-sections (cross-section number on left) in the inner ring region of the NPC between Cryo-ET maps in different stages of the reconstruction process (Extended Data Fig. 4A): intermediate map (left column), final map (middle column) and an independent validation map, reconstructed with Relion at a twice reduced Å/pixel size (right column). Details on how each map was reconstructed are provided in the Methods section.
Extended Data Figure 6. 2D classification of projections from 1,864 original NPC sub-tomograms aligned with their C8-symmetry axis nearly along the Z-axis
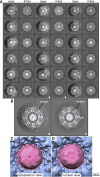
(A) In total, 18 good class averages are shown after Maximum Likelihood classification (using RELION 1.4,) without symmetry imposed. Each class average (on the left) is paired with a C8-symmetry enforced image of itself (on the right). Central transporter densities are present in each of the class averages (both with and without imposed C8-symmetry), indicating that the central transporter is generally present in these particles. (B) An expanded view of a large class from panel A (marked by white dots) shows bridges (indicated) between the core scaffold and the central transporter, both before and after averaging using the C8-symmetry of the NPC. S, core scaffold; MR, membrane ring; T, central transporter. Matching panels in A and B are marked with white dots. (C,D) The Cryo-ET 3D map is presented as in Fig. 3 and is zoomed in to show the meshwork of bridges between the scaffold and the central transporter, as viewed from the cytoplasm and the nucleoplasm, respectively.
Extended Data Figure 7. Validation of the NPC structure (I)
(A–C) Satisfaction of the chemical cross-links (A) Identified cross-links were mapped onto the integrative structure of the entire NPC, as shown in front (upper) and top (lower) views. Satisfied cross-links, whose Cα–Cα distances fall within the distance threshold of 35 Å in at least one good-scoring solution, are shown in blue. Violated cross-links, whose Cα–Cα distances are larger than 35 Å, are shown in orange. The histogram on the right shows the distribution of the cross-linked Cα–Cα distances, validating the NPC structure. (B) Mapping of the cross-links onto the cytoplasmic and nucleoplasmic connector Nups (Nup116, Nup100, Nup145N, Nup1, and Nup60). Front (right) and side (left) views show how the NPC outer rings are connected to the inner ring through a network of connector Nups across the length of the spoke. (C) Mapping of the cross-links onto the inner- (and membrane) and outer-rings, in front (upper) and top (lower) views. (D–G) Satisfaction of data and considerations that were not used to compute the structure (D) The integrative structure of the NPC (this study, left panel) was compared to the 2007 topological map, (right panel). The two structures are consistent with each other, albeit the current structure is defined at an order of magnitude higher precision. (E) Satisfaction of affinity purification and overlay assays data (composites); our current structure satisfies all 82 composites determined by affinity purification and overlay assays,, even though they were not used in its determination. For example, Pom152, Pom34, Ndc1, Nup157, and Nup170 are connected with each other (left panel), consistent with the composites determined by the affinity purification data, published in 2007 (right panel). (F) Satisfaction of SAXS data; the atomic structures of 8 Nups are consistent with the corresponding SAXS profiles for their constructs– (Supplementary Tables 2 and 6; Methods). For example, the SAXS profile calculated from the atomic structure of Pom152718–1148 (red curve) using FoXS is well matched (χ=1.48) to the corresponding experimental SAXS profile (black dots; n=20 exposures). For visualization purposes, the Pom152718–1148 structure (represented as a ribbon) is shown along with the best fit of the ab initio shape (represented as a transparent envelope) computed from the experimental SAXS profile. (G) Satisfaction of the negative-stain EM 2D class averages for the Nic96 complex; the localization density of the Nic96 complex (composed of Nic96, Nsp1, Nup49, and Nup57) in the dominant cluster can be projected well on 2D class averages obtained for the natively isolated complex (n=5,458 particles; Methods). The experimental class averages were satisfied by the structure with cross-correlation coefficients of 0.81 and 0.83, respectively (Methods).
Extended Data Figure 8. Validation of the NPC structure (II) - consistency between the NPC structure and the Cryo-ET density map
The Cryo-ET density map is shown at a high density threshold (grey), to reveal details of the inner ring. A representative structure of the inner ring is shown docked into the density, showing the excellent fit. All Nups are coloured as in Fig. 4. The pore membrane is indicated by M. (A) Full 8-spoke inner ring (scale bar 100 Å); front (B), top (C), and back (D) views of 3 spokes with neighbors coloured brown and grey (scale bar 50 Å). (E) Different views of a single spoke (scale bar 50 Å) are shown within the density map. (F) Thick cross-sections are shown through a single spoke in the inner ring, as viewed from the central C8-symmetry axis (scale bar 50 Å); MBM’s (membrane-binding motifs; Fig. 5) are indicated.
Extended Data Figure 9. Position of the FG repeat anchor points and heat mapping of the FG repeats
(A) Three views of the complete structure of the NPC are shown with major structural features (coloured as in Fig. 4 and Supplementary Table 2) and a snapshot of modeled FG repeat regions (indicated in green). For each Nup, the localization probability density of the ensemble of structures is shown with a representative structure from the ensemble embedded within it. See also Supplementary Videos 1–3. Scale bar 200 Å. (B) Position of FG repeat anchor points within the ensemble of solutions are depicted as green surfaces; the Nups to which they belong are labeled accordingly in the center image. Three spokes side view (left), one spoke side view (center), three spokes top view (right). Scale bar 100 Å. (C) Heat mapping of the type of FG repeat region of each FG Nup (FxFG/FG type, red; GLFG type, blue), showing partitioning of the FG types to different regions of the central transporter. Identity of mapped Nups is shown in the diagram on the right. Scale bar 100 Å. (D) Heat mapping of the effect on NPC permeability of the truncation of an FG repeat in each FG Nup, relative to the WT strain (p/pWT); the severity of the permeability defect is indicated in increasing shades of blue from minor defect (light green) to severe defect (dark blue), thereby defining the most important FG repeats needed to maintain the passive permeability barrier. Identity of mapped Nups is shown in the diagram on the right. Scale bar 100 Å.
Extended Data Figure 10. Comparison of the S. cerevisiae NPC structure and human NPC core scaffold
(A) Comparison between the inner-rings in the structure of the S. cerevisiae NPC (first and third rows) and the core scaffold of the human NPC (second and fourth rows) (PDB code 5IJN). Yeast Nups are coloured as in Fig. 4; human Nup homologs are coloured as their yeast counterparts. All copies of human Nup155 are coloured as yeast Nup157, and all copies of human Nup205/Nup188 are coloured as yeast Nup192. Only homolog Nups present in both yeast and human are shown. The human NPC core scaffold includes two additional copies of Nup155 that are absent in yeast (due to the different stoichiometry between organisms). Yeast Nup53 and Nup59 are not shown because their counterparts are not present in the human NPC core scaffold. (B) Major differences in the inner-ring between the S. cerevisiae and human NPCs are highlighted, in the cross-sectional view near the equator. (C) Positions of yeast Nups homologous to oncogenic human Nups (in parentheses) are shown in red, mapped onto three spokes of the NPC.
Extended Data Figure 11. Proposed evolutionary origin of the NPC from a later amalgam of membrane coating complexes
(A) Diagram depicting how the NPC may have originated from an ancestral coatomer module through a series of duplications, divergence, and secondary loss events. (Top) The origin of an ancestral proto-NPC coatomer module from an amalgamation of COPI-like and COPII-like complexes. Middle, the initial duplication leading to the origin of the inner and outer rings and their associated coiled bundles. Presumed secondary losses removed the inner ring protomer’s additional COPII-like subunit; loss of the outer ring’s adaptin-like subunit may have occurred here, or later in only certain lineages. (Bottom) Another duplication and divergence within each spoke may then have generated two parallel and laterally-offset paralogous columns; in the outer ring, a COPII-like subunit was then lost from one of the duplicates. The coiled bundles of the outer rings gave rise to the cytoplasmic export complex and nuclear basket by subsequent duplication; the export complex itself is a duplicate with a dimer of trimeric coiled bundles in its core. Outer ring duplications are not shown. Relevant nucleoporin domains are depicted as follows: β-propellers (cyan circles), α-solenoids (pink bars), and coiled-coil domains (orange sticks). On the left, a series of diagrams (grey) exemplify the path of duplications within the whole NPC. Examples of ribbon representations for each module are presented. The anchoring points of the coiled-coil cytoplasmic Nup82 complex and the nuclear basket (orange densities) into an equivalent region of the outer ring Nup84 complex (grey density) are shown. (B) Conserved structural motifs connecting spokes in the outer and inner rings. Diagram showing how the spoke-to-spoke connection is established through similar head-to-head connections of COPI-like/COPII like heterodimer in both the outer (left side) and the inner (right side) NPC rings. Top, nucleoporin domains coloured as in (A); bottom, COPI-like nups highlighted in red, COPII-like nups highlighted in blue.
Extended Data Figure 12. Functional analysis of nucleoporin mutants’ fitness using ODELAY
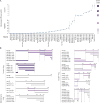
(A) The fitness defect phenotype was quantified and plotted (mean Z-score; n=6 experiments, containing at least 200–300 individuals per point; see Methods for details) for each nucleoporin truncation or C-terminal Protein-A tagged mutant in order of decreasing fitness (increasing number of units) as observed by ODELAY assay (Methods). Strains for which truncations in a haploid background were found to lead to lethality after tetrad dissection (Nic96 and Nup192) were assigned the maximum level of defect and plotted on top of the rest (diploid), based on the fitness phenotype observed for the indicated Nic96 and Nup192 mutants in a diploid background (where a wild type copy of the nucleoporin is also present and expressed). Six divisions were assigned based on decreasing level of fitness, (white = wild type, to dark purple = severe defect). AU, arbitrary unit; Error = standard deviation. (B) Mapping of the colour code described in (A) into the NPC components. Horizontal lines represent the amino acid residue length of each protein and truncated version; amino acid residue positions are shown on top of the lines.
Figure 1. Defining the mass, composition and stoichiometry of the native NPC
(A) Stoichiometry of the entire complement of NPC components determined by QConCat mass spectrometry (bar plot) and by in vivo calibrated imaging of Nup-GFP reporters (dots) (Extended Data Fig. 3). Darker and lighter colour bars (average ± SD) represent measurements from a diploid, non-tagged, S. uvarum strain (n=2–3 technical and 2 biological replicas) and haploid, tagged, S. cerevisiae strains (n=1–3 technical and 4 biological replicas), respectively. Each Nup is coloured based on their localization, as depicted in the cartoon. FG repeat-containing Nups are labeled in green. (B) Affinity captured whole NPCs were analyzed intact by charge detection MS, and a representative MS spectrum is shown. 2 biological replicas, >3 runs and >1500 individual NPCs per run. (C) Dissection of the mass and composition of an NPC.
Figure 2. Chemical cross-linking and mass spectrometry reveals nucleoporin connectivity in the NPC
Circular plot showing the distribution of chemical cross-links (Supplementary Table 1), mapped to each nucleoporin represented as a coloured segment, with the amino acid residues indicated. The identity of each module and Nup is shown in the periphery of the plot. Types of cross-links are indicated in the top left diagram. Top right, diagram illustrating the relative positions of modules in the NPC.
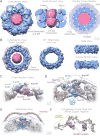
Figure 3. Morphology of the NPC
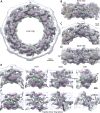
(A–B) Cryo-ET map of the NPC: core scaffold, blue; membrane region, grey; central transporter, pink. MR: membrane ring. (A) (Left) top, cytoplasmic view; (middle) cross-section side view; (right) central cross section top view. (B) Cryo-ET map presented at a higher threshold. (Left) top view; (middle) inner ring 60° tilted view; (right) inner ring side (top) and cross-section (bottom) views. Scale bar 200 Å. (C–F) Cross-section views show a representative structure embedded within the Cryo-ET density (grey) presented with different filtering and thresholding, to show the good fit to the Cryo-ET map in the inner (C, D) and membrane ring (E) and the cytoplasmic outer ring and mRNA export platform (F). Nups indicated as in Fig. 4. Scale bar 50 Å (C, D); 100 Å (E, F).
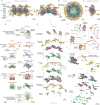
Figure 4. Structural dissection of the NPC
The complete structure of the NPC and its components. For each Nup, the localization probability density of the ensemble of structures is shown with a representative structure from the ensemble embedded within it (Supplementary Table 2). The structure is shown in different orientations, with a model of the pore membrane region shown in grey (Supplementary Videos 1–3). (A) Two views of three consecutive NPC spokes (C8-symmetry units), showing how the coaxial outer, inner, and membrane rings run continuously between spokes. (B) Top cytoplasmic view of the complete NPC structure with modeled FG repeat regions (green). Scale bar 200 Å. (C) Front view of a single NPC spoke. Scale bar 100 Å. (D) Relative position of major NPC components and connections both within and between spokes. Top (left column) and side (right column) views are shown. The membrane ring (beige) is included for reference. Flexible connectors between outer and inner rings are shown on the top and bottom panels, with the inner and membrane rings shown as faded grey densities. (E) Exploded view of three consecutive spokes, spanning from the cytoplasmic face (top) to the nuclear face (bottom), with blue dashed lines connecting neighboring rings. (F) The cytoplasmic mRNA export complex (top), the Nup84 complex (center) and the inner ring complex, including the Nic96 complex (bottom), from a single spoke. The complexes are shown as an exploded diagram, with blue dashed lines connecting neighboring components.
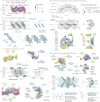
Figure 5. Key NPC architectural features and principles
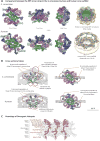
(A) Severity of fitness defects, indicated in increasing shades of purple for specific truncations of nucleoporins (Extended Data Fig. 12), mapped onto three spokes of the NPC. (B–C) Structures corresponding to the position of the most severe defects (dark blue). (B) Diagonally oriented columns reinforcing the core scaffold may accommodate NPC compression and expansion (diagram to right). Molecular details of Nup arrangement are shown at bottom (relevant residue numbers indicated). (C) The position of hotspots also coincides with spoke-to-spoke connections (central spoke in grey, flanking spokes white; diagram to right). Top and bottom, molecular details of spoke-to-spoke connector hinges. (D) Top and center left, three spokes shown as top and front views; center right, one spoke, side view. A diagram indicates convex and concave pore membrane curvatures. Positions of transmembrane domains (TMDs) and membrane-binding motifs (MBMs) are depicted and their proteins labeled in brown and orange, respectively. Top right, diagrammatic side view showing how the MBMs and TMDs curve the pore membrane. Bottom, molecular details of the Nups containing the TMDs and MBMs. (E) Second row left, three spokes in front view, showing how vertical connector Nups (cyan) spanning from the cytoplasmic to nuclear sides of the NPC connect the rings. Second row right, one spoke in side view, showing how horizontal connector Nups (aquamarine) connect modules spanning from the pore membrane to the central channel. First row and third row left show the molecular details of the connectors within the NPC. Bottom row center-right, diagrammatic views of the connectors depicted as blue dotted lines and the modules they connect labeled in blue; major Nups being contacted by connectors listed in grey.
Figure 6. The distribution of the FG repeats informs the NPC transport gating mechanism
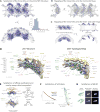
(A) (Top) Central transporter density from the Cryo-ET map (Fig. 3) is shown within the structure of the NPC scaffold (grey). Features of the central transporter are indicated. (Bottom) Anchors (light green) in FG Nups largely direct the FG repeat emanating points (dark green) towards the central channel. Scale bar 100 Å. (B) Central cross-section of the Cryo-ET map (grey) with embedded representative NPC structure (Fig. 4), showing the central transporter and the bridges connecting it to the core scaffold in top view (scale bar 100 Å), with a magnified view of one spoke on the left (scale bar 20 Å). The anchor points for the FG repeats of Nup49, Nup57, and Nsp1 are depicted as green densities. (C) Position of FG repeat anchor points (green) within a side view of three spokes of the scaffold (grey). Scale bar 100 Å. (D) Heat mapping of repeats of FxFG/FG type (red) and GLFG type (blue), from Brownian dynamics simulations (Methods), showing partitioning to different regions of the central channel. Scale bar 100 Å. (E) Heat mapping of the effect of FG repeat region truncations on NPC permeability; the severity of the permeability defect (p/pWT) is indicated in increasing shades from minor (light green) to severe (dark blue). Scale bar 100 Å.
Comment in
- Nuclear Pore Complexes: Global Conservation and Local Variation.
Holzer G, Antonin W. Holzer G, et al. Curr Biol. 2018 Jun 4;28(11):R674-R677. doi: 10.1016/j.cub.2018.04.032. Curr Biol. 2018. PMID: 29870710 - Yeast and Human Nuclear Pore Complexes: Not So Similar After All.
Shav-Tal Y, Tripathi T. Shav-Tal Y, et al. Trends Cell Biol. 2018 Aug;28(8):589-591. doi: 10.1016/j.tcb.2018.06.004. Epub 2018 Jun 22. Trends Cell Biol. 2018. PMID: 29941187
Similar articles
- The molecular architecture of the nuclear pore complex.
Alber F, Dokudovskaya S, Veenhoff LM, Zhang W, Kipper J, Devos D, Suprapto A, Karni-Schmidt O, Williams R, Chait BT, Sali A, Rout MP. Alber F, et al. Nature. 2007 Nov 29;450(7170):695-701. doi: 10.1038/nature06405. Nature. 2007. PMID: 18046406 - FG-rich repeats of nuclear pore proteins form a three-dimensional meshwork with hydrogel-like properties.
Frey S, Richter RP, Görlich D. Frey S, et al. Science. 2006 Nov 3;314(5800):815-7. doi: 10.1126/science.1132516. Science. 2006. PMID: 17082456 - Linker Nups connect the nuclear pore complex inner ring with the outer ring and transport channel.
Fischer J, Teimer R, Amlacher S, Kunze R, Hurt E. Fischer J, et al. Nat Struct Mol Biol. 2015 Oct;22(10):774-81. doi: 10.1038/nsmb.3084. Epub 2015 Sep 7. Nat Struct Mol Biol. 2015. PMID: 26344569 - Functional architecture of the nuclear pore complex.
Grossman E, Medalia O, Zwerger M. Grossman E, et al. Annu Rev Biophys. 2012;41:557-84. doi: 10.1146/annurev-biophys-050511-102328. Annu Rev Biophys. 2012. PMID: 22577827 Review. - Lighting up the nuclear pore complex.
Kahms M, Hüve J, Wesselmann R, Farr JC, Baumgärtel V, Peters R. Kahms M, et al. Eur J Cell Biol. 2011 Sep;90(9):751-8. doi: 10.1016/j.ejcb.2011.04.004. Epub 2011 May 31. Eur J Cell Biol. 2011. PMID: 21632146 Review.
Cited by
- From integrative structural biology to cell biology.
Sali A. Sali A. J Biol Chem. 2021 Jan-Jun;296:100743. doi: 10.1016/j.jbc.2021.100743. Epub 2021 May 4. J Biol Chem. 2021. PMID: 33957123 Free PMC article. Review. - Evolutionary trajectory for nuclear functions of ciliary transport complex proteins.
Ewerling A, May-Simera HL. Ewerling A, et al. Microbiol Mol Biol Rev. 2024 Sep 26;88(3):e0000624. doi: 10.1128/mmbr.00006-24. Epub 2024 Jul 12. Microbiol Mol Biol Rev. 2024. PMID: 38995044 Review. - Integrative spatiotemporal modeling of biomolecular processes: application to the assembly of the Nuclear Pore Complex.
Latham AP, Tempkin JOB, Otsuka S, Zhang W, Ellenberg J, Sali A. Latham AP, et al. bioRxiv [Preprint]. 2024 Aug 8:2024.08.06.606842. doi: 10.1101/2024.08.06.606842. bioRxiv. 2024. PMID: 39149317 Free PMC article. Preprint. - Bacterial DNA involvement in carcinogenesis.
Yangyanqiu W, Shuwen H. Yangyanqiu W, et al. Front Cell Infect Microbiol. 2022 Oct 12;12:996778. doi: 10.3389/fcimb.2022.996778. eCollection 2022. Front Cell Infect Microbiol. 2022. PMID: 36310856 Free PMC article. Review. - Cross-linking mass spectrometry for mapping protein complex topologies in situ.
Lee K, O'Reilly FJ. Lee K, et al. Essays Biochem. 2023 Mar 29;67(2):215-228. doi: 10.1042/EBC20220168. Essays Biochem. 2023. PMID: 36734207 Free PMC article.
References
- Alber F, et al. The molecular architecture of the nuclear pore complex. Nature. 2007;450:695–701. - PubMed
Publication types
MeSH terms
Substances
Grants and funding
- U54 GM103511/GM/NIGMS NIH HHS/United States
- R01 GM112108/GM/NIGMS NIH HHS/United States
- R01 GM080139/GM/NIGMS NIH HHS/United States
- R01 GM063834/GM/NIGMS NIH HHS/United States
- P41 GM109824/GM/NIGMS NIH HHS/United States
- U54 DK107981/DK/NIDDK NIH HHS/United States
- R01 GM045377/GM/NIGMS NIH HHS/United States
- S10 OD021596/OD/NIH HHS/United States
- T32 GM008284/GM/NIGMS NIH HHS/United States
- P50 GM076547/GM/NIGMS NIH HHS/United States
- R01 GM083960/GM/NIGMS NIH HHS/United States
- P41 GM103314/GM/NIGMS NIH HHS/United States
- R01 GM080477/GM/NIGMS NIH HHS/United States
LinkOut - more resources
Full Text Sources
Other Literature Sources
Molecular Biology Databases
Miscellaneous
