Zc3h13 Regulates Nuclear RNA m6A Methylation and Mouse Embryonic Stem Cell Self-Renewal - PubMed (original) (raw)
. 2018 Mar 15;69(6):1028-1038.e6.
doi: 10.1016/j.molcel.2018.02.015.
Ruitu Lv 1, Honghui Ma 1, Hongjie Shen 1, Chenxi He 1, Jiahua Wang 1, Fangfang Jiao 1, Hang Liu 1, Pengyuan Yang 2, Li Tan 1, Fei Lan 3, Yujiang Geno Shi 4, Chuan He 5, Yang Shi 6, Jianbo Diao 7
Affiliations
- PMID: 29547716
- PMCID: PMC5858226
- DOI: 10.1016/j.molcel.2018.02.015
Zc3h13 Regulates Nuclear RNA m6A Methylation and Mouse Embryonic Stem Cell Self-Renewal
Jing Wen et al. Mol Cell. 2018.
Abstract
N6-methyladenosine (m6A) is an abundant modification in eukaryotic mRNA, regulating mRNA dynamics by influencing mRNA stability, splicing, export, and translation. However, the precise m6A regulating machinery still remains incompletely understood. Here we demonstrate that ZC3H13, a zinc-finger protein, plays an important role in modulating RNA m6A methylation in the nucleus. We show that knockdown of Zc3h13 in mouse embryonic stem cell significantly decreases global m6A level on mRNA. Upon Zc3h13 knockdown, a great majority of WTAP, Virilizer, and Hakai translocate to the cytoplasm, suggesting that Zc3h13 is required for nuclear localization of the Zc3h13-WTAP-Virilizer-Hakai complex, which is important for RNA m6A methylation. Finally, Zc3h13 depletion, as does WTAP, Virilizer, or Hakai, impairs self-renewal and triggers mESC differentiation. Taken together, our findings demonstrate that Zc3h13 plays a critical role in anchoring WTAP, Virilizer, and Hakai in the nucleus to facilitate m6A methylation and to regulate mESC self-renewal.
Keywords: Zc3h13; m(6)A; mESC self-renewal; nuclear localization.
Copyright © 2018 Elsevier Inc. All rights reserved.
Conflict of interest statement
Declaration of Interests
Y. S. is a co-founder of Constellation Pharmaceuticals, Inc. and a member of its scientific advisory board. F. L. is a share holder of Constellation Pharmaceuticals, Inc. C. H. is a co-founder of Accent Therapeutics, Inc. and a member of its scientific advisory board.
Figures
Figure 1. Zc3h13 interacts with WTAP, Virilizer and Hakai
(A) Co-immunoprecipitation analysis showing Zc3h13 interacts with WTAP, Virilizer and Hakai in mESC. Mock, mES cells transfected with empty vector; IP, immunoprecipitation; IB, immunoblotting. (B) Reciprocal-IP assay indicating Zc3h13 was immunoprecipitated by anti-WTAP, anti-Virilizer and anti-Hakai antibodies. IgG was used as a control. (C) Schematic representation of Zc3h13 full-length (FL) protein and various truncated fragments. Amino acid positions are indicated. (D) Interactions between Zc3h13 fragments (Zc3h131-1460 and Zc3h131461-1729) and Virilizer, Hakai, WTAP were determined by co-immunoprecipitation. FH-Zc3h13, Flag-HA-Zc3h13; Mock, mES cells transfected with empty vector. See also Figure S1.
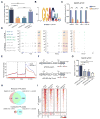
Figure 2. Zc3h13 regulates mRNA m6A in mESCs
(A) LC-MS/MS quantification of the m6A/A ratio in polyadenylated RNA isolated from the indicated mES cell lines. shCtrl, control. (B) Sequence motif identified from top 1000 m6A peaks. (C) MeRIP-qPCR analysis of m6A level in the select mRNAs in control and Zc3h13 kd mESCs. shCtrl, control. (D) UCSC snapshots of MeRIP-seq reads along indicated mRNAs. Normalized reads density levels are shown as blue (control), green (shZc3h13) and gray (input) shades respectively. Ranges of reads are shown to the left of each track. Two replicates are shown. Transcription directions are indicated by arrows. (E) The normalized distribution of m6A peaks across the 5′ UTR, CDS, and 3′ UTR of mRNA in control and Zc3h13 kd mESCs. shCtrl, control. (F) The reporter constructs of pPB-BG-Atg13 and pPB-BG-Atg13-mut. (G) MeRIP-qPCR analysis of m6A modification in indicated RNAs of pPB-BG-Atg13 and pPB-BG-Atg13-mut reporters in Zc3h13 kd mESCs and control cells. (H) Venn diagram showing overlap between Zc3h13-dependent and Mettl3-dependent m6A peaks. MeRIP-seq data of Mettl3 KO and WT mES cells were obtained from GEO database (GSE52662). (I) Heatmap analysis of MeRIP-seq reads density in m6A modified regions with statistically significant difference in Zc3h13 kd mES cells versus control cells, and Mettl3 KO mES cells versus control cells. m6A modified regions were sorted according to m6A reads density level. MeRIP-seq data of Mettl3 KO and WT mES cells were obtained from GEO database (GSE52662). All data are represented as mean ± SD from three biological replicates (A, C and G). *p < 0.05; **p < 0.01; ***p < 0.001; t test. See also Figure S2.
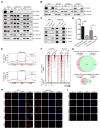
Figure 3. Zc3h13 controls nuclear localization of WTAP, Virilizer and Hakai
(A) Western blot analysis of Zc3h13, Virilizer, WTAP, Hakai, Mettl3 and Mettl14 in the whole cell lysate (WCL), cytoplasmic (C) and nuclear (N) fractions from Zc3h13 and control knockdown mESCs. Lamin B1 and α-Tubulin were used as nuclear and cytoplasmic markers, respectively. (B) Western blot analysis of cytoplasmic and nuclear fractions of Zc3h13 in WTAP-depleted, Virilizer-depleted, Hakai-depleted and control mESCs. (C) Interactions between WTAP and Virilizer, Hakai, Mettl3, Mettl14 were determined by co-immunoprecipitation using cytoplasmic fractions from control and Zc3h13 kd mESCs. IgG was used as a control. shCtrl, control. (D) LC-MS/MS quantification of the m6A/A ratio in polyadenylated RNA isolated from cytoplasmic and nuclear fractions of Zc3h13 kd and control mESCs. Data are represented as mean ± SD from three biological replicates. *p < 0.05; **p < 0.01; t test. (E) The normalized distribution of m6A peaks across the 5′ UTR, CDS, and 3′ UTR of mRNA in cytoplasmic and nuclear fractions of control and Zc3h13 kd mESCs. shCtrl, control. (F) Heatmap analysis of MeRIP-seq reads density in m6A modified regions with statistically significant difference in cytoplasmic or nuclear fractions of Zc3h13 kd and control mESCs. m6A modified regions were sorted according to m6A reads density level. (G) Venn diagram showing overlap between cytoplasmic and nuclear Zc3h13- dependent m6A peaks. (H) Immunofluorescence analysis of Zc3h13 (red), WTAP (red), Virilizer (red), Hakai (red), Mettl3 (red), SC35 (green), and DAPI (blue, cell nuclei) in Zc3h13 knockdown and control mESCs. Scale bar, 10 μm. (I) Immunofluorescence analysis of mES cells overexpressing Flag-HA-Zc3h13-full length (FL), Flag-HA-Zc3h131-1460, or Flag-HA-Zc3h131461-1729, detected with the HA antibody (red), SC35 antibody (green) and DAPI (blue, cell nuclei). Scale bar, 10 μm. Mock, mES cells transfected with empty vector. See also Figure S3.
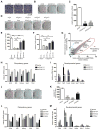
Figure 4. Loss of Zc3h13 impairs mESC self-renewal
(A) Phase-contrast microscopy analysis of colony morphologies of the indicated cell lines. (B and C) Alkaline phosphatase staining (B) and quantification of AP-positive colonies (C) of control and Zc3h13 knockdown mESCs. shCtrl, control. (D and E) Alkaline phosphatase staining (D) and quantification of AP-positive colonies (E) of control, Zc3h13 kd and indicated rescuing mES cell lines. (F) Relative m6A/A level in polyadenylated RNAs isolated from the indicated mES cell lines. Each sample was compared with control cells transfected with empty vector. (G) Scatter plot of up-regulated and down-regulated genes in Zc3h13-depleted mESCs compared with control cells. Pluripotency genes are highlighted by red dots and circle; developmental genes are highlighted by blue dots and circle. shCtrl, control. (H and I) RT-qPCR analysis of pluripotency genes (H) and differentiation genes (I) in Zc3h13 kd versus control cells. Data are represented as mean ± SD from four biological replicates. *p < 0.05; **p < 0.01; ***p < 0.001; t test. (J and K) Alkaline phosphatase staining (J) and quantification of AP-positive colonies (K) of control and the indicated knockdown mES cells. shCtrl, control. (L and M) RT-qPCR analysis of pluripotency genes (L) and differentiation genes (M) in the indicated knockdown cells versus control cells. Data are represented as mean ± SD from three biological replicates (C, E, F, K, L and M). *p < 0.05; **p < 0.01; ***p < 0.001; ns, no significance; t test. See also Figures S4 and Table S1.
Similar articles
- Zc3h13/Flacc is required for adenosine methylation by bridging the mRNA-binding factor Rbm15/Spenito to the m6A machinery component Wtap/Fl(2)d.
Knuckles P, Lence T, Haussmann IU, Jacob D, Kreim N, Carl SH, Masiello I, Hares T, Villaseñor R, Hess D, Andrade-Navarro MA, Biggiogera M, Helm M, Soller M, Bühler M, Roignant JY. Knuckles P, et al. Genes Dev. 2018 Mar 1;32(5-6):415-429. doi: 10.1101/gad.309146.117. Epub 2018 Mar 13. Genes Dev. 2018. PMID: 29535189 Free PMC article. - Hakai is required for stabilization of core components of the m6A mRNA methylation machinery.
Bawankar P, Lence T, Paolantoni C, Haussmann IU, Kazlauskiene M, Jacob D, Heidelberger JB, Richter FM, Nallasivan MP, Morin V, Kreim N, Beli P, Helm M, Jinek M, Soller M, Roignant JY. Bawankar P, et al. Nat Commun. 2021 Jun 18;12(1):3778. doi: 10.1038/s41467-021-23892-5. Nat Commun. 2021. PMID: 34145251 Free PMC article. - The RNA Methyltransferase Complex of WTAP, METTL3, and METTL14 Regulates Mitotic Clonal Expansion in Adipogenesis.
Kobayashi M, Ohsugi M, Sasako T, Awazawa M, Umehara T, Iwane A, Kobayashi N, Okazaki Y, Kubota N, Suzuki R, Waki H, Horiuchi K, Hamakubo T, Kodama T, Aoe S, Tobe K, Kadowaki T, Ueki K. Kobayashi M, et al. Mol Cell Biol. 2018 Jul 30;38(16):e00116-18. doi: 10.1128/MCB.00116-18. Print 2018 Aug 15. Mol Cell Biol. 2018. PMID: 29866655 Free PMC article. - A birds'-eye view of the activity and specificity of the mRNA m6 A methyltransferase complex.
Garcias Morales D, Reyes JL. Garcias Morales D, et al. Wiley Interdiscip Rev RNA. 2021 Jan;12(1):e1618. doi: 10.1002/wrna.1618. Epub 2020 Jul 19. Wiley Interdiscip Rev RNA. 2021. PMID: 32686365 Review. - Role of WTAP in Cancer: From Mechanisms to the Therapeutic Potential.
Fan Y, Li X, Sun H, Gao Z, Zhu Z, Yuan K. Fan Y, et al. Biomolecules. 2022 Sep 2;12(9):1224. doi: 10.3390/biom12091224. Biomolecules. 2022. PMID: 36139062 Free PMC article. Review.
Cited by
- The emerging roles of N6-methyladenosine RNA methylation in human cancers.
Shen H, Lan Y, Zhao Y, Shi Y, Jin J, Xie W. Shen H, et al. Biomark Res. 2020 Jun 29;8:24. doi: 10.1186/s40364-020-00203-6. eCollection 2020. Biomark Res. 2020. PMID: 32612834 Free PMC article. Review. - Functions and mechanisms of RNA m6A regulators in breast cancer (Review).
Yang Y, Gao F, Ren L, Ren N, Pan J, Xu Q. Yang Y, et al. Int J Oncol. 2024 Sep;65(3):86. doi: 10.3892/ijo.2024.5674. Epub 2024 Jul 26. Int J Oncol. 2024. PMID: 39054967 Free PMC article. Review. - FBW7 suppresses ovarian cancer development by targeting the N6-methyladenosine binding protein YTHDF2.
Xu F, Li J, Ni M, Cheng J, Zhao H, Wang S, Zhou X, Wu X. Xu F, et al. Mol Cancer. 2021 Mar 3;20(1):45. doi: 10.1186/s12943-021-01340-8. Mol Cancer. 2021. PMID: 33658012 Free PMC article. - Epigenetic targeting of autophagy for cancer: DNA and RNA methylation.
Lin L, Zhao Y, Zheng Q, Zhang J, Li H, Wu W. Lin L, et al. Front Oncol. 2023 Dec 8;13:1290330. doi: 10.3389/fonc.2023.1290330. eCollection 2023. Front Oncol. 2023. PMID: 38148841 Free PMC article. Review. - Emerging Perspectives of RNA _N_6-methyladenosine (m6A) Modification on Immunity and Autoimmune Diseases.
Tang L, Wei X, Li T, Chen Y, Dai Z, Lu C, Zheng G. Tang L, et al. Front Immunol. 2021 Mar 5;12:630358. doi: 10.3389/fimmu.2021.630358. eCollection 2021. Front Immunol. 2021. PMID: 33746967 Free PMC article. Review.
References
- Biamonti G, Caceres JF. Cellular stress and RNA splicing. Trends Biochem Sci. 2009;34:146–153. - PubMed
Publication types
MeSH terms
Substances
LinkOut - more resources
Full Text Sources
Other Literature Sources
Molecular Biology Databases
Miscellaneous


