Hepatocyte-secreted DPP4 in obesity promotes adipose inflammation and insulin resistance - PubMed (original) (raw)
. 2018 Mar 29;555(7698):673-677.
doi: 10.1038/nature26138. Epub 2018 Mar 21.
Affiliations
- PMID: 29562231
- PMCID: PMC6021131
- DOI: 10.1038/nature26138
Hepatocyte-secreted DPP4 in obesity promotes adipose inflammation and insulin resistance
Devram S Ghorpade et al. Nature. 2018.
Abstract
Obesity-induced metabolic disease involves functional integration among several organs via circulating factors, but little is known about crosstalk between liver and visceral adipose tissue (VAT). In obesity, VAT becomes populated with inflammatory adipose tissue macrophages (ATMs). In obese humans, there is a close correlation between adipose tissue inflammation and insulin resistance, and in obese mice, blocking systemic or ATM inflammation improves insulin sensitivity. However, processes that promote pathological adipose tissue inflammation in obesity are incompletely understood. Here we show that obesity in mice stimulates hepatocytes to synthesize and secrete dipeptidyl peptidase 4 (DPP4), which acts with plasma factor Xa to inflame ATMs. Silencing expression of DPP4 in hepatocytes suppresses inflammation of VAT and insulin resistance; however, a similar effect is not seen with the orally administered DPP4 inhibitor sitagliptin. Inflammation and insulin resistance are also suppressed by silencing expression of caveolin-1 or PAR2 in ATMs; these proteins mediate the actions of DPP4 and factor Xa, respectively. Thus, hepatocyte DPP4 promotes VAT inflammation and insulin resistance in obesity, and targeting this pathway may have metabolic benefits that are distinct from those observed with oral DPP4 inhibitors.
Conflict of interest statement
The authors declare no competing interests.
Figures
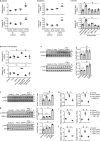
Extended Data Figure 1. Hepatocyte-specific deletion of CaMKII or ATF4 in DIO mice lowers VAT inflammation
a–c, Sixteen-week-old Camk2gfl/fl mice that had been previously fed the DIO diet for 13 weeks were injected intravenously with AAV8-TBG-cre (H-CaMKII(KO)) or AAV8-TBG-lacZ (wild-type, WT). Mice were analysed after three additional weeks on the DIO diet. a, Representative images of VAT immunostained for F4/80, with quantification of crown-like-structure (CLS) macrophages, and expression of Adgre1 mRNA, which encodes F4/80. b, As in a, except that the mice were injected with fluorescent beads using a procedure that labels circulating Ly6chi monocytes, and then bead-labelled cells were assayed in VAT sections. c, mRNAs for Il6, Mcp1, Tnf and Il1b in VAT. d, Blood monocyte count. e, Plasma IL6 and TNFα measured by ELISA, and quantification of Adgre1, Mcp1 and Tnfa mRNA in liver. In a–e, n = 4 mice per group; mean ± s.e.m.; *P < 0.05; n.s., not significant by two-tailed Student’s _t_-test. f, g, Mice similar to those in a–c, and from a third group in which Camk2gfl/fl mice were injected intravenously with adeno-Atf4 and AAV8-TBG-cre (H-CaMKII(KO) + adeno-Atf4). f, CLS macrophages and Adgre1 mRNA in VAT were quantified, with representative images of F4/80-stained VAT. g, Il6, Mcp1, Tnfa and Il1b mRNA in VAT and Adgre1, Mcp1 and Tnfa mRNA in liver were quantified. Note that the first two groups of mice received adeno-lacZ instead of adeno-Atf4. n = 4 mice per group; mean ± s.e.m.; *P < 0.05 by one-way ANOVA; n.s., not significant. h, AAV8-TBG-cre (H-ATF4(KO)) or AAV8-TBG-lacZ (wild-type) was injected intravenously into 16-week-old Aft4fl/fl mice previously fed the DIO diet for 13 weeks. After three further weeks on the DIO diet, VAT from these mice was immunostained for F4/80 to identify macrophages, the percentage of macrophages in CLS was quantified, and the VAT was assayed for Adgre1 and the indicated inflammatory mRNAs. Twelve wild-type and 11 H-ATF4(KO) mice was analysed for CLS macrophages, and a randomly selected subset of five wild-type and five H-ATF4(KO) mice was analysed for the VAT mRNAs. Mean ± s.e.m., *P < 0.05 by two-tailed Student’s _t_-test.
Extended Data Figure 2. DPP4 in the plasma of DIO mice induces Mcp1 and Il6 in SVF cells from the VAT of obese mice and in macrophages
a, Representative images of haemotoxylin and eosin-stained VAT sections from lean and DIO mice and Adgre1 mRNA levels in SVF from lean and DIO mice. n = 4 mice per group; mean ± s.e.m.; *P < 0.05. b, SVF cells from the VAT of lean mice were incubated for 4 h in medium containing 10% (v/v) plasma from lean or DIO mice and then assayed for Mcp1 and Il6 mRNA. n = 4 mice per group; mean ± s.e.m.; *P < 0.05; n.s., not significant. c, Mcp1 mRNA was assayed in mouse peritoneal macrophages (Mφs) or bone marrow-derived macrophages that were incubated for 4 h with medium containing 10% (v/v) plasma from lean or DIO mice. n = 5 technical replicates per group; mean ± s.e.m.; *P < 0.05. d, Mcp1 mRNA levels in SVF cells that were incubated for 4 h with medium containing 10% (v/v) control or heat-inactivated (heat) plasma from the indicated groups of mice. n = 6 mice per group; mean ± s.e.m.; *P < 0.05. e, UV protein chromatogram obtained after fractionation of DIO mice plasma using gel-filtration FPLC; vertical grey bar depicts peak of activity shown in f. f, Obese mouse SVF cells were incubated with medium containing 10% lean or DIO mouse plasma or the indicated FPLC fractions from e and assayed for Mcp1 mRNA. n.d., Mcp1 mRNA not detected. Arrows indicate the fractions that were selected for LC–MS/MS analysis. g, LC–MS/MS normalized spectral counts corresponding to DPP4 in the FPLC fractions from f. h, DPP4 activity in the plasma of lean and DIO mice. n = 5 mice per group; mean ± s.e.m.; *P < 0.05. i, SVF cells from DIO mice were incubated for 4 h with medium containing 10% (v/v) lean or DIO mouse plasma that was pre-treated for 1 h with or without 10 µM DPP4 inhibitor KR62436. The cells were then assayed for Il6 mRNA. n = 3 technical replicates per group; mean ± s.e.m.; *P < 0.05. j, VAT from the mice in Extended Data Fig. 1f, g was assayed for Dpp4 mRNA (n = 4). Data in a–c and h were analysed by two-tailed Student’s _t_-test; data in i and j were analysed by one-way ANOVA (g, h); data in d were analysed by two-way ANOVA.
Extended Data Figure 3. Restoration of DPP4 in livers of H-CaMKII(KO) mice abrogates suppression of VAT inflammation in DIO mice; ATF4 ChIP of the Dpp4 gene; and AAV8-H1-shDpp4 treatment lowers hepatic DPP4
Wild-type and H-CaMKII(KO) mice and a third group in which Camk2gfl/fl mice were injected intravenously with adeno-Dpp4 together with the AAV8-TBG-cre (H-CaMKII(KO) + adeno-Dpp4) were analysed as follows. a, Body weight, plasma DPP4 activity and liver and VAT DPP4 protein. b, Representative images of VAT immunostained with F4/80 antibody, with quantification of CLS macrophages and Tnfa and Mcp1 mRNA in VAT. Note that the first two groups of mice received adeno-lacZ instead of adeno-DPP4. In a and b, n = 3–4 mice per group; mean ± s.e.m.; *P < 0.05 by one-way ANOVA; n.s., non-significant. For gel source data, see Supplementary Fig. 1. c, Top, ChIP was performed with liver extracts from the indicated groups of mice using anti-ATF4 or control IgG antibodies. The region spanning the predicted ATF4-binding sequence in exon 1 of Dpp4 was amplified by RT–qPCR and normalized to the values obtained from the input. n = 3 ChIP assays for wild-type, H-CaMKII(KO), H-CaMKII(KO) + adeno-Atf4; n = 1 for H-ATF4(KO); n = 10 for control IgG; mean ± s.e.m.; #,*P < 0.05 by one-way ANOVA for groups 1–3. Bottom, per cent input for ATF4 ChIP using liver extracts from the indicated DIO mice and PCR primers for a region in the Dpp4 gene that does not contain a consensus sequence for ATF4 binding. n = 3 ChIP assays for wild type, H-CaMKII(KO), H-CaMKII(KO) + adeno-Atf4; n = 1 for H-ATF4(KO); n = 10 for control IgG; mean ± s.e.m.; n.s., non-significant by one-way ANOVA. d, e, Sixteen-week-old mice previously fed with the DIO diet for 10 weeks were injected intravenously with hepatocyte-specific AAV8-H1-shDpp4 (H-shDpp4) or control AAV8-H1 vector (con). After four additional weeks on DIO diet, the mice were analysed as follows. d, DPP4 immunoblot, with densitometric quantification of DPP4 protein in the indicated tissues; representative of three independent experiments. e, Dpp4 mRNA in liver and VAT. In d and e, n = 5 mice per group; mean ± s.e.m.; *P < 0.05; n.s., non-significant by two-tailed Student’s _t_-test. See Supplementary Fig. 1 for gel source data.
Extended Data Figure 4. Silencing of DPP4 in liver suppresses VAT inflammation and improves metabolism without increasing plasma incretins
a, Top, 16-week-old mice previously fed with the DIO diet for 10 weeks were injected intravenously with AAV8-H1-shDpp4 (H-shDpp4) or control AAV8-H1 vector (con). After four weeks, the mice were assayed for Il6, Mcp1, Tnfa and Il1b mRNA in VAT. Bottom, control and H-shDpp4-treated mice similar to those above were analysed nine days after adenovirus injections for Il6, Mcp1, Tnfa and Il1b mRNA in ATMs. b–g, H-shDPP4 and control mice were analysed after four weeks. b–d, Representative images of adipose tissue immunostained with F4/80 antibody, with quantification of CLS macrophages, Adgre1 and inflammatory gene mRNA expression in perirenal, inguinal and brown fat. e, Plasma MCP1, IL6 and TNFα. f, Body weight and food intake. g, Weights of liver and the indicated adipose tissue depots. In a–g, n = 5–6 mice per group; mean ± s.e.m.; *P < 0.05; n.s., non-significant by two-tailed Student’s _t_-test. h–j, Mice similar to those in b–g were assayed. h, Blood glucose and plasma insulin. i, p-AKT and total AKT in VAT and liver after insulin injection into the portal vein. n = 1 PBS-injected, n = 4 insulin-injected mice per group; blots are representative of three independent experiments. Gel source data are shown in Supplementary Fig. 1. j, Plasma active GIP (1–42) and GLP1 (7–36). In h and j, n = 6 mice per group; mean ± s.e.m.; *P < 0.05; n.s., non-significant by two-tailed
Extended Data Figure 5. Hepatocyte-specific silencing of DPP4 improves glucose metabolism in ob/ob mice without increasing plasma incretins and does not affect VAT inflammation or glucose metabolism in lean mice
a–h, Five-week-old chow-fed ob/ob mice were injected intravenously with AAV8-H1-shDpp4 (H-shDpp4) or AAV8-H1-control (con), and were assayed four weeks later. a, Body weight. b, Immunoblot of liver and VAT DPP4. c, Representative images of VAT immunostained with F4/80 antibody, with quantification of CLS macrophages and Adgre1 mRNA in VAT. d, Il6, Mcp1, Tnfa and Il1b mRNA in VAT. e, Blood glucose after challenge with intraperitoneal glucose or insulin. f, p-AKT and total AKT in VAT and liver extracts after portal vein insulin injection. g, Blood glucose and plasma insulin 5 h after food withdrawal. h, Plasma active GIP (1–42) and GLP1 (7–36). i–m, Sixteen-week-old chow-fed wild-type lean mice were injected intravenously with AAV8-H1-shDpp4 (H-shDpp4) or AAV8-H1-control (Con) and were analysed as follows. i, Body weight. j, Immunoblot of DPP4 in liver and VAT. k, p-AKT and total AKT in VAT and liver extracts after portal vein insulin injection. l, Blood glucose and plasma insulin 5 h after food withdrawal. m, Blood glucose after challenge with intraperitoneal glucose or insulin. In all panels, n = 5–6 mice per group; mean ± s.e.m.; n.s., non-significant by two-tailed Student's _t_-test. For gel source data, see Supplementary Fig. 1.
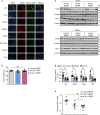
Extended Data Figure 6. Effect of DPP4 silencing on insulin-induced p-AKT in primary hepatocytes, on NEFA in obese or lean mice and on metabolism in comparison with sitagliptin in obese mice
a, Wild-type or DPP4-silenced primary hepatocytes were treated with or without 50 µM palmitate for 10 h with the last 5 h in serum-free medium, and then stimulated with 100 nM of insulin for 5 min. p-AKT and total AKT and DPP4 were assayed by immunoblot. The data are representative of two independent experiments. b, Plasma samples from the following mice were assayed for non-esterified fatty acids (NEFA) four weeks after intravenous injection with AAV8-H1-shDpp4 (H-shDpp4) or control AAV8-H1 vector (con): 16-week-old mice fed the DIO diet for the last 10 weeks, 5-weekold chow-fed ob/ob mice, and 6-week-old chow-fed wild-type lean mice. n = 5–6 mice per group; mean ± s.e.m.; *P < 0.05 and n.s., non-significant by two-tailed Student's _t_-test. c–h, After 10 weeks on high-fat diet, control DIO mice, H-shDpp4 DIO mice and DIO mice were administered sitagliptin (sita) in drinking water to achieve a dose of ~30–45 mg/kg/ day. After 4 weeks of treatment, the mice were analysed as follows. c, Body weight. d, Plasma and VAT DPP4 activity. e, Hepatic DPP4 immunoblot and hepatocyte DPP4 activity. f, Blood glucose and plasma insulin 5 h after food withdrawal. g, p-AKT and total AKT in VAT and liver after portal vein insulin injection. h, Plasma non-esterified fatty acids (NEFA). For all quantified data panels except e, n = 6–8 mice per group; for e, n = 4 mice per group; mean ± s.e.m.; *,#P < 0.05 and n.s., non-significant by one-way ANOVA. For gel source data, see Supplementary Fig. 1. i, DIO mice were treated with AAV8-H1-con, AAV8-H1-shDpp4 or sitagliptin (+ AAV8- H1-con) exactly as above, except the mice were analysed after 11 weeks of treatment instead of after 4 weeks. n = 5 mice per group; mean ± s.e.m.; *,# P < 0.05 and n.s., non-significant by one-way ANOVA.
Extended Data Figure 7. DPP4 requires a plasma factor to induce inflammation in SVF
a, Mcp1 mRNA was assayed in SVF cells that were incubated for 4 h with medium containing 10% (v/v) DIO mouse plasma; DIO mouse plasma immunodepleted of DPP4; recombinant DPP4 (rDPP4) alone; or rDPP4 plus DIO mouse plasma immunodepleted of DPP4. n = 3 technical replicates per group;. mean ± s.e.m. b, As a, except plasma from H-shDPP4 DIO mice were used instead of DPP4-depleted obese mouse plasma, and both Mcp1 and Il6 were assayed (n = 5 technical replicates per group; mean ± s.e.m.). In a and b, groups with different symbols are different from each other (P < 0.05 by one-way ANOVA). c, DPP4-depleted plasma from DIO mice was fractionated by Superdex-200 FPLC. Each fraction, as well as unfractionated DIO mouse plasma, was incubated with SVF cells with or without rDPP4, followed by assay of Mcp1 mRNA. n.d., Mcp1 mRNA not detected. The fraction numbers in red (arrows) were selected for LC–MS/MS analysis. The data are from a single experiment.
Extended Data Figure 8. DPP4 and FXa synergistically promote VAT inflammation, and inhibition of FXa improves glucose metabolism
a, LC–MS/MS normalized spectral counts corresponding to FX in the indicated FPLC fractions from Extended Fig. 7c. b, SVF cells or BMDMs were pre-incubated for 1 h with or without 10 µM FXa inhibitor rivaroxaban (riv) and then incubated with medium containing 10% (v/v) plasma from lean or DIO mice and assayed for Mcp1 mRNA. n = 3 technical replicates per group; mean ± s.e.m.; *,#P < 0.05 by twoway ANOVA. c, BMDMs were pretreated with or without 10 µM FXa inhibitor rivaroxaban (riv) or 10 µM DPP4 inhibitor KR62436, followed by incubation for 4 h with rFX or rDPP4 alone or both together. Il6 mRNA was then quantified. n = 4 technical replicates per group; mean ± s.e.m.; #,*P < 0.05 by one-way ANOVA. d, SVF cells from lean or DIO mice were treated with rFX or rDPP4 alone or in combination for 4 h, and then Mcp1 and Il6 mRNA levels were assayed (n = 4 technical replicates per group; mean ± s.e.m.; *P < 0.05 and n.s., non-significant by one-way ANOVA). e–j, The control and rivaroxaban-treated mice from Fig. 3b, c were assayed. e, Body weight. f, Adgre1, Mcp1, Il6, Tnfa and Il1b mRNA in VAT. g, h, Blood glucose and plasma insulin 5 h after food withdrawal. i, p-AKT and total AKT in VAT and liver after portal vein insulin injection. j, Plasma non-esterified fatty acids (NEFA). In e–h and j, n = 5 mice per group; mean ± s.e.m.; *P < 0.05 and n.s., non-significant by two-tailed Student’s _t_-test. In i, the mean fold increases of the plus-insulin values relative to the minus-insulin value, based on the densitometric ratio of p-AKT:total AKT, are shown below the blots (n = 1 PBS-injected and n = 4-insulin injected mice per group; mean ± s.e.m.; *P < 0.05). For gel source data, see Supplementary Fig. 1.
Extended Data Figure 9. DPP4 and FXa synergistically induce inflammatory signalling pathways in macrophages
a, BMDMs were pretreated for 4 h with or without 0.25 U rFXa, medium was then removed, cells were washed and treated with 10 µM rivaroxaban (riv) to inhibit residual FXa activity. The cells were then incubated for 4 h with or without 70 ng rDPP4 and assayed for Mcp1 and Il6 mRNA. b, BMDMs were pre-treated for 4 h with or without 70 ng rDPP4, medium was then removed, cells were washed and treated with 10 µM KR62436 to inhibit residual DPP4 activity. The cells were then incubated for 4 h with or without 0.25 U rFXa and assayed for Mcp1 and Il6 mRNA. In a and b, n = 3 technical replicates per group; mean ± s.e.m.; *P < 0.05 versus all other groups by one-way ANOVA. c, ATMs were pre-treated for 1 h with or without 10 µM of the PAR2 inhibitor GB83, 25 µM of the CAV1 inhibitor daidzein, 10 µM of the MEK inhibitor PD98059 or 10 µM of the IKK inhibitor PS-1145. The cells were then incubated for 4 h with or without rFXa and rDPP4 and assayed for Mcp1 and Il6 mRNA. n = 4 technical replicates per group; mean ± s.e.m.; *,#P < 0.05 by one-way ANOVA. d, Human monocyte-derived macrophages were pre-treated for 1 h with or without 10 µM PAR2 inhibitor (GB83) or 25 µM CAV1 inhibitor (daidzein) and then incubated for 4 h with or without rFXa, rDPP4 or both and assayed for MCP1 and IL6 mRNA. n = 3 technical replicates; mean ± s.e.m.; #,*P < 0.05 versus all other groups by one-way ANOVA. e–g, Bone marrow-derived macrophages were incubated for 10 min with or without 0.25 U rFXa, 70 ng rDPP4 or rFXa plus rDPP4 and then assayed by immunoblot for phosphorylated and total IRAK1, TAK1, RAF1, ERK1/2 and P65, followed by densitometric quantification. The data are representative of two (e, f) or three (g) independent experiments. For all panels, n = 3 technical replicates per group; mean ± s.e.m.; *P < 0.05 versus other groups and n.s., not significant by one-way ANOVA. h–j, Bone marrow-derived macrophages were pretreated for 1 h with or without the following inhibitors. h, IRAK-1/4 inhibitor-I, 0.5 µM. i, TAK1 MAPKKK inhibitor Z-7-oxozeaenol, 0.1 µM. j, RAF1 inhibitor GW5074, 1 µM. Cells were then incubated for 4 h with or without rFXa plus rDPP4 and assayed for Mcp1 and Il6 mRNA. n = 4 technical replicates per group; mean ± s.e.m.; *P < 0.05 by one-way ANOVA.
Extended Data Figure 10. Supporting data for GERP experiments
a, Five-week-old chow-fed ob/ob mice were treated daily by intraperitoneal injection of FITC-labelled glucan shells for 12 days and then assayed by DAPI staining, F4/80 immunofluorescence and glucan shell fluorescence in the indicated tissues. b–e, Five-week-old chow-fed ob/ob mice were injected intraperitoneally once daily for 12 days with 0.2 mg GERPs containing scrambled siRNA (control), Par2 siRNA or Cav1 siRNA. The mice were analysed 24 h after the last injection. b, Body weight. c, Immunoblots of PAR2 and CAV1 in ATMs and splenic extracts. d, Il6, Mcp1, Tnfa and Il1b mRNA in VAT. e, Plasma non-esterified fatty acids (NEFA). In b, d and e, n = 5–6 mice per group; *P < 0.05 and n.s., non-significant by two-tailed Student’s _t_-test for each siRNA GERP versus control GERP. For gel source data, see Supplementary Fig. 1.
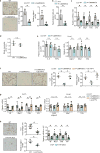
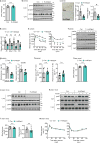
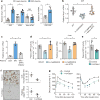
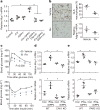
Figure 1. Hepatocyte-specific DPP4 silencing suppresses VAT inflammation and improves insulin sensitivity in DIO mice
a, VAT SVF cells from DIO mice, and ATMs and non-ATMs isolated from SVF, were incubated for 4 h with medium containing 10% (vol/vol) plasma from lean or DIO mice and then assayed for Mcp1 or Il6 mRNA (n = 4–6 mice per group; *P < 0.05 by two-tailed Student’s _t_-test). b, VAT SVF cells from DIO mice were incubated with plasma from the three DIO models described in Extended Data Fig. 1f, g and then assayed for Mcp1 mRNA. WT, wild type. n = 8 mice per group; mean ± s.e.m.; *P < 0.05 by one-way analysis of variance (ANOVA). c, SVF cells from DIO mice were incubated with lean or DIO mouse plasma that was pre-treated for 1 h with or without 10 µM DPP4 inhibitor KR62436 and then assayed for Mcp1 mRNA (n = 3 technical replicates; mean ± s.e.m.; *P < 0.05 by one-way ANOVA). d, The three groups of mice from Extended Data Fig. 1f, g were assayed for plasma DPP4 activity and hepatic Dpp4 mRNA (n = 4 mice per group; mean ± s.e.m.; *P < 0.05 by one-way ANOVA). e–g, Sixteen-week-old mice previously fed the DIO diet for 10 weeks were injected intravenously with AAV8-H1-shDpp4 (H-shDpp4) or control AAV8-H1 vector (control; or con, in f). The mice were analysed after four weeks as follows. e, Plasma DPP4 activity. f, CLS macrophages and Adgre1 mRNA in VAT, with representative images of F4/80-stained VAT. g, Blood glucose after intraperitoneal glucose or insulin (n = 6 mice per group; mean ± s.e.m.; *P < 0.05 by two-tailed Student’s _t_-test).
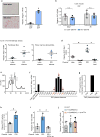
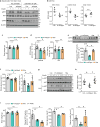
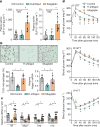
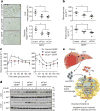
Figure 2. Silencing of hepatocyte DPP4, but not treatment with the oral DPP4 inhibitor sitagliptin, lowers VAT inflammation and improves metabolism in DIO mice
a–d, Control, H-shDpp4- and sitagliptin-treated mice from those described in Extended Data Fig. 6c–h were analysed as follows. a, Plasma active GIP (1–42) and GLP1 (7–36). NS, not significant. b, CLS macrophages and Adgre1 mRNA in VAT, with representative images of F4/80-stained VAT. c, Il6, Mcp1, Tnfa and Il1b mRNA in VAT. d, Blood glucose after oral glucose (O-GTT), intraperitoneal glucose (IP-GTT), or intraperitoneal insulin (IP-ITT). Data are mean ± s.e.m., *P < 0.05 by one-way ANOVA.
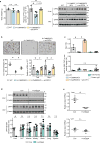
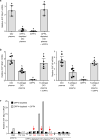
Figure 3. DPP4 and FXa synergistically activate inflammatory signalling in macrophages
a, BMDMs were pretreated with or without 10 µM FXa inhibitor rivaroxaban or 10 µM DPP4 inhibitor KR62436, followed by incubation for 4 h with rFX or rDPP4 alone or in combination. Mcp1 mRNA was then quantified. n = 4 technical replicates per group; mean ± s.e.m.; *P < 0.05 by one-way ANOVA. b, c, Sixteen-week-old mice previously fed the DIO diet for 10 weeks were treated for 20 days with 2 mg kg−1 oral rivaroxaban twice daily (Riv) or vehicle control and analysed as follows. b, CLS macrophages and Adgre1 mRNA in VAT, with representative images of F4/80-stained VAT. c, Blood glucose after intraperitoneal glucose or insulin (n = 5 mice per group; mean ± s.e.m.; *P < 0.05 by two-tailed Student’s _t_-test). d, e, BMDMs from wild-type, CAV1 knockout (CAV1 KO) or PAR2 knockout (PAR2 KO) mice were incubated for 4 h with or without rFXa and rDPP4 and then assayed for Mcp1 and Il6 mRNA. n = 4 technical replicates per group; mean ± s.e.m.; *P < 0.05 by two-way ANOVA.
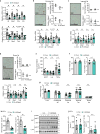
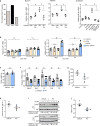
Figure 4. Silencing PAR2 or CAV1 in ATMs in obese mice lowers VAT inflammation and improves response to insulin
a–d, Five-week-old, chow-fed ob/ob mice were injected intraperitoneally once a day for 12 days with 0.2 mg GERPs containing scrambled siRNA (control), Par2 siRNA (siPar2) or Cav1 siRNA (siCav1). Twenty-four hours after the last injection, the mice were analysed as follows. a, CLS macrophages and Adgre1 mRNA in VAT, with representative images of F4/80-stained VAT. b, Blood glucose and plasma insulin 5 h after food withdrawal. c, Blood glucose after intraperitoneal glucose or insulin. d, Total AKT and p-AKT in VAT and liver after portal vein insulin injection. n = 5–6 mice per group; *P < 0.05 by two-tailed Student’s _t_-test for each siRNA GERP versus control GERP. For gel source data, see Supplementary Fig. 1. e, Summary scheme: obesity triggers a Ca2+–CaMKII–ATF4 pathway in hepatocytes, leading to induction of DPP4 and secretion of soluble DPP4 (sol-DPP4). Soluble DPP4 activates a CAV1–IRAK1–TAK1 pathway in ATMs, which, in combination with PAR2–RAF1 activation by FXa in ATMs, promotes ERK1/2–NF-kB-mediated inflammation. VAT inflammation exacerbates glucose intolerance, impaired insulin signalling in adipose and liver and hyperinsulinaemia.
Similar articles
- Adipose dipeptidyl peptidase-4 and obesity: correlation with insulin resistance and depot-specific release from adipose tissue in vivo and in vitro.
Sell H, Blüher M, Klöting N, Schlich R, Willems M, Ruppe F, Knoefel WT, Dietrich A, Fielding BA, Arner P, Frayn KN, Eckel J. Sell H, et al. Diabetes Care. 2013 Dec;36(12):4083-90. doi: 10.2337/dc13-0496. Epub 2013 Oct 15. Diabetes Care. 2013. PMID: 24130353 Free PMC article. - Elevated hepatic DPP4 activity promotes insulin resistance and non-alcoholic fatty liver disease.
Baumeier C, Schlüter L, Saussenthaler S, Laeger T, Rödiger M, Alaze SA, Fritsche L, Häring HU, Stefan N, Fritsche A, Schwenk RW, Schürmann A. Baumeier C, et al. Mol Metab. 2017 Oct;6(10):1254-1263. doi: 10.1016/j.molmet.2017.07.016. Epub 2017 Aug 4. Mol Metab. 2017. PMID: 29031724 Free PMC article. - DPP4 deletion in adipose tissue improves hepatic insulin sensitivity in diet-induced obesity.
Romacho T, Sell H, Indrakusuma I, Roehrborn D, Castañeda TR, Jelenik T, Markgraf D, Hartwig S, Weiss J, Al-Hasani H, Roden M, Eckel J. Romacho T, et al. Am J Physiol Endocrinol Metab. 2020 May 1;318(5):E590-E599. doi: 10.1152/ajpendo.00323.2019. Epub 2019 Dec 31. Am J Physiol Endocrinol Metab. 2020. PMID: 31891536 - The "Big Bang" in obese fat: Events initiating obesity-induced adipose tissue inflammation.
Wensveen FM, Valentić S, Šestan M, Turk Wensveen T, Polić B. Wensveen FM, et al. Eur J Immunol. 2015 Sep;45(9):2446-56. doi: 10.1002/eji.201545502. Epub 2015 Aug 19. Eur J Immunol. 2015. PMID: 26220361 Review. - Immunopathology of Adipose Tissue during Metabolic Syndrome.
Ghazarian M, Luck H, Revelo XS, Winer S, Winer DA. Ghazarian M, et al. Turk Patoloji Derg. 2015;31 Suppl 1:172-80. doi: 10.5146/tjpath.2015.01323. Turk Patoloji Derg. 2015. PMID: 26177326 Review.
Cited by
- The multiple actions of dipeptidyl peptidase 4 (DPP-4) and its pharmacological inhibition on bone metabolism: a review.
Pechmann LM, Pinheiro FI, Andrade VFC, Moreira CA. Pechmann LM, et al. Diabetol Metab Syndr. 2024 Jul 25;16(1):175. doi: 10.1186/s13098-024-01412-x. Diabetol Metab Syndr. 2024. PMID: 39054499 Free PMC article. Review. - Autophagy Dysregulation in Metabolic Associated Fatty Liver Disease: A New Therapeutic Target.
Chen CL, Lin YC. Chen CL, et al. Int J Mol Sci. 2022 Sep 2;23(17):10055. doi: 10.3390/ijms231710055. Int J Mol Sci. 2022. PMID: 36077452 Free PMC article. Review. - CRISPR-Cas9-mediated knockout of SPRY2 in human hepatocytes leads to increased glucose uptake and lipid droplet accumulation.
Cook NL, Pjanic M, Emmerich AG, Rao AS, Hetty S, Knowles JW, Quertermous T, Castillejo-López C, Ingelsson E. Cook NL, et al. BMC Endocr Disord. 2019 Oct 29;19(1):115. doi: 10.1186/s12902-019-0442-8. BMC Endocr Disord. 2019. PMID: 31664995 Free PMC article. - Protein and gene markers of metabolic dysfunction and inflammation together associate with functional connectivity in reward and motor circuits in depression.
Goldsmith DR, Bekhbat M, Le NA, Chen X, Woolwine BJ, Li Z, Haroon E, Felger JC. Goldsmith DR, et al. Brain Behav Immun. 2020 Aug;88:193-202. doi: 10.1016/j.bbi.2020.05.013. Epub 2020 May 5. Brain Behav Immun. 2020. PMID: 32387344 Free PMC article. - Hepatocyte-specific HIF-1α ablation improves obesity-induced glucose intolerance by reducing first-pass GLP-1 degradation.
Lee YS, Riopel M, Cabrales P, Bandyopadhyay GK. Lee YS, et al. Sci Adv. 2019 Jul 3;5(7):eaaw4176. doi: 10.1126/sciadv.aaw4176. eCollection 2019 Jul. Sci Adv. 2019. PMID: 31281892 Free PMC article.
References
- Dasgupta S, et al. NF-κB mediates lipid-induced fetuin-A expression in hepatocytes that impairs adipocyte function effecting insulin resistance. Biochem. J. 2010;429:451–462. - PubMed
- Blüher M. Adipose tissue inflammation: a cause or consequence of obesity-related insulin resistance? Clin. Sci (Lond.) 2016;130:1603–1614. - PubMed
Publication types
MeSH terms
Substances
Grants and funding
- R01 HL140554/HL/NHLBI NIH HHS/United States
- R01 HL075662/HL/NHLBI NIH HHS/United States
- P30 CA013696/CA/NCI NIH HHS/United States
- T32 HL007343/HL/NHLBI NIH HHS/United States
- P01 HL087123/HL/NHLBI NIH HHS/United States
- R01 DK106045/DK/NIDDK NIH HHS/United States
- R01 DK103047/DK/NIDDK NIH HHS/United States
- P30 DK063608/DK/NIDDK NIH HHS/United States
LinkOut - more resources
Full Text Sources
Other Literature Sources
Medical
Molecular Biology Databases
Research Materials
Miscellaneous
