A Beginner's Guide to Analysis of RNA Sequencing Data - PubMed (original) (raw)
A Beginner's Guide to Analysis of RNA Sequencing Data
Clarissa M Koch et al. Am J Respir Cell Mol Biol. 2018 Aug.
Abstract
Since the first publications coining the term RNA-seq (RNA sequencing) appeared in 2008, the number of publications containing RNA-seq data has grown exponentially, hitting an all-time high of 2,808 publications in 2016 (PubMed). With this wealth of RNA-seq data being generated, it is a challenge to extract maximal meaning from these datasets, and without the appropriate skills and background, there is risk of misinterpretation of these data. However, a general understanding of the principles underlying each step of RNA-seq data analysis allows investigators without a background in programming and bioinformatics to critically analyze their own datasets as well as published data. Our goals in the present review are to break down the steps of a typical RNA-seq analysis and to highlight the pitfalls and checkpoints along the way that are vital for bench scientists and biomedical researchers performing experiments that use RNA-seq.
Keywords: RNA sequencing; bioinformatics; data analysis; transcriptomics.
Figures
Figure 1.
Assessing inter- and intragroup variability. (A) Principal component (PC) analysis plot displaying all 12 samples along PC1 and PC2, which describe 68.1% and 20.3% of the variability, respectively, within the expression data set. PC analysis was applied to normalized (reads per kilobases of transcript per 1 million mapped reads) and log-transformed count data. (B) Pearson’s correlation plot visualizing the correlation (r) values between samples. Scale bar represents the range of the correlation coefficients (r) displayed.
Figure 2.
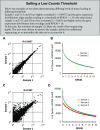
Determining a low count threshold. (A) The number of genes at a given reads per kilobases of transcript per 1 million mapped reads (RPKM) value for each sample (bins = 120; bin size = 0.1). Inset box enlarged at right highlights a subsection of the figure that was used to define an RPKM cutoff of 1 (bin size = 0.1). (B_–_D) Scatterplots comparing the expression of individual genes between two samples for (B) most correlated samples within a group (r = 0.9989), (C) least correlated samples within a group (r = 0.978), and (D) least correlated samples within the data set (r = 0.9089). Data are plotted on a log2 scale.
Figure 3.
The effect of group size and intragroup variance on ability to identify differentially expressed genes. MA plots showing average logarithmically transformed counts per million (CPM) versus the log2 fold change for pairwise comparisons between the Transplant 2H versus Naive (top row), Transplant 24H versus Naive (middle row), and Transplant 24H versus Transplant 2H (bottom row) groups. Pairwise comparisons were run using (A) all four replicates per group, (B) the two most correlated replicates, (C) the two least correlated replicates, or (D) randomized data in which two replicates from the Naive group and two replicates from the Transplant 2H group were combined into each group. Up- and downregulated differentially expressed genes with a false discovery rate less than 0.05 are shown in blue and red, respectively.
Figure 4.
Distribution of ANOVA P values for (A) all (n = 4), (B) most correlated (n = 2), and (C) least correlated (n = 2) replicates. P values were distributed into 100 bins between 0 and 1, with each bar representing a 0.01 increase.
Figure 5.
Effect of group size and intragroup variance on ability to identify gene clusters. Hierarchical clustering performed on differentially expressed genes defined by ANOVA with a false discovery rate less than 0.05. (A) Using all replicates per group, 7,166 genes were clustered. (B) Most and (C) least correlated samples resulted in input lists of 2,150 and 862 genes, respectively. The _z_-score scale bar represents relative expression ±2 SD from the mean.
Figure 6.
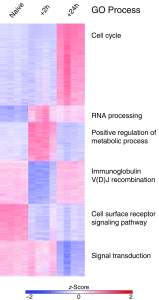
_k_-Means clustering and Gene Ontology (GO) enrichment analysis using the top differentially expressed genes. _k_-Means clustering was performed on the data set containing all samples (n = 4/group), and the top GO process from each cluster is shown.
Figure 7.
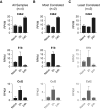
Individual gene analysis. RPKM expression values for the Cdk2, Il1b, and Ccl2 genes are shown for the datasets containing (A) all samples (n = 4/group), (B) most correlated replicates (n = 2/group), and (C) least correlated replicates (n = 2/group). Although all three genes were identified as differentially expressed genes (DEGs) from the full (n = 4) dataset in Figure 6, Ccl2 was not among the DEGs in the “most correlated” comparison, owing to an ANOVA false discovery rate greater than 0.05, and neither Il1b nor Ccl2 was a DEG in the “least correlated” comparison. Genes that were not DEGs in the designated dataset are displayed in gray.
Similar articles
- A Guide for Designing and Analyzing RNA-Seq Data.
Chatterjee A, Ahn A, Rodger EJ, Stockwell PA, Eccles MR. Chatterjee A, et al. Methods Mol Biol. 2018;1783:35-80. doi: 10.1007/978-1-4939-7834-2_3. Methods Mol Biol. 2018. PMID: 29767357 - Analysis of ChIP-Seq and RNA-Seq Data with BioWardrobe.
Vallabh S, Kartashov AV, Barski A. Vallabh S, et al. Methods Mol Biol. 2018;1783:343-360. doi: 10.1007/978-1-4939-7834-2_17. Methods Mol Biol. 2018. PMID: 29767371 Free PMC article. - SPARTA: Simple Program for Automated reference-based bacterial RNA-seq Transcriptome Analysis.
Johnson BK, Scholz MB, Teal TK, Abramovitch RB. Johnson BK, et al. BMC Bioinformatics. 2016 Feb 4;17:66. doi: 10.1186/s12859-016-0923-y. BMC Bioinformatics. 2016. PMID: 26847232 Free PMC article. - Differential Expression Analysis of RNA-seq Reads: Overview, Taxonomy, and Tools.
Chowdhury HA, Bhattacharyya DK, Kalita JK. Chowdhury HA, et al. IEEE/ACM Trans Comput Biol Bioinform. 2020 Mar-Apr;17(2):566-586. doi: 10.1109/TCBB.2018.2873010. Epub 2018 Oct 1. IEEE/ACM Trans Comput Biol Bioinform. 2020. PMID: 30281477 Review. - RNA-Seq methods for transcriptome analysis.
Hrdlickova R, Toloue M, Tian B. Hrdlickova R, et al. Wiley Interdiscip Rev RNA. 2017 Jan;8(1):10.1002/wrna.1364. doi: 10.1002/wrna.1364. Epub 2016 May 19. Wiley Interdiscip Rev RNA. 2017. PMID: 27198714 Free PMC article. Review.
Cited by
- Pan-Cancer Single-Cell Transcriptomic Analysis Reveals Divergent Expression of Embryonic Proangiogenesis Gene Modules in Tumorigenesis.
Wang Z, Su Y, Zhao L, Liu W, Zhang J, Yang W, Li H, Feng M, Wang H, Song Z. Wang Z, et al. Cancer Med. 2024 Nov;13(21):e70373. doi: 10.1002/cam4.70373. Cancer Med. 2024. PMID: 39526457 Free PMC article. - The Translatome Map: RNC-Seq vs. Ribo-Seq for Profiling of HBE, A549, and MCF-7 Cell Lines.
Kozlova A, Sarygina E, Ilgisonis E, Tarbeeva S, Ponomarenko E. Kozlova A, et al. Int J Mol Sci. 2024 Oct 12;25(20):10970. doi: 10.3390/ijms252010970. Int J Mol Sci. 2024. PMID: 39456753 Free PMC article. - Comparison of direct cDNA and PCR-cDNA Nanopore sequencing of RNA from Escherichia coli isolates.
Rodger G, Lipworth S, Barrett L, Oakley S, Crook DW, Eyre DW, Stoesser N. Rodger G, et al. Microb Genom. 2024 Oct;10(10):001296. doi: 10.1099/mgen.0.001296. Microb Genom. 2024. PMID: 39453698 Free PMC article. - Nearby and non-nested genes in the human genome have more similar genotype tissue expression.
Dong J, Brown S, Truong K. Dong J, et al. PLoS One. 2024 Sep 18;19(9):e0307360. doi: 10.1371/journal.pone.0307360. eCollection 2024. PLoS One. 2024. PMID: 39292702 Free PMC article. - Gene Expression of Neurogenesis Related to Exercise Intensity in a Cerebral Infarction Rat Model.
Song MK, Jo HS, Kim EJ, Kim JK, Lee SG. Song MK, et al. Int J Mol Sci. 2024 Aug 19;25(16):8997. doi: 10.3390/ijms25168997. Int J Mol Sci. 2024. PMID: 39201683 Free PMC article.
References
- Mortazavi A, Williams BA, McCue K, Schaeffer L, Wold B. Mapping and quantifying mammalian transcriptomes by RNA-Seq. Nat Methods. 2008;5:621–628. - PubMed
- Holt RA, Jones SJ. The new paradigm of flow cell sequencing. Genome Res. 2008;18:839–846. - PubMed
Publication types
MeSH terms
Grants and funding
- K08 HL125940/HL/NHLBI NIH HHS/United States
- R50 CA221848/CA/NCI NIH HHS/United States
- P01 AG049665/AG/NIA NIH HHS/United States
- P01 HL071643/HL/NHLBI NIH HHS/United States
- R01 HL128194/HL/NHLBI NIH HHS/United States
- T32 DK077662/DK/NIDDK NIH HHS/United States
LinkOut - more resources
Full Text Sources
Other Literature Sources


