Stoichiometry and compositional plasticity of the yeast nuclear pore complex revealed by quantitative fluorescence microscopy - PubMed (original) (raw)
Stoichiometry and compositional plasticity of the yeast nuclear pore complex revealed by quantitative fluorescence microscopy
Sasikumar Rajoo et al. Proc Natl Acad Sci U S A. 2018.
Abstract
The nuclear pore complex (NPC) is an eightfold symmetrical channel providing selective transport of biomolecules across the nuclear envelope. Each NPC consists of ∼30 different nuclear pore proteins (Nups) all present in multiple copies per NPC. Significant progress has recently been made in the characterization of the vertebrate NPC structure. However, because of the estimated size differences between the vertebrate and yeast NPC, it has been unclear whether the NPC architecture is conserved between species. Here, we have developed a quantitative image analysis pipeline, termed nuclear rim intensity measurement (NuRIM), to precisely determine copy numbers for almost all Nups within native NPCs of budding yeast cells. Our analysis demonstrates that the majority of yeast Nups are present at most in 16 copies per NPC. This reveals a dramatic difference to the stoichiometry determined for the human NPC, suggesting that despite a high degree of individual Nup conservation, the yeast and human NPC architecture is significantly different. Furthermore, using NuRIM, we examined the effects of mutations on NPC stoichiometry. We demonstrate for two paralog pairs of key scaffold Nups, Nup170/Nup157 and Nup192/Nup188, that their altered expression leads to significant changes in the NPC stoichiometry inducing either voids in the NPC structure or substitution of one paralog by the other. Thus, our results not only provide accurate stoichiometry information for the intact yeast NPC but also reveal an intriguing compositional plasticity of the NPC architecture, which may explain how differences in NPC composition could arise in the course of evolution.
Keywords: NPC composition; nuclear pore complex; nucleoporins; quantitative fluorescence microscopy; stoichiometry.
Conflict of interest statement
The authors declare no conflict of interest.
Figures
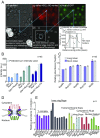
Fig. 1.
Analysis of the relative NPC stoichiometry. (A) Outline of the nuclear rim intensity measurement (NuRIM) technique. (A, i_–_vi) Cells coexpressing dsRed-HDEL and various GFP-tagged Nups were imaged sequentially in bright-field, dsRed, and GFP channels. (A, i) Bright-field channel shows localization of immobilized yeast cells. (A, ii) Exclusion of the overcrowded regions (light areas) based on the bright-field images. (A, iii) dsRed-HDEL channel shows localization of dsRed-HDEL marking the NEs. (A, iv) Production of binary NE contour masks based on the dsRed images. (A, v) GFP channel showing localization of endogenously GFP-tagged Nups. (A, vi) Background-subtracted Nup-GFP intensities are measured and averaged across thousands of binary NE contours. (Scale bars: 2 μm.) (B) Linearity of GFP-based intensity measurements. Cells expressing indicated yEGFP-tagged Nups alone or in pairwise combinations were imaged in parallel. Corresponding NE signal intensities were quantified using NuRIM. Gray bars represent corresponding arithmetic sums of the NE signal intensities of singly labeled strains. Mean ± SD. n, number of image frames analyzed. (C) Robustness of GFP-based intensity measurements against microenvironmental variability. Intensity values obtained using NuRIM for the indicated Nups with C-terminal yEGFP tag separated by 6- or 102-aa linker sequence. Intensity values were normalized to Nup84-yEGFP containing a short linker. Mean ± SD. n, number of image frames analyzed. (D) Schematic representation of the NPC. Nup subgroups are depicted as colored cartoons. (E) Relative abundance of yeast Nups. NE intensities for the indicated yEGFP-tagged Nups were quantified using NuRIM and normalized for the average value obtained for the six components of the Y complex. *Relative abundance for GFP-Nic96 was obtained from independent measurements normalized to Nup120-GFP. Mean ± SD. n, number of independent experiments performed on different days.
Fig. 2.
Absolute stoichiometry of yeast Nups. (A) Representative intensity histograms and Gaussian fits (smooth lines) obtained for single yEGFP molecules, single NPCs in regions between separating nuclei in Nup84-yEGFP–expressing yeast cells (arrowhead), and for the yeast-expressed 120-mer VP2-yEGFP particles (arrowhead). (Scale bars: 2 μm.) (B) Intensity histograms and fits are displayed similar to A for single NPCs in Nup84-sfGFP–expressing yeast cells, and for purified SF12 and SF24 particles containing 12 and 24 sfGFP molecules, respectively. (C, i) Representative fluorescence microscopy image showing localization of Nup84-yEGFP–labeled NPCs. (C, ii) Computational model of the NE. NPCs are represented as green dots, dsRed-HDEL as red dots, and dim sources simulating background fluorescence as blue dots. (C, iii) Simulated image of the NE produced computationally from the model ii. Note good resemblance to genuine Nup84-yEGFP localization (compare with i). Inset compares computed PSF with experimentally acquired PSF. (C, iv) Representative 3D rendering of image stack shows heat map of intensities in Nup84-yEGFP cells illustrating high-intensity spots or “speckles” (red) produced due to stochastic overlap of the ∼120 NPCs. (Scale bar: 200 nm.)
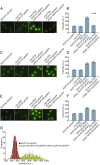
Fig. 3.
Analysis of Nup stoichiometry in yeast mutants. (A, C, and E) Representative images illustrating Nup-yEGFP localization in actively growing yeast cells with specified genotypes. The corresponding NE intensities quantified using NuRIM are shown in B, D, and F, respectively. Mean ± SD. n, number of image frames analyzed for B, D, and F. (Scale bars: 2 μm.) (G) Representative intensity histograms and Gaussian fits obtained for single NPCs in NUP170-yEGFP and NUP170-yEGFP nup170Δ URA3::NUP170-yEGFP strains.
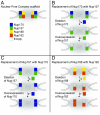
Fig. 4.
Modular organization of the NPC. (A) Schematic of the NPC scaffold. (B_–_D) Illustration depicting the experimental outcomes shown in Fig. 3.
Comment in
- Yeast and Human Nuclear Pore Complexes: Not So Similar After All.
Shav-Tal Y, Tripathi T. Shav-Tal Y, et al. Trends Cell Biol. 2018 Aug;28(8):589-591. doi: 10.1016/j.tcb.2018.06.004. Epub 2018 Jun 22. Trends Cell Biol. 2018. PMID: 29941187
Similar articles
- Mapping the native organization of the yeast nuclear pore complex using nuclear radial intensity measurements.
Vallotton P, Rajoo S, Wojtynek M, Onischenko E, Kralt A, Derrer CP, Weis K. Vallotton P, et al. Proc Natl Acad Sci U S A. 2019 Jul 16;116(29):14606-14613. doi: 10.1073/pnas.1903764116. Epub 2019 Jul 1. Proc Natl Acad Sci U S A. 2019. PMID: 31262825 Free PMC article. - Natively Unfolded FG Repeats Stabilize the Structure of the Nuclear Pore Complex.
Onischenko E, Tang JH, Andersen KR, Knockenhauer KE, Vallotton P, Derrer CP, Kralt A, Mugler CF, Chan LY, Schwartz TU, Weis K. Onischenko E, et al. Cell. 2017 Nov 2;171(4):904-917.e19. doi: 10.1016/j.cell.2017.09.033. Epub 2017 Oct 12. Cell. 2017. PMID: 29033133 Free PMC article. - Architecture of the linker-scaffold in the nuclear pore.
Petrovic S, Samanta D, Perriches T, Bley CJ, Thierbach K, Brown B, Nie S, Mobbs GW, Stevens TA, Liu X, Tomaleri GP, Schaus L, Hoelz A. Petrovic S, et al. Science. 2022 Jun 10;376(6598):eabm9798. doi: 10.1126/science.abm9798. Epub 2022 Jun 10. Science. 2022. PMID: 35679425 Free PMC article. - [Nuclear pores: from yeast to higher eukaryotes].
Doye V. Doye V. J Soc Biol. 2002;196(4):349-54. J Soc Biol. 2002. PMID: 12645306 Review. French. - Membrane-coating lattice scaffolds in the nuclear pore and vesicle coats: commonalities, differences, challenges.
Leksa NC, Schwartz TU. Leksa NC, et al. Nucleus. 2010 Jul-Aug;1(4):314-8. doi: 10.4161/nucl.1.4.11798. Epub 2010 Mar 12. Nucleus. 2010. PMID: 21327078 Free PMC article. Review.
Cited by
- Uip4p modulates nuclear pore complex function in Saccharomyces cerevisiae.
Deolal P, Jamir I, Mishra K. Deolal P, et al. Nucleus. 2022 Dec;13(1):79-93. doi: 10.1080/19491034.2022.2034286. Nucleus. 2022. PMID: 35171083 Free PMC article. - Atomic force microscopy reveals structural variability amongst nuclear pore complexes.
Stanley GJ, Fassati A, Hoogenboom BW. Stanley GJ, et al. Life Sci Alliance. 2018 Aug 20;1(4):e201800142. doi: 10.26508/lsa.201800142. eCollection 2018 Aug. Life Sci Alliance. 2018. PMID: 30456374 Free PMC article. - Assembly principle of a membrane-anchored nuclear pore basket scaffold.
Cibulka J, Bisaccia F, Radisavljević K, Gudino Carrillo RM, Köhler A. Cibulka J, et al. Sci Adv. 2022 Feb 11;8(6):eabl6863. doi: 10.1126/sciadv.abl6863. Epub 2022 Feb 11. Sci Adv. 2022. PMID: 35148185 Free PMC article. - Nuclear mRNA metabolism drives selective basket assembly on a subset of nuclear pore complexes in budding yeast.
Bensidoun P, Reiter T, Montpetit B, Zenklusen D, Oeffinger M. Bensidoun P, et al. Mol Cell. 2022 Oct 20;82(20):3856-3871.e6. doi: 10.1016/j.molcel.2022.09.019. Epub 2022 Oct 10. Mol Cell. 2022. PMID: 36220102 Free PMC article. - In-cell architecture of the nuclear pore and snapshots of its turnover.
Allegretti M, Zimmerli CE, Rantos V, Wilfling F, Ronchi P, Fung HKH, Lee CW, Hagen W, Turoňová B, Karius K, Börmel M, Zhang X, Müller CW, Schwab Y, Mahamid J, Pfander B, Kosinski J, Beck M. Allegretti M, et al. Nature. 2020 Oct;586(7831):796-800. doi: 10.1038/s41586-020-2670-5. Epub 2020 Sep 2. Nature. 2020. PMID: 32879490
References
- Watson ML. Pores in the mammalian nuclear membrane. Biochim Biophys Acta. 1954;15:475–479. - PubMed
Publication types
MeSH terms
Substances
LinkOut - more resources
Full Text Sources
Other Literature Sources
Molecular Biology Databases


