DNA Repair Network Analysis Reveals Shieldin as a Key Regulator of NHEJ and PARP Inhibitor Sensitivity - PubMed (original) (raw)
. 2018 May 3;173(4):972-988.e23.
doi: 10.1016/j.cell.2018.03.050. Epub 2018 Apr 12.
Kumar Somyajit 2, Takeo Narita 1, Elina Maskey 1, Andre Stanlie 3, Magdalena Kremer 4, Dimitris Typas 2, Michael Lammers 5, Niels Mailand 2, Andre Nussenzweig 3, Jiri Lukas 2, Chunaram Choudhary 6
Affiliations
- PMID: 29656893
- PMCID: PMC8108093
- DOI: 10.1016/j.cell.2018.03.050
DNA Repair Network Analysis Reveals Shieldin as a Key Regulator of NHEJ and PARP Inhibitor Sensitivity
Rajat Gupta et al. Cell. 2018.
Abstract
Repair of damaged DNA is essential for maintaining genome integrity and for preventing genome-instability-associated diseases, such as cancer. By combining proximity labeling with quantitative mass spectrometry, we generated high-resolution interaction neighborhood maps of the endogenously expressed DNA repair factors 53BP1, BRCA1, and MDC1. Our spatially resolved interaction maps reveal rich network intricacies, identify shared and bait-specific interaction modules, and implicate previously concealed regulators in this process. We identified a novel vertebrate-specific protein complex, shieldin, comprising REV7 plus three previously uncharacterized proteins, RINN1 (CTC-534A2.2), RINN2 (FAM35A), and RINN3 (C20ORF196). Recruitment of shieldin to DSBs, via the ATM-RNF8-RNF168-53BP1-RIF1 axis, promotes NHEJ-dependent repair of intrachromosomal breaks, immunoglobulin class-switch recombination (CSR), and fusion of unprotected telomeres. Shieldin functions as a downstream effector of 53BP1-RIF1 in restraining DNA end resection and in sensitizing BRCA1-deficient cells to PARP inhibitors. These findings have implications for understanding cancer-associated PARPi resistance and the evolution of antibody CSR in higher vertebrates.
Keywords: 53BP1; BRCA1; DNA damage repair; NHEJ; PARP inhibitors; antibody class-switch recombination; proteomics; proximity labeling; shieldin; telomere maintenance.
Copyright © 2018 Elsevier Inc. All rights reserved.
Conflict of interest statement
DECLARATION OF INTERESTS
The authors have no conflict of interest to declare.
Figures
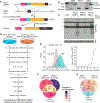
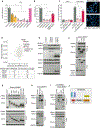
Figure 1.. PROX-NET Analyses of the Endogenous 53BP1, BRCA1, and MDC1
(A) Strategy for CRISPR-based 33-FLAG-APEX2 tagging, exemplified by 53BP1. (B) Genomic confirmation of the APEX-modified 53BP1, BRCA1, and MDC1. (C) Confirmation of the APEX functionality by selective protein biotinylation in the APEX-engineered cells. The discrete bands, denoted with asterisks, show APEX-independent biotinylation by native enzymes. (D) SILAC-based PROX-NET strategy for mapping the neighborhood interaction networks of APEX-tagged 53BP1, BRCA1, and MDC1. (E) Distribution of SILAC ratios of known DDR and non-DDR factors quantified in the PROX-NET analyses. Median log2 SILAC ratios of each group are shown on the top of each distribution. The line plot (the right panel) shows the relationship between log2 SILAC ratio of quantified proteins and odds ratio of enrichment of known DDR factors. (F) The overlap of all quantified, and significantly enriched proteins, among three baits. The numbers of quantified proteins are indicated without parentheses, and the numbers of significantly enriched proteins are indicated within parentheses. The color code in each area shows the fraction of the significantly enriched proteins (i.e., number of significantly enriched proteins/total number of proteins quantified). (G) Overlap of the significantly enriched proteins among different baits. The Venn diagram shows the number of proteins enriched in PROX-NET analysis of each bait and their overlap with the other baits. The numbers in parentheses indicate the numbers of known DDR factors enriched in the dataset. See also Figures S1 and S2 and Table S1.
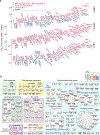
Figure 2.. The Landscape of 53BP1, BRCA1, and MDC1 Interaction Neighborhoods
(A) The rank plot of 100 most highly enriched proteins in proximity to 53BP1, BRCA1, and MDC1. The proteins above the line were commonly enriched in at least two baits, whereas the proteins below the line were specifically enriched with the indicated baits. (B) Proteins enriched in PROX-NET analyses are grouped according to their role in specific pathways, and known protein complexes and interactions are shown. Protein complexes are circled red, larger protein assemblies are indicated with dotted lines, and names of protein complexes are indicated in bold, dark blue text. Protein complex members that were not enriched significantly, or were not identified, are indicated in light blue text. The red, orange, and blue bars above each protein show the bait specificity and degree of enrichment. See also Figures S1, S2, and S3 and Tables S2 and S3.
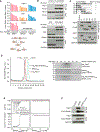
Figure 3.. RINN1 Directly Interacts with REV7
(A) The bar chart shows log2 fold enrichment of 53BP1, RIF1, and RINN1 in PROX-NET dataset of 53BP1, BRCA1, and MDC1. The network shows de novo predicted interactions of RINN1. (B) Reciprocal interaction between RINN1 and REV7. FLAG-RINN1 and GFP-REV7 were immunoprecipitated, and interaction with the endogenous REV7 and RINN1, respectively, was analyzed by immunoblotting. (C) Mapping of REV7 interacting region in RINN1. (D) The elution profiles (the top panel) of recombinant His6-REV7R124A and RINN128–83 and His6-REV7·RINN128–83 in a S75 10/300 analytical size exclusion chromatography (SEC) column. Fractions from analytical SEC runs were analyzed by SDS-PAGE and Coomassie staining for the whole elution range, showing elution of the REV7·RINN128–83 complex. (E) Thermodynamic analysis of the REV7R124A-RINN128–83 interaction (left panel). REV7R124A binds tightly to RINN128–83 with a nanomolar affinity (KD = 15.8 nM). The control (the right panel) shows titration of RINN128–83 in buffer alone. (F) Mutation of conserved P53 and P58 abolishes RINN1 interaction with REV7. See also Figure S4 and Table S4.
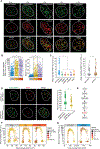
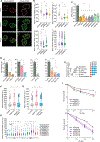
Figure 4.. RINN1 Is Recruited to DSBs through the ATM-RNF8-RNF168–53BP1-RIF1 Axis, and the Recruitment Is Regulated by BRCA1 during the Cell Cycle
(A) RINN1 recruitment to IRIF and co-localization with γH2AX, REV7, 53BP1, and RIF1. (B) Quantification of RINN1 IRIF count and intensity without or with the indicated doses of IR. RINN1 IRIFs were quantified at a single-cell level using quantitative image-based cytometry (QIBC) (Toledo et al., 2013). a.u., arbitrary units. *p < 0.05, approximative Wilcoxon-Mann-Whitney test. (C) RINN1 recruitment to IRIF requires the ATM-RNF8-RNF168–53BP1-RIF1 axis, but not REV7; quantification as in (B). *p < 0.05, approximative Wilcoxon-Mann-Whitney test. (IR: 2Gy, 1-hr recovery). (D) Expression of siRNA-resistant RINN1 wild-type, but not RINN1 P53A,P58A, restores REV7 recruitment to IRIF in cells depleted of the endogenous RINN1. Representative images and quantification (the bar chart) of REV7 foci intensity are shown. (IR: 4Gy, 1-hr recovery). *p < 0.05, approximative Wilcoxon-Mann-Whitney test. (E) Pathway diagram for the recruitment of RINN1 to DNA damage sites. (F) QIBC-based quantification of RINN1 foci intensity in individual cells during the cell cycle. Cells were left untreated or were exposed to ionization radiation (1 Gy or 2 Gy, 1-hr recovery). (G) RINN1 recruitment to IRIF in control and _BRCA1_-depleted cells during the cell cycle. (IR: 2Gy, 1-hr recovery). See also Figures S5 and S6.
Figure 5.. RINN1 Regulates NHEJ and Forms the Novel Shieldin Complex with REV7 and RINN2–3
(A) NHEJ efficiency (relative to control) was quantified using the EJ5-GFP reporter after knockdown of the indicated genes. The bars show mean values, and circles indicate values from replicate experiments. *p < 0.05, Student’s t test. NS, non-significant (B) NHEJ-dependent repair was quantified using the EJ5-GFP reporter after transfection of the indicated RINN1 siRNAs and plasmids encoding siRNA-resistant RINN1 wild-type or RINN1P53A,P58A; quantification as in (A). *p < 0.05, Student’s t test. (C) Telomere fusion in TRF2ts MEFs after knockdown of _Rinn1_ and after the introduction of shRNA-resistant _RINN1_ in the knockdown cells. (n = 2, with an >2,500 chromosome count). Representative images of metaphase spreads of control and RINN1 shRNA-transduced TRF2ts MEFs; telomere FISH images were taken after 24 hr at 39°C. Telomeres and DNA are stained with PNA probe (red) and DAPI (blue), respectively. *p < 0.05, Cochran-Mantel-Haenszel test. (D) Identification RINN1-interacting proteins by AP-MS. The scatterplot shows distribution of log2 SILAC ratio in RINN1-expressing cells as compared to control pull-down. The enriched bait protein and co-enriched shieldin components are marked with red dots, and protein names are indicated. The table shows the number of unique peptides and sequence coverage of the identified shieldin components. (E–I) Validation of RINN2–3 interaction with RINN1 and REV7 (E), mapping of RINN1-REV7 interaction region in RINN2 (F–H), and mapping of the RINN3 binding region in RINN2 (I). (J) A schematic representation of interactions among RINN1–3 and REV7. The RIM motif (RINN1-REV7 interaction motif) and FAM35 domain in RINN2 are indicated. See also Figure S6 and Tables S5 and S6.
Figure 6.. Higher Vertebrate-Specific Shieldin Is a Novel Regulator of NHEJ and DNA End Resection
(A) RINN2–3 localize to IRIF (IR: 4Gy, 2-hr recovery). (B) Quantification of RINN1–3 and REV7 recruitment to IRIF in cells depleted of the indicated genes. (IR: 4Gy, 2-hr recovery). *p < 0.05, approximative Wilcoxon-Mann-Whitney test. (C) Depletion of RINN2–3 impairs NHEJ, assay done as in Figure 5A. *p < 0.05, Student’s t test. (D) Genetic deletion or knockdown of Rinn1–3 impairs immunoglobulin CSR in CH12 cells. 53bp1 and Rev7 serve as control. The indicated genes were deleted using the CRISPR technology or were depleted using siRNA. *p < 0.05, Student’s t test. (E) Phylogenic relationship and conservation of the member of the shieldin complex. The number at each branch point indicates the estimated divergent time. mya, million years ago. (F) Quantification of chromatin binding of RPA2 in IR-treated (4Gy, 2-hr recovery) RINN1 knockout U2OS cells and the knockout cells reconstituted with RINN1. *p < 0.05, approximative Wilcoxon-Mann-Whitney test. (G) Quantification of native BrdU staining in control and RINN1 knockout U2OS cells. (IR: 2Gy, 4-hr recovery). *p < 0.05, approximative Wilcoxon-Mann-Whitney test. (H) Quantification of chromatin binding of RPA2 in IR-treated (4Gy, 2-hr recovery) cells after knockdown of the indicated genes. *p < 0.05, approximative Wilcoxon-Mann-Whitney test. NS, non-significant. (I) Clonogenic survival of U2OS cells after exposure to ionizing radiation. Control and RINN1–3 depleted cells were exposed to the indicated doses of ionization radiation and the numbers of surviving colonies were counted on day 9. Error bars represent standard error of mean. *p < 0.05, Student’s t test. See also Figures S6 and S7.
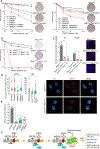
Figure 7.. Shieldin Impacts PARP Inhibitor Sensitivity and HDR in _BRCA1_-Depleted Cells
(A) Quantification of long-term survival of control and olaparib-treated U2OS cells in clonogenic assays. The representative images show crystal violet-stained colonies of olaparib-treated (0.5 μM) cells. 48 hr after transfection of the indicated siRNAs, cells were treated with the specified concentrations of olaparib, and the colonies were counted on day 9. Error bars represent standard error of mean. (B) Clonogenic survival of Brca1 Δ11/Δ11 and Brca1 Δ11/Δ11 Rinn1_−/_− cells after treatment with the indicated concentrations of olaparib. Error bars represent standard error of mean. (C) Frequency of chromosomal abnormalities and formation of radial chromosomes in Brca1 Δ11/Δ11 and Brca1 Δ11/Δ11 Rinn1_−/_− cells after treatment with olaparib (1 μM). Representative images of metaphase spreads derived from the indicated MEFs. Telomeric PNA probe (red) and DAPI (blue). Arrows point to representative radial chromosomes. *p < 0.05, Student’s t test. (D) Quantification of RAD51 foci intensity in U2OS cells depleted of RINN1 and/or BRCA1 (the left panel), as well as in Brca1 Δ11/Δ11 and Brca1 Δ11/Δ11 Rinn1_−/_− MEFs (the right panel). Representative images show RAD51 foci in Brca1 Δ11/Δ11 and Brca1 Δ11/Δ11 Rinn1_−/_− cells. (IR: 2Gy, 2-hr recovery). *p < 0.05, approximative Wilcoxon-Mann-Whitney test. (E) Knockdown of RINN1 partially restores GC efficiency in _BRCA1_-depleted cells; REV7 knockdown serves as a positive control. *p < 0.05, Student’s t test. (F) Proposed model of shieldin function in DSB repair. 53BP1-specific pathway components are depicted with solid color background, proteins in cyan indicate previously known 53BP1 pathway components, and proteins in green indicate the pathway components identified in this work. See also Figure S7.
Comment in
- Shieldin the ends for 53BP1.
Zlotorynski E. Zlotorynski E. Nat Rev Mol Cell Biol. 2018 Jun;19(6):346-347. doi: 10.1038/s41580-018-0019-9. Nat Rev Mol Cell Biol. 2018. PMID: 29700393 No abstract available.
Similar articles
- Shieldin complex promotes DNA end-joining and counters homologous recombination in BRCA1-null cells.
Dev H, Chiang TW, Lescale C, de Krijger I, Martin AG, Pilger D, Coates J, Sczaniecka-Clift M, Wei W, Ostermaier M, Herzog M, Lam J, Shea A, Demir M, Wu Q, Yang F, Fu B, Lai Z, Balmus G, Belotserkovskaya R, Serra V, O'Connor MJ, Bruna A, Beli P, Pellegrini L, Caldas C, Deriano L, Jacobs JJL, Galanty Y, Jackson SP. Dev H, et al. Nat Cell Biol. 2018 Aug;20(8):954-965. doi: 10.1038/s41556-018-0140-1. Epub 2018 Jul 18. Nat Cell Biol. 2018. PMID: 30022119 Free PMC article. - SHLD2/FAM35A co-operates with REV7 to coordinate DNA double-strand break repair pathway choice.
Findlay S, Heath J, Luo VM, Malina A, Morin T, Coulombe Y, Djerir B, Li Z, Samiei A, Simo-Cheyou E, Karam M, Bagci H, Rahat D, Grapton D, Lavoie EG, Dove C, Khaled H, Kuasne H, Mann KK, Klein KO, Greenwood CM, Tabach Y, Park M, Côté JF, Masson JY, Maréchal A, Orthwein A. Findlay S, et al. EMBO J. 2018 Sep 14;37(18):e100158. doi: 10.15252/embj.2018100158. Epub 2018 Aug 28. EMBO J. 2018. PMID: 30154076 Free PMC article. - REV7 counteracts DNA double-strand break resection and affects PARP inhibition.
Xu G, Chapman JR, Brandsma I, Yuan J, Mistrik M, Bouwman P, Bartkova J, Gogola E, Warmerdam D, Barazas M, Jaspers JE, Watanabe K, Pieterse M, Kersbergen A, Sol W, Celie PHN, Schouten PC, van den Broek B, Salman A, Nieuwland M, de Rink I, de Ronde J, Jalink K, Boulton SJ, Chen J, van Gent DC, Bartek J, Jonkers J, Borst P, Rottenberg S. Xu G, et al. Nature. 2015 May 28;521(7553):541-544. doi: 10.1038/nature14328. Epub 2015 Mar 23. Nature. 2015. PMID: 25799992 Free PMC article. - Regulation of DNA double-strand break repair pathway choice: a new focus on 53BP1.
Zhang F, Gong Z. Zhang F, et al. J Zhejiang Univ Sci B. 2021 Jan 15;22(1):38-46. doi: 10.1631/jzus.B2000306. J Zhejiang Univ Sci B. 2021. PMID: 33448186 Free PMC article. Review. - Shieldin - the protector of DNA ends.
Setiaputra D, Durocher D. Setiaputra D, et al. EMBO Rep. 2019 May;20(5):e47560. doi: 10.15252/embr.201847560. Epub 2019 Apr 4. EMBO Rep. 2019. PMID: 30948458 Free PMC article. Review.
Cited by
- Senataxin and DNA-PKcs Redundantly Promote Non-Homologous End Joining Repair of DNA Double Strand Breaks During V(D)J Recombination.
Chen BR, Pham T, Reynolds LD, Dang N, Zhang Y, Manalang K, Matos-Rodrigues G, Neidigk JR, Nussenzweig A, Tyler JK, Sleckman BP. Chen BR, et al. bioRxiv [Preprint]. 2024 Sep 26:2024.09.25.615014. doi: 10.1101/2024.09.25.615014. bioRxiv. 2024. PMID: 39386666 Free PMC article. Preprint. - 53BP1 deficiency leads to hyperrecombination using break-induced replication (BIR).
Shah SB, Li Y, Li S, Hu Q, Wu T, Shi Y, Nguyen T, Ive I, Shi L, Wang H, Wu X. Shah SB, et al. Nat Commun. 2024 Oct 5;15(1):8648. doi: 10.1038/s41467-024-52916-z. Nat Commun. 2024. PMID: 39368985 Free PMC article. - Molecular mechanism of PARP inhibitor resistance.
Huang Y, Chen S, Yao N, Lin S, Zhang J, Xu C, Wu C, Chen G, Zhou D. Huang Y, et al. Oncoscience. 2024 Sep 23;11:69-91. doi: 10.18632/oncoscience.610. eCollection 2024. Oncoscience. 2024. PMID: 39318358 Free PMC article. Review. - 53BP1 deficiency leads to hyperrecombination using break-induced replication (BIR).
Shah SB, Li Y, Li S, Hu Q, Wu T, Shi Y, Nguyen T, Ive I, Shi L, Wang H, Wu X. Shah SB, et al. bioRxiv [Preprint]. 2024 Sep 13:2024.09.11.612483. doi: 10.1101/2024.09.11.612483. bioRxiv. 2024. PMID: 39314326 Free PMC article. Updated. Preprint. - Exploring the structural landscape of DNA maintenance proteins.
Schou KB, Mandacaru S, Tahir M, Tom N, Nilsson AS, Andersen JS, Tiberti M, Papaleo E, Bartek J. Schou KB, et al. Nat Commun. 2024 Sep 5;15(1):7748. doi: 10.1038/s41467-024-49983-7. Nat Commun. 2024. PMID: 39237506 Free PMC article.
References
- Bodenhofer U, Bonatesta E, Horejš-Kainrath C, and Hochreiter S (2015). msa: an R package for multiple sequence alignment. Bioinformatics 31, 3997–3999. - PubMed
- Bryant HE, Schultz N, Thomas HD, Parker KM, Flower D, Lopez E, Kyle S, Meuth M, Curtin NJ, and Helleday T (2005). Specific killing of BRCA2-deficient tumours with inhibitors of poly(ADP-ribose) polymerase. Nature 434, 913–917. - PubMed
Publication types
MeSH terms
Substances
LinkOut - more resources
Full Text Sources
Other Literature Sources
Molecular Biology Databases
Research Materials
Miscellaneous
