Functional Brain Networks Are Dominated by Stable Group and Individual Factors, Not Cognitive or Daily Variation - PubMed (original) (raw)
. 2018 Apr 18;98(2):439-452.e5.
doi: 10.1016/j.neuron.2018.03.035.
Timothy O Laumann 2, Ashley N Nielsen 3, Deanna J Greene 4, Evan M Gordon 5, Adrian W Gilmore 6, Steven M Nelson 7, Rebecca S Coalson 8, Abraham Z Snyder 8, Bradley L Schlaggar 9, Nico U F Dosenbach 10, Steven E Petersen 11
Affiliations
- PMID: 29673485
- PMCID: PMC5912345
- DOI: 10.1016/j.neuron.2018.03.035
Functional Brain Networks Are Dominated by Stable Group and Individual Factors, Not Cognitive or Daily Variation
Caterina Gratton et al. Neuron. 2018.
Abstract
The organization of human brain networks can be measured by capturing correlated brain activity with fMRI. There is considerable interest in understanding how brain networks vary across individuals or neuropsychiatric populations or are altered during the performance of specific behaviors. However, the plausibility and validity of such measurements is dependent on the extent to which functional networks are stable over time or are state dependent. We analyzed data from nine high-quality, highly sampled individuals to parse the magnitude and anatomical distribution of network variability across subjects, sessions, and tasks. Critically, we find that functional networks are dominated by common organizational principles and stable individual features, with substantially more modest contributions from task-state and day-to-day variability. Sources of variation were differentially distributed across the brain and differentially linked to intrinsic and task-evoked sources. We conclude that functional networks are suited to measuring stable individual characteristics, suggesting utility in personalized medicine.
Keywords: brain networks; fMRI; functional connectivity; individual differences.
Copyright © 2018 Elsevier Inc. All rights reserved.
Conflict of interest statement
Declaration of Interests: The authors declare no competing interests.
Figures
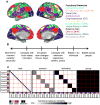
Figure 1. Scales of variability in functional brain networks
Functional brain networks (A) may vary along different time-scales (B), ranging from complete stability (with differences only attributable to sampling variability and/or measurement noise), to varying from moment-to-moment with ongoing thoughts and processes. Intermediate to these two levels, functional networks may vary on the order of minutes depending on brain state (arousal, task engagement), more slowly over the course of the day (e.g., with circadian rhythms), over the course of weeks or years (e.g., with extensive experience in a task), or may vary across individuals. (C) If functional brain networks are stable across people (“group”, illustrated in the schematic to the right), high similarity would be expected among all measurements, even when taken from different individuals, sessions, and tasks, leading to high similarity throughout the matrix. If networks are dominated by individual-variability, high similarity would be expected of networks from the same individual (squares along the diagonal), with low similarity among networks from different individuals (middle right). Alternatively, networks that vary substantially across sessions or task-states would show similarity limited to the same session (middle left) or task (left). These different sources of variability inform our understanding of the neurobiological underpinnings of functional brain networks and how they can be used to address psychological and neuropsychiatric questions concerning brain function. See also Supp. Fig. 1A.
Figure 2. Multi-dimensional scaling plots of functional networks from different individuals, tasks, and sessions
In these plots, each point represents a single functional network, plotted in a multidimensional space based on the similarity among networks. In the left panel, points are colored based on the participant identity of each functional network. In the right panel, points are colored based on task. (A) The first two dimensions were dominated by subject clustering, suggesting identity contributes most to functional network variance (note clustering by color in left plots). (B,C) Task-level clustering was captured at higher dimensions (note clustering by color in right plots). See also Supp. Fig. 1B.
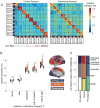
Figure 3. Quantification of the similarity in functional brain networks
(A) A similarity matrix, where every cell represents the similarity between a pair of functional networks. The matrix is organized first by individual (marked by solid black lines), then by task (colors along axes), and finally by sessions (indicated as dashed lines; here each split-half “session” represents data from 5 sessions, see Supp. Fig. 2C for the similarity matrix from separated 10 sessions). (B) Summary of similarity for networks matched on each factor, with bars of the average similarity for (i) networks across the group, from different individuals, tasks, and sessions, (ii) networks from the same task but different individuals (task), (iii) networks from the same individual but different sessions or task states (individual; diagonal in A), (iv) networks from the same individual and session (indiv & session), or (v) networks from the same individual and task (indiv & task). The relative effects of each factor are highlighted in the black portion of each bar: Individual and task effects represent the added similarity that networks matched on either of these properties have relative to unmatched (group) networks (above the red baseline); Indiv & session and Indiv & task effects are the added similarity that these effects show relative to networks matched on individual identity alone (again, black portion of each bar relative to the new red baseline). Data are represented as mean ± SEM, *** = p(FDR)<0.001. (C) To contrast the relative magnitudes of these effects, we plot the relative effect magnitudes (black portions of the bars in B), as a proportion of the total effects. Group and individual-specific effects are largest, each ~35–40% of the total network similarity effects. Moderate individual & task interactions are also evident. Minor cross-subject task and individual & session effects were present (~5% of the total). Similar results were seen for different individuals, tasks, and for matched data quantities (Supp. Fig. 2A,B), or when non-regressed task timeseries are used (Supp. Fig. 3A,B).
Figure 4. Individual, task, and session-dependent variation across brain systems
(A) Functional network similarity of top-down control (CO, FP, DAN, VAN, Sal) and sensorimotor processing (Vis, SM, SM-lat, Aud) systems (see anatomical distribution in bottom middle panel). Control systems show a stronger diagonal (similarity among networks from the same individual) and weaker off diagonals (similarity across subjects) relative to processing systems. (B) Boxplots depict the average similarity for systems matched on each factor. Control systems show greater individual effects, whereas sensorimotor systems show greater cross-subject group and task effects (control vs. processing, two-sided t-tests, **p(FDR)<0.01). (C) As a comparison, we summarize the normalized relative effects for each system type (as in Figure 3C). Note again the larger individual effects in control systems, and larger group and effects in processing systems.
Figure 5. Individual, task, and session effects across brain regions
The extent to which functional correlations for individual parcels are influenced by each effect (group, individual, task, individual & task, individual & session) is examined by plotting the relative normalized effect magnitudes for each parcel (see Figure 3C). See Supp. Fig 3C for task and session effects on a narrower color scale. Individual, task, and session effects differed in distribution, suggesting the presence of differing underlying mechanisms.
Figure 6. Modeling variability of single functional network edges
(A) Variance in single edges was modeled with factors of individual, task state, session, and their interactions, shown in a region-by-region correlation matrix (left). This simple model explained most of the variance in edges, with particularly high rates of variance explained within and among control and default systems (Supp. Fig. 4A). Variance explained per parcel, averaged over edges (right). (B) Variance explained (ω2) for each (top, averaged over edges for a parcel, _bottom_- variance explained for each edge in the functional network matrix); individual identity explains the majority of the variance. Remaining variance is primarily explained by task and task * individual (particularly in higher-level processing and control regions). Session related variance was minor, but slightly higher in the analysis conducted on 10 separated sessions rather than split-half (Supp. Fig. 5A–B)
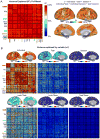
Figure 7. Relationship of variability to intrinsic and task-evoked factors
(A) The similarity among functional networks during tasks is depicted, after subtracting resting intrinsic structure from each functional network matrix. Notably, similarity values are reduced, but block structure (i.e., individual-specific effects) remains along the diagonal. Mini-blocks along the diagonal (indicating individual-specific task effects), and off-diagonal lines (indicating session effects) are now more clearly evident. (B) The similarity for networks matched on different factors (black box plots). As suggested by panel A, network similarity was strongly reduced relative to the original networks (light gray box plots, Figure 3 - for comparison, light-gray bars were calculated without the rest condition). However, individual & session, individual & task, and cross-subject task effects remain, and are enhanced in relative magnitude (right). See Supp. Fig. 6A–C for additional comparisons of functional networks after subtracting rest. (C) Similarity of task activation maps across individuals, sessions, and tasks. Note that unlike A and Figure 3, there is reduced block structure along the diagonal, primarily dominated by mini-blocks indicating a high similarity of task-specific activation-maps within an individual. The motor task is most different from others in its activation pattern. (D) Quantification of the similarity of activation maps across different factors (black). Unlike the similarity of the original functional networks (light gray, again without rest for comparison), task- and individual & task effects are larger, with only moderate individual and group effects. See Supp. Fig. 6D–F for additional comparisons and modeling analyses.
Comment in
- Personalized Neuroscience: Common and Individual-Specific Features in Functional Brain Networks.
Satterthwaite TD, Xia CH, Bassett DS. Satterthwaite TD, et al. Neuron. 2018 Apr 18;98(2):243-245. doi: 10.1016/j.neuron.2018.04.007. Neuron. 2018. PMID: 29673476 - Stable brain networks.
Schiffer AM. Schiffer AM. Nat Hum Behav. 2018 Jul;2(7):443. doi: 10.1038/s41562-018-0365-9. Nat Hum Behav. 2018. PMID: 31097798 No abstract available.
Similar articles
- The Functional Relevance of Task-State Functional Connectivity.
Cole MW, Ito T, Cocuzza C, Sanchez-Romero R. Cole MW, et al. J Neurosci. 2021 Mar 24;41(12):2684-2702. doi: 10.1523/JNEUROSCI.1713-20.2021. Epub 2021 Feb 4. J Neurosci. 2021. PMID: 33542083 Free PMC article. - The Segregation and Integration of Distinct Brain Networks and Their Relationship to Cognition.
Cohen JR, D'Esposito M. Cohen JR, et al. J Neurosci. 2016 Nov 30;36(48):12083-12094. doi: 10.1523/JNEUROSCI.2965-15.2016. J Neurosci. 2016. PMID: 27903719 Free PMC article. - General functional connectivity: Shared features of resting-state and task fMRI drive reliable and heritable individual differences in functional brain networks.
Elliott ML, Knodt AR, Cooke M, Kim MJ, Melzer TR, Keenan R, Ireland D, Ramrakha S, Poulton R, Caspi A, Moffitt TE, Hariri AR. Elliott ML, et al. Neuroimage. 2019 Apr 1;189:516-532. doi: 10.1016/j.neuroimage.2019.01.068. Epub 2019 Jan 29. Neuroimage. 2019. PMID: 30708106 Free PMC article. - The role of task-based neural activation research in understanding cognitive deficits in pediatric epilepsy.
Oyegbile TO. Oyegbile TO. Epilepsy Behav. 2019 Oct;99:106332. doi: 10.1016/j.yebeh.2019.05.028. Epub 2019 Aug 6. Epilepsy Behav. 2019. PMID: 31399340 Review. - Variation in brain aging: A review and perspective on the utility of individualized approaches to the study of functional networks in aging.
Perez DC, Hernandez JJ, Wulfekuhle G, Gratton C. Perez DC, et al. Neurobiol Aging. 2025 Mar;147:68-87. doi: 10.1016/j.neurobiolaging.2024.11.010. Epub 2024 Dec 7. Neurobiol Aging. 2025. PMID: 39709668 Review.
Cited by
- Individual Variability in Brain Connectivity Patterns and Driving-Fatigue Dynamics.
Giannakopoulou O, Kakkos I, Dimitrakopoulos GN, Tarousi M, Sun Y, Bezerianos A, Koutsouris DD, Matsopoulos GK. Giannakopoulou O, et al. Sensors (Basel). 2024 Jun 16;24(12):3894. doi: 10.3390/s24123894. Sensors (Basel). 2024. PMID: 38931678 Free PMC article. - Common functional mechanisms underlying dynamic brain network changes across five general anesthetics: A rat fMRI study.
Chen S, Li B, Hu Y, Zhang Y, Dai W, Zhang X, Zhou Y, Su D. Chen S, et al. CNS Neurosci Ther. 2024 Jul;30(7):e14866. doi: 10.1111/cns.14866. CNS Neurosci Ther. 2024. PMID: 39014472 Free PMC article. - Heritability of hippocampal functional and microstructural organisation.
Bayrak Ş, de Wael RV, Schaare HL, Hettwer MD, Caldairou B, Bernasconi A, Bernasconi N, Bernhardt BC, Valk SL. Bayrak Ş, et al. Neuroimage. 2022 Dec 1;264:119656. doi: 10.1016/j.neuroimage.2022.119656. Epub 2022 Sep 30. Neuroimage. 2022. PMID: 36183945 Free PMC article. - Identifiability of structural networks of nonlinear electronic oscillators.
Vera-Ávila VP, Sevilla-Escoboza R, Goñi J, Rivera-Durón RR, Buldú JM. Vera-Ávila VP, et al. Sci Rep. 2020 Sep 4;10(1):14668. doi: 10.1038/s41598-020-71373-4. Sci Rep. 2020. PMID: 32887920 Free PMC article. - Functional connectivity across the human subcortical auditory system using an autoregressive matrix-Gaussian copula graphical model approach with partial correlations.
Chandra NK, Sitek KR, Chandrasekaran B, Sarkar A. Chandra NK, et al. Imaging Neurosci (Camb). 2024;2:10.1162/imag_a_00258. doi: 10.1162/imag_a_00258. Epub 2024 Aug 12. Imaging Neurosci (Camb). 2024. PMID: 39421593 Free PMC article.
References
- Balota DA, Yap MJ, Cortese MJ, Hutchison KA, Kessler B, Loftis B, Neely JH, Nelson DL, Simpson GB, Treiman R. The English Lexicon Project. Behav Res Methods. 2007;39:445–459. - PubMed
Publication types
MeSH terms
Grants and funding
- K23 NS088590/NS/NINDS NIH HHS/United States
- F30 MH100872/MH/NIMH NIH HHS/United States
- P30 NS098577/NS/NINDS NIH HHS/United States
- F32 NS092290/NS/NINDS NIH HHS/United States
- R25 MH112473/MH/NIMH NIH HHS/United States
- UL1 TR000448/TR/NCATS NIH HHS/United States
- UL1 TR002345/TR/NCATS NIH HHS/United States
- U54 HD087011/HD/NICHD NIH HHS/United States
- K01 MH104592/MH/NIMH NIH HHS/United States
LinkOut - more resources
Full Text Sources
Other Literature Sources
Medical


