Gut Microbiota-Derived Tryptophan Metabolites Modulate Inflammatory Response in Hepatocytes and Macrophages - PubMed (original) (raw)
Gut Microbiota-Derived Tryptophan Metabolites Modulate Inflammatory Response in Hepatocytes and Macrophages
Smitha Krishnan et al. Cell Rep. 2018.
Erratum in
- Gut Microbiota-Derived Tryptophan Metabolites Modulate Inflammatory Response in Hepatocytes and Macrophages.
Krishnan S, Ding Y, Saeidi N, Choi M, Sridharan GV, Sherr DH, Yarmush ML, Alaniz RC, Jayaraman A, Lee K. Krishnan S, et al. Cell Rep. 2019 Sep 17;28(12):3285. doi: 10.1016/j.celrep.2019.08.080. Cell Rep. 2019. PMID: 31533048 Free PMC article. No abstract available.
Abstract
The gut microbiota plays a significant role in the progression of fatty liver disease; however, the mediators and their mechanisms remain to be elucidated. Comparing metabolite profile differences between germ-free and conventionally raised mice against differences between mice fed a low- and high-fat diet (HFD), we identified tryptamine and indole-3-acetate (I3A) as metabolites that depend on the microbiota and are depleted under a HFD. Both metabolites reduced fatty-acid- and LPS-stimulated production of pro-inflammatory cytokines in macrophages and inhibited the migration of cells toward a chemokine, with I3A exhibiting greater potency. In hepatocytes, I3A attenuated inflammatory responses under lipid loading and reduced the expression of fatty acid synthase and sterol regulatory element-binding protein-1c. These effects were abrogated in the presence of an aryl-hydrocarbon receptor (AhR) antagonist, indicating that the effects are AhR dependent. Our results suggest that gut microbiota could influence inflammatory responses in the liver through metabolites engaging host receptors.
Keywords: aryl hydrocarbon receptor; gut microbiota; indole-3-acetate; inflammation; metabolomics; nonalcoholic fatty liver disease.
Copyright © 2018 The Authors. Published by Elsevier Inc. All rights reserved.
Conflict of interest statement
DECLARATION OF INTERESTS
The authors declare no competing interests.
Figures
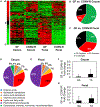
Figure 1.. Results from an Untargeted Analysis of Samples from GF and CONV-R (Female C57BL/6N) Mice
(A) Heatmaps of hierarchically clustered LC-MS/MS features. (B and C) Features from fecal material and cecal contents were separately scaled prior to clustering using the Pareto method. Fraction of detected features that are depleted, elevated, or not significantly different in cecal contents (B) and fecal material (C) between GF and CONV-R mice. (D–G) Putatively identified metabolites that depend on the gut microbiota. Features depleted in cecal contents (D) and fecal material (E) from GF mice were annotated and mapped to metabolic pathways in Kyoto Encyclopedia of Genes and Genomes (KEGG). Statistical tests on fold changes identified several metabolites that are consistently depleted in both fecal material and cecal contents from GF mice. I3A and TA are both significantly reduced in cecal contents (F) and fecal material (G) from GF mice. Data shown are averages of n = 7 mice. Error bars represent 1 SD. *p < 0.05 using Wilcoxon rank-sum test.
Figure 2.. Liver, Cecum, and Serum Samples from LFD- and HFD-Fed CONV-R Mice (Male C57BL/6J) Were Analyzed Using Untargeted LC/MS-MS Experiments
(A) Significantly different features were Pareto scaled and clustered along with features of interest based on annotation of GF and CONV-R samples. (B) TA and I3A were quantified using targeted analysis to confirm depletion of these metabolites in HFD samples. Metabolite levels were normalized to sample weights and plotted as fold changes comparing HFD to LFD. (C) Data shown are averages of n = 5 mice. Error bars represent 1 SD. *p < 0.05. Metabolite selection process based on features differentially present in GF versus CONV-R samples and HFD versus LFD samples. Final selections are suspected AhR ligands.
Figure 3.. Comparison of Free Fatty Acid (FFA) Profiles in HFD and LFD Mice
(A–C) Major FFA species were quantified in liver (A), cecal luminal content (B), and serum (C) samples from HFD- and LFD-fed mice. (D) The same FFAs were quantified in the HFD pellets (D). Data shown are averages of n = 5 mice. Error bars represent 1 SD. *p < 0.05, **p < 0.01, ***p < 0.001, ***p < 0.0005.
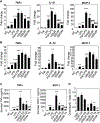
Figure 4.. I3A and TA Reduce Pro-inflammatory Cytokine Production at the mRNA and Protein Levels and Chemotactic Migration in Macrophages Exposed to Palmitate and LPS
(A and B) RAW 264.7 cells were stimulated with palmitic acid (Pal) followed by LPS, with or without addition of varying doses of I3A (A) or TA (B). The negative control (NC) group was only treated with the vehicle, dimethylformamide (DMF). Changes in the expression of TNF-α, IL-1β, and MCP-1were determined using qRT-PCR. (C) Culture supernatants were analyzed for secreted cytokines using a bead-based assay. Data shown are averages of 3 independent experiments with 3 biological replicates. Error bars represent one standard error of the mean. *p < 0.05, **p < 0.01, and ***p < 0.001 compared to NC; #p < 0.05, ##p < 0.01, and ###p < 0.001 compared to Pal+LPS group. (D) I3A and TA inhibit BMDM migration toward MCP-1. BMDMs were incubated with MCP-1 in a transwell with vehicle (DMF) or different doses of I3A or TA. The chemotactic index (CI) for a treatment condition was calculated as the ratio of average number of migrated cells in the treatment group relative to the control group (incubated in medium only). Data shown are averages of three independent experiments with three biological replicates. Error bars represent 1 SEM. *p < 0.05, **p < 0.01, and ***p < 0.001.
Figure 5.. Micrographs of AML12 Hepatocytes Obtained Using CARS Microscopy
(A–C) Micrographs were recorded after the cells had been treated with either (A) vehicle or (B and C) FFAs (500 μM palmitate + 500 μM oleate) for 48 hr. (C) A close-up of (B). All images are composites of forward- (green) and epi-CARS (red) signals. Lipid inclusion bodies are primarily detected by the stronger forward signal.
Figure 6.. I3A Attenuates the Effects of TNF-a in Cultured AML12 Cells Preconditioned with FFAs
(A–C) Palmitic (A), oleic (B), and stearic acids (C) were quantified using targeted LC-MS/MS experiments. (D) CA and CDCA were quantified and represented as a percentage of the contribution to the combined pool of primary bile acids. Data shown are averages of 4 independent experiments with 6 biological replicates. Error bars represent 1 SD. *p < 0.05, **p < 0.01, ***p < 0.001 compared to cells in the negative control group exposed to vehicle (DMSO) only; yp < 0.05 compared to the FFA group that was not treated with TNF-a; zp < 0.05 compared to the TNF group that was not preconditioned with FFAs; #p < 0.05 compared to the FFA+TNF group that was pre-conditioned with FFAs and treated with TNF-a.
Figure 7.. I3A Attenuates the Effects of TNF-a on AhR and Its Target Genes in Cultured AML12 Cells Preconditioned with FAs
(A and B) Gene expression (A) and relative abundance of Fasn protein (B). (C) Gene expression of SREBP-1c. (D) AhR activation by different doses of I3A, TA, and IS. FICZ and DMSO were used as positive and negative controls (NC), respectively. ***p < 0.005, ****p < 0.001 compared to NC. (E) Gene expression of AhR. Data shown are averages of 4 independent experiments with six biological replicates. Error bars represent 1 SD. *p < 0.05, **p < 0.01, and ***p < 0.001 compared to NC; †p < 0.05 compared to FA group, ‡p < 0.05 compared to TNF group; #p < 0.05 compared to FA+TNF group. (F and G) Palmitic (F) and oleic acids (G) in cultures treated with AhR antagonist CH-223191. *p < 0.05 compared to corresponding culture without CH-223191.
Similar articles
- Ferulic acid ameliorates nonalcoholic fatty liver disease and modulates the gut microbiota composition in high-fat diet fed ApoE-/- mice.
Ma Y, Chen K, Lv L, Wu S, Guo Z. Ma Y, et al. Biomed Pharmacother. 2019 May;113:108753. doi: 10.1016/j.biopha.2019.108753. Epub 2019 Mar 9. Biomed Pharmacother. 2019. PMID: 30856537 - Oral supplementation of gut microbial metabolite indole-3-acetate alleviates diet-induced steatosis and inflammation in mice.
Ding Y, Yanagi K, Yang F, Callaway E, Cheng C, Hensel ME, Menon R, Alaniz RC, Lee K, Jayaraman A. Ding Y, et al. Elife. 2024 Feb 27;12:RP87458. doi: 10.7554/eLife.87458. Elife. 2024. PMID: 38412016 Free PMC article. - Activation of aryl hydrocarbon receptor (AhR) in Alzheimer's disease: role of tryptophan metabolites generated by gut host-microbiota.
Salminen A. Salminen A. J Mol Med (Berl). 2023 Mar;101(3):201-222. doi: 10.1007/s00109-023-02289-5. Epub 2023 Feb 9. J Mol Med (Berl). 2023. PMID: 36757399 Free PMC article. Review. - The aryl hydrocarbon receptor as a mediator of host-microbiota interplay.
Dong F, Perdew GH. Dong F, et al. Gut Microbes. 2020 Nov 9;12(1):1859812. doi: 10.1080/19490976.2020.1859812. Epub 2020 Dec 17. Gut Microbes. 2020. PMID: 33382356 Free PMC article. Review.
Cited by
- Metabolic-associated fatty liver disease: a selective review of pathogenesis, diagnostic approaches, and therapeutic strategies.
Habibullah M, Jemmieh K, Ouda A, Haider MZ, Malki MI, Elzouki AN. Habibullah M, et al. Front Med (Lausanne). 2024 Jan 23;11:1291501. doi: 10.3389/fmed.2024.1291501. eCollection 2024. Front Med (Lausanne). 2024. PMID: 38323033 Free PMC article. Review. - Vascularized Hepatocellular Carcinoma on a Chip to Control Chemoresistance through Cirrhosis, Inflammation and Metabolic Activity.
Özkan A, Stolley DL, Cressman ENK, McMillin M, Yankeelov TE, Rylander MN. Özkan A, et al. Small Struct. 2023 Sep;4(9):2200403. doi: 10.1002/sstr.202200403. Epub 2023 Feb 17. Small Struct. 2023. PMID: 38073766 Free PMC article. - The role of gut microbiota in liver regeneration.
Xu Z, Jiang N, Xiao Y, Yuan K, Wang Z. Xu Z, et al. Front Immunol. 2022 Oct 27;13:1003376. doi: 10.3389/fimmu.2022.1003376. eCollection 2022. Front Immunol. 2022. PMID: 36389782 Free PMC article. Review. - Aryl Hydrocarbon Receptor (AHR) Ligands as Selective AHR Modulators (SAhRMs).
Safe S, Jin UH, Park H, Chapkin RS, Jayaraman A. Safe S, et al. Int J Mol Sci. 2020 Sep 11;21(18):6654. doi: 10.3390/ijms21186654. Int J Mol Sci. 2020. PMID: 32932962 Free PMC article. Review. - Gut microbial response to host metabolic phenotypes.
Hou J, Xiang J, Li D, Liu X, Pan W. Hou J, et al. Front Nutr. 2022 Nov 7;9:1019430. doi: 10.3389/fnut.2022.1019430. eCollection 2022. Front Nutr. 2022. PMID: 36419554 Free PMC article. Review.
References
- Aranha MM, Cortez-Pinto H, Costa A, da Silva IB, Camilo ME, de Moura MC, and Rodrigues CM (2008). Bile acid levels are increased in the liver of patients with steatohepatitis. Eur. J. Gastroenterol. Hepatol 20, 519–525. - PubMed
- Baeck C, Wehr A, Karlmark KR, Heymann F, Vucur M, Gassler N, Huss S, Klussmann S, Eulberg D, Luedde T, et al. (2012). Pharmacological inhibition of the chemokine CCL2 (MCP-1) diminishes liver macrophage infiltration and steatohepatitis in chronic hepatic injury. Gut 61, 416–426. - PubMed
Publication types
MeSH terms
Substances
LinkOut - more resources
Full Text Sources
Other Literature Sources


