Antagonizing peroxisome proliferator-activated receptor γ facilitates M1-to-M2 shift of microglia by enhancing autophagy via the LKB1-AMPK signaling pathway - PubMed (original) (raw)
Antagonizing peroxisome proliferator-activated receptor γ facilitates M1-to-M2 shift of microglia by enhancing autophagy via the LKB1-AMPK signaling pathway
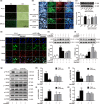
Juan Ji et al. Aging Cell. 2018 Aug.
Abstract
Microglia-mediated neuroinflammation plays a dual role in various brain diseases due to distinct microglial phenotypes, including deleterious M1 and neuroprotective M2. There is growing evidence that the peroxisome proliferator-activated receptor γ (PPARγ) agonist rosiglitazone prevents lipopolysaccharide (LPS)-induced microglial activation. Here, we observed that antagonizing PPARγ promoted LPS-stimulated changes in polarization from the M1 to the M2 phenotype in primary microglia. PPARγ antagonist T0070907 increased the expression of M2 markers, including CD206, IL-4, IGF-1, TGF-β1, TGF-β2, TGF-β3, G-CSF, and GM-CSF, and reduced the expression of M1 markers, such as CD86, Cox-2, iNOS, IL-1β, IL-6, TNF-α, IFN-γ, and CCL2, thereby inhibiting NFκB-IKKβ activation. Moreover, antagonizing PPARγ promoted microglial autophagy, as indicated by the downregulation of P62 and the upregulation of Beclin1, Atg5, and LC3-II/LC3-I, thereby enhancing the formation of autophagosomes and their degradation by lysosomes in microglia. Furthermore, we found that an increase in LKB1-STRAD-MO25 complex formation enhances autophagy. The LKB1 inhibitor radicicol or knocking down LKB1 prevented autophagy improvement and the M1-to-M2 phenotype shift by T0070907. Simultaneously, we found that knocking down PPARγ in BV2 microglial cells also activated LKB1-AMPK signaling and inhibited NFκB-IKKβ activation, which are similar to the effects of antagonizing PPARγ. Taken together, our findings demonstrate that antagonizing PPARγ promotes the M1-to-M2 phenotypic shift in LPS-induced microglia, which might be due to improved autophagy via the activation of the LKB1-AMPK signaling pathway.
Keywords: autophagy; liver kinase B1; microglial polarization; peroxisome proliferator-activated receptor γ.
© 2018 The Authors. Aging Cell published by the Anatomical Society and John Wiley & Sons Ltd.
Figures
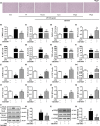
Figure 1
Antagonizing
PPAR
γ prevents
LPS
‐induced M1 microglial activation and facilitates microglial polarization to the M2 phenotype. Microglia were pretreated 15 min with
LPS
(0.01 μg/
ml
) and then incubated with
PPAR
γ antagonist T0070907 (0.1 μ
m
) for 24 hr. (a) The
PPAR
γ antagonist T0070907 suppressed the amoeboid “activated” morphology of microglia induced by
LPS
. The
PPAR
γ antagonist T0070907 reversed
LPS
‐induced
mRNA
expressions of M1 markers (
CD
86, Cox‐2,
iNOS
,
IFN
‐γ,
IL
‐1β,
TNF
‐α, and
CCL
- (b–i) and
mRNA
expressions of M2 markers (
CD
206,
IL
‐4, G‐
CSF
,
GM
‐
CSF
,
IGF
‐1,
TGF
‐β1,
TGF
‐β2, and
TGF
‐β3) in microglial cells (j–q). The ratios of p‐
NF
κB to
NF
κB (r, s) and p‐
IKK
β to
IKK
β (t, u) in microglial cells were determined by Western blotting. Data are presented as mean ±
SEM
, n ≥ 4, *p < .05, **p < .01, ***p < .001, compared to the Con group; # p < .05, ## p < .01, ### p < .001, compared to the LPS group
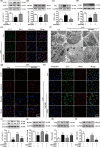
Figure 2
The
PPAR
γ antagonist T0070907 improves autophagy in microglia. (a–d) The
PPAR
γ antagonist T0070907 prevented
LPS
‐induced decreases in
LC
3‐
II
/
LC
3‐I, Beclin1, and Atg5 and
LPS
‐induced increases in P62. Data are presented as mean ±
SEM
, n ≥ 4, *p < .05, **p < .01, compared to the Con group; # p < .05, ## p < .01, compared to the
LPS
group. (e) Representative confocal images of
LC
3 puncta formation;
LC
3 (green) was colocalized with Iba1 (red) in cells treated with the
PPAR
γ antagonist T0070907 and
LPS
. Nuclei counterstained with Hoechst 33342. Scale bar = 20 μm. (f) Representative
TEM
images. Scale bar = 2 μm. High magnification of the boxed areas is shown below. Scale bar = 500 nm. Autophagosomes (blue arrows), autolysosomes (red arrows), and multilamellar body (yellow arrow). (g) Confocal microscopy analysis was used to measure autophagosomes and autolysosomes by monitoring the distribution and alteration of
mC
herry and
EGFP
fluorescent signals from
mC
herry‐
EGFP
‐
LC
3B. Scale bar = 20 μm. Microglia were pretreated with 3‐
MA
(500 μ
m
) or vehicle for 15 min, followed by treatment with 0.01 μg/
ml LPS
and 0.1 μ
m PPAR
γ antagonist T0070907 for 24 hr. (h) Immunofluorescence staining of
LC
3 (green),
CD
63 (red), and nuclei (blue) in
LPS
,
LPS
+T0070907, and
LPS
+T0070907 + 3‐
MA
groups. Scale bar = 20 μm. The protein expressions of
LC
3 (i), Beclin1 (j), p62 (k), and Atg (l) were determined by Western blotting. Data are presented as mean ±
SEM
, n ≥ 4, *p < .05, **p < .01, ***p < .001, compared to the Con group; # p < .05, ## p < .01, ### p < .001, compared to the
LPS
group; † p < .05, †† p < .01, ††† p < .001, compared to the
LPS
+T0070907 group
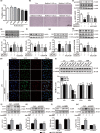
Figure 3
Antagonizing
PPAR
γ reverses
LPS
‐mediated inhibition of autophagy in microglial cells by activating
AMPK
. Microglial cells were pretreated with 0.01 μg/
ml LPS
, followed by treatment with 0.1 μ
m PPAR
γ antagonist T0070907 for 24 hr. The upstream regulatory protein levels of autophagy,
AMPK
(a, b),
ULK
1 (a, c), and
mTOR
(a, d) were analyzed by Western blotting. Data are presented as mean ±
SEM
, n ≥ 4, *p < .05, **p < .01, ***p < .001, compared to the Con group; # p < .05, ## p < .01, ### p < .001, compared to the
LPS
group; † p < .05, †† p < .01, ††† p < .001, compared to the
LPS
+T0070907 group. (e–h) The
PPAR
γ antagonist T0070907 increased the phosphorylation of
LKB
1, but it did not change the phosphorylation of Ca
MKK
β and
TAK
1 in the microglial cells treated with
LPS
. (i) An anti‐
LKB
1 antibody was used for Dynabeads Protein G immunoprecipitation, and it detected the immunoprecipitates of
MO
25 and
STRAD
by Western blotting. (j) An anti‐
MO
25 antibody was used for Dynabeads Protein G immunoprecipitation, and it detected the immunoprecipitates of
LKB
1 and
STRAD
by Western blotting
Figure 4
Phosphorylation of
LKB
1–
AMPK
is necessary for T0070907‐mediated upregulation of autophagy. (a, b) Below the concentration of 0.05 μ
m
, radicicol did not influence the viability of the microglia**.** After
LPS
stimulation for 15 min, the
LKB
1 inhibitor radicicol (0.025 and 0.05 μ
m
) was applied for 15 min before treatment with
PPAR
γ antagonist T0070907 for 24 hr. (c–g) Radicicol turned over the protein expressions of
LKB
1,
AMPK
,
LC
3, Beclin1, and p62 in the microglia treated with
LPS
and T0070907. Data are presented as mean ±
SEM
, n ≥ 4, *p < .05, **p < .01, ***p < .001, compared to the Con group; # p < .05, ## p < .01, ### p < .001, compared to the
LPS
group; † p < .05, †† p < .01, compared to the
LPS
+T0070907 group. (h) Immunofluorescence staining with of
LC
3 (green),
CD
63 (red), and nuclei (blue) in the
LPS
,
LPS
+T0070907, and
LPS
+T0070907 + radicicol groups. Scale bar = 20 μm. (i) Quantitation of Western blotting data showing declines in
LKB
1, which was used to observe the efficiency of transfection. Microglia were pretreated with si‐
LKB
1 (500 n
m
) or vehicle for 24 hr and then stimulated with
LPS
for 15 min and treated with
PPAR
γ antagonist T0070907 for 24 hr.
LKB
1 si
RNA
prevented T0070907‐induced increases in
LC
3‐
II
/
LC
3‐I (j), Beclin1 (k), and Atg5 (m) and T0070907‐induced decreases in P62 (l). Data are presented as mean ±
SEM
, n ≥ 4, **p < .01, ***p < .001 compared to the
LPS
group in the Ctrl; ## p < .01, ### p < .001, compared to the
LPS
+T0070907 group in the Ctrl
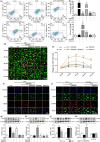
Figure 5
Blocking
LKB
1 reverses the T0070907‐mediated transition between M1 and M2 phenotypes by suppressing
NF
κB. After
LPS
stimulation for 15 min, the
LKB
1 inhibitor radicicol (0.025 and 0.05 μ
m
) was applied 15 min before treatment with
PPAR
γ antagonist T0070907 for 24 hr. (a) Fluorescence‐activated cell sorting analysis of the microglia in the
LPS
,
LPS
+T0070907, and
LPS
+T0070907 + radicicol groups. Surface expression of
CD
86 and
CD
206 was detected in microglia by flow cytometry. The percentage of
CD
86 (b) and
CD
206 (c) cells in the microglia was determined.
pH
rodo™ Green Zymosan BioParticles were added to the cells and imaged after 30, 60, 90, 120, and 150 min. The green staining in the microglial cells was due to Cell Tracker™ Green. (d) The microglial cells showed the time course of red fluorescence increased, documenting the accumulation of
pH
rodo‐conjugated zymosan bioparticles (1 μm in diameter) in the intracellular acidic environment corresponding to phagosomes. (e) The proportion between the red‐stained cells and the total cells was calculated. Data are presented as mean ±
SEM
, n = 3, ### p < .001 compared to the
LPS
group in each time point; † p < .05, ††† p < .001, compared to the
LPS
+T0070907 group in each time point. Nonfluorescence appeared at a neutral
pH
outside of the cell. Scale bar = 20 μm. Radicicol (f) and knocking down
LKB
1 (i) reversed the
PPAR
γ antagonist T0070907‐induced changes in the protein expression of the M1 markers (
iNOS
, green) and the M2 markers (
CD
206, red) by immunofluorescence staining. Scale bar = 20 μm. (g, h) Western blotting showed that radicicol prevented the decreases in
iNOS
and the increases in
CD
206 induced by T0070907. Data are presented as mean ±
SEM
, n = 4, ***p < .001, compared to the Con group; ## p < .01, ### p < .001, compared to the
LPS
group; † p < .05, ††† p < .001, compared to the
LPS
+T0070907 group. (j and k) Knocking down
LKB
reversed the
PPAR
γ antagonist T0070907‐induced changes in the protein expressions of
iNOS
and
CD
206 by Western blotting. Data are presented as mean ±
SEM
, n = 4, ***p < .001, compared to Con group, respectively in Ctrl or in si‐
LKB
1; ### p < .001, compared to
LPS
group, respectively in Ctrl or in si‐LKB1
Figure 6
Knocking down
PPAR
γ reduces the inflammatory response by promoting
LKB
–
AMPK
activation. (a) Labeled (FM) with green were used to observe the efficiency of transfection reagent in BV2 cells. Scale bar = 1,000 μm. (b) Images of dissociated microglial cells exposed to scrambled (Con, top panels) or
PPAR
γ si
RNA
, and labeled with antibodies to Iba1 (red) and
PPAR
γ (green), and colabeled with a nuclear stain (blue). Scale bar = 100 μm. (c) Quantitation of Western blotting data showing declines in
PPAR
γ. Statistical analysis was performed using one‐way
ANOVA
followed by Bonferroni's post hoc test. Data are presented as mean ±
SEM
, n = 5, p < .01 compared to the
NC
group. Microglia were pretreated with si‐
PPAR
γ (500 n
m
) or vehicle for 24 hr and then stimulated with
LPS
for 15 min and treated with
PPAR
γ antagonist T0070907 for 24 hr. (d)
PPAR
γ antagonist T0070907 did not influence
PPAR
γ si
RNA
‐mediated protein expressions of the M1 marker (
iNOS
, green) and the M2 marker (
CD
206, red). Scale bar = 20 μm. The experiment was repeated three times. (e, f) Western blotting was used to quantify the expressions of
iNOS
and
CD
206 in each group. Data are presented as mean ±
SEM
, n = 4, *p < .05, ***p < .001, compared to the Con group, respectively in Ctrl or in si‐
PPAR
γ; ### p < .001, compared to the
LPS
group, respectively in Ctrl in Ctrl or in si‐
PPAR
γ.
PPAR
γ si
RNA
inhibited the activation of
NF
κB and
IKK
β (e, f, and g).
PPAR
γ si
RNA
was also associated with a rise in p‐
LKB
1 (e, h) and p‐
AMPK
(e, i). The
PPAR
γ antagonist T0070907 did not affect the efficacy of
PPAR
γ si
RNA
. Data are presented as mean ±
SEM
, n ≥ 5, **p < .01, ***p < .001, compared to the
LPS
group in the control
Similar articles
- Curcumin Prevents Neuroinflammation by Inducing Microglia to Transform into the M2-phenotype via CaMKKβ-dependent Activation of the AMP-Activated Protein Kinase Signal Pathway.
Qiao P, Ma J, Wang Y, Huang Z, Zou Q, Cai Z, Tang Y. Qiao P, et al. Curr Alzheimer Res. 2020;17(8):735-752. doi: 10.2174/1567205017666201111120919. Curr Alzheimer Res. 2020. PMID: 33176649 - Isovitexin-Mediated Regulation of Microglial Polarization in Lipopolysaccharide-Induced Neuroinflammation via Activation of the CaMKKβ/AMPK-PGC-1α Signaling Axis.
Liu B, Huang B, Hu G, He D, Li Y, Ran X, Du J, Fu S, Liu D. Liu B, et al. Front Immunol. 2019 Nov 14;10:2650. doi: 10.3389/fimmu.2019.02650. eCollection 2019. Front Immunol. 2019. PMID: 31798583 Free PMC article. - Telmisartan prevention of LPS-induced microglia activation involves M2 microglia polarization via CaMKKβ-dependent AMPK activation.
Xu Y, Xu Y, Wang Y, Wang Y, He L, Jiang Z, Huang Z, Liao H, Li J, Saavedra JM, Zhang L, Pang T. Xu Y, et al. Brain Behav Immun. 2015 Nov;50:298-313. doi: 10.1016/j.bbi.2015.07.015. Epub 2015 Jul 16. Brain Behav Immun. 2015. PMID: 26188187 - Microglia polarization in nociplastic pain: mechanisms and perspectives.
Atta AA, Ibrahim WW, Mohamed AF, Abdelkader NF. Atta AA, et al. Inflammopharmacology. 2023 Jun;31(3):1053-1067. doi: 10.1007/s10787-023-01216-x. Epub 2023 Apr 17. Inflammopharmacology. 2023. PMID: 37069462 Free PMC article. Review. - PPAR-gamma agonists: Potential modulators of autophagy in obesity.
Faghfouri AH, Khajebishak Y, Payahoo L, Faghfuri E, Alivand M. Faghfouri AH, et al. Eur J Pharmacol. 2021 Dec 5;912:174562. doi: 10.1016/j.ejphar.2021.174562. Epub 2021 Oct 13. Eur J Pharmacol. 2021. PMID: 34655597 Review.
Cited by
- The Effects of Rosiglitazone on Task Specific Anxiety-Like Behavior and Novelty Seeking in a Model of Chronic Adolescent Unpredictable Stress.
Sexton HG, Olszewski NA, Risher ML. Sexton HG, et al. Front Behav Neurosci. 2022 Feb 11;16:830310. doi: 10.3389/fnbeh.2022.830310. eCollection 2022. Front Behav Neurosci. 2022. PMID: 35221947 Free PMC article. - Colony stimulating factors in the nervous system.
Chitu V, Biundo F, Stanley ER. Chitu V, et al. Semin Immunol. 2021 Apr;54:101511. doi: 10.1016/j.smim.2021.101511. Epub 2021 Nov 4. Semin Immunol. 2021. PMID: 34743926 Free PMC article. Review. - Studying Autophagy in Microglia: Overcoming the Obstacles.
Plaza-Zabala A, Sierra A. Plaza-Zabala A, et al. Methods Mol Biol. 2024;2713:45-70. doi: 10.1007/978-1-0716-3437-0_3. Methods Mol Biol. 2024. PMID: 37639114 - Autophagy in Neuroinflammation: A Focus on Epigenetic Regulation.
Chen Y, Chen J, Xing Z, Peng C, Li D. Chen Y, et al. Aging Dis. 2024 Apr 1;15(2):739-754. doi: 10.14336/AD.2023.0718-1. Aging Dis. 2024. PMID: 37548945 Free PMC article. Review. - Oroxin A alleviates early brain injury after subarachnoid hemorrhage by regulating ferroptosis and neuroinflammation.
Chen J, Shi Z, Zhang C, Xiong K, Zhao W, Wang Y. Chen J, et al. J Neuroinflammation. 2024 May 3;21(1):116. doi: 10.1186/s12974-024-03099-3. J Neuroinflammation. 2024. PMID: 38702778 Free PMC article.
References
Publication types
MeSH terms
Substances
Grants and funding
- 81473197/National Natural Science Foundation of China/International
- 81773701/National Natural Science Foundation of China/International
- 81273495/National Natural Science Foundation of China/International
- BE2017737/Jiangsu Key Research and Development Program/International
- BRA2017469/The 333 high-level talents project of Jiangsu Province/International
- 172436/China Postdoctoral Science Foundation/International
- KYCX17_1271/Postgraduate Research & Practice Innovation Program of Jiangsu Province/International
LinkOut - more resources
Full Text Sources
Other Literature Sources
Research Materials
Miscellaneous
