Acid Suspends the Circadian Clock in Hypoxia through Inhibition of mTOR - PubMed (original) (raw)
. 2018 Jun 28;174(1):72-87.e32.
doi: 10.1016/j.cell.2018.05.009. Epub 2018 May 31.
Chirag H Patel 2, Rebekah C Brooks 3, Yongjun Yu 3, Arig Ibrahim-Hashim 4, Malini Riddle 5, Alessandra Porcu 5, Tianying Jiang 6, Brett L Ecker 7, Feven Tameire 8, Constantinos Koumenis 8, Ashani T Weeraratna 6, David K Welsh 5, Robert Gillies 4, James C Alwine 3, Lin Zhang 9, Jonathan D Powell 2, Chi V Dang 10
Affiliations
- PMID: 29861175
- PMCID: PMC6398937
- DOI: 10.1016/j.cell.2018.05.009
Acid Suspends the Circadian Clock in Hypoxia through Inhibition of mTOR
Zandra E Walton et al. Cell. 2018.
Abstract
Recent reports indicate that hypoxia influences the circadian clock through the transcriptional activities of hypoxia-inducible factors (HIFs) at clock genes. Unexpectedly, we uncover a profound disruption of the circadian clock and diurnal transcriptome when hypoxic cells are permitted to acidify to recapitulate the tumor microenvironment. Buffering against acidification or inhibiting lactic acid production fully rescues circadian oscillation. Acidification of several human and murine cell lines, as well as primary murine T cells, suppresses mechanistic target of rapamycin complex 1 (mTORC1) signaling, a key regulator of translation in response to metabolic status. We find that acid drives peripheral redistribution of normally perinuclear lysosomes away from perinuclear RHEB, thereby inhibiting the activity of lysosome-bound mTOR. Restoring mTORC1 signaling and the translation it governs rescues clock oscillation. Our findings thus reveal a model in which acid produced during the cellular metabolic response to hypoxia suppresses the circadian clock through diminished translation of clock constituents.
Keywords: RHEB; acidity; cancer; circadian; clock; hypoxia; hypoxia-inducible factor; lysosome; mTOR; pH.
Copyright © 2018 Elsevier Inc. All rights reserved.
Conflict of interest statement
Declaration of Interests:
The authors declare no competing interests.
Figures
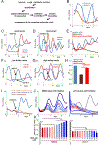
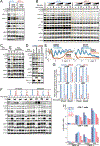
Figure 1 -. Hypoxic metabolism suspends the circadian clock through generation of acid.
A. Graphical summary. B. Lysate luciferase activity (relative light units (RLU) per second) of U2OS_Arntl::_dLUC cells in normoxia or hypoxia (1% O2). RE of 2, 1–3 BR each. C. Luminescence of U2OS Arntl::dLUC cells treated with 750 uM DMOG or vehicle. DMOG washout at 4 d. RE of >5. D.Per_2::dLUC as in C with 1 mM DMOG. Vehicle/DMOG washout at 7 d. RE of 2, 1–3 BR. E. Luminescence of U2OS_Arntl::dLUC cells treated with control siRNA (siCtl) or siRNA against HIFα subunits prior to 750 uM DMOG. Mean of 3 BR. RE of 3.F./G. Luminescence of U2OS Arntl::dLUC cells treated with 1 mM DMOG or vehicle in low (F) or high (G) buffer media. Mean of 2 BR. RE of >5. Mean media pH after 1.5 d of 2 parallel BR (standard error of the mean (SEM) <0.05). **H**. Media pH after siRNA and 4 d DMOG treatment in low buffer media as in E. Mean of 2 BR ± SEM. T-test (unpaired, 2-tailed, unequal variances) *p≤0.05. I. Luminescence of U2OS_Arntl_::dLUC cells in triplicate in pH 6.3 media. Media of two plates exchanged for pH 7.5 (washout) or 6.3 (mock washout) media after 1.5 d. RE of >3. J./K. Luminescence (J) and media pH after 2 d (K) of U2OS Arntl::dLUC cells treated with vehicle or 750 uM DMOG (left) or pH 7.4 or pH 6.3 media (right) and the indicated concentration of GNE- 140 (color-coded as K). Mean of 2 BR (± SEM in K). One-way ANOVA/post-hoc Dunnett’s **p≤0.01, ****p≤0.0001, ns = p>0.05. RE of 3. All cells B-K synchronized (see Methods). d = days. h = hours. RE = representative experiment. BR = biological replicates. See also Figure S1.
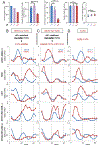
Figure 2 -. Acidification is both necessary and sufficient to disrupt the clock network.
A. Rhythmicity, amplitude, period, and phase as a function of media pH determined by singlecell luminescence imaging of U2OS_Arntl_::dLUC cells. Mean ± SEM of ≥ 25 analyzed cells (13–25 rhythmic) each pH. One-way ANOVA/post-hoc Dunnett’s *p<0.05, ***p<0.001, ns=p>0.05.B-D. Expression (qPCR) of endogenous core clock components in synchronized U2OS _Arntl::_dLUC cells treated with 1 mM DMOG or vehicle in low (B) or high (C) buffer media or with pH 7.4 or 6.3 media (D). See also Figure S2.
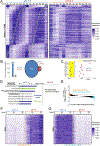
Figure 3 -. The normally circadian transcriptome ceases oscillation in acid.
A. Expression (normalized fragments per kilobase of transcript per million (FPKM) mapped reads) of the 1206 proteincoding genes circadian in pH 7.4 (p<0.05, false discovery rate (FDR) <0.2) every 4 h for 52 h in synchronized U2OS _Arntl_::dLUC cells treated with pH 7.4 and 6.3 media. Ordered by pH 7.4 phase. Green lines highlight circadian periodicity. **B**. Number of protein-coding genes with significant (defined as in A) circadian oscillation in pH 7.4, 6.3, or both. **C**. FDR statistic of test for circadian rhythmicity for representative clock network genes and output regulators in pH 7.4 or 6.3.**D**. Pathway ontologies significantly enriched (B&Y q <0.05) among circadian transcripts in B. P=PantherDB, R=Reactome, K=KEGG. p<0.05 above dashed line. **E**. Acid-induced and acid-suppressed transcripts defined as Log2 of the ratio of average expression over all 13 time points in pH 6.3 to pH 7.4 >1 or < −1. F/G. Expression in pH 7.4 and 6.3 of the 571 acid-induced (F) and 859 acid-suppressed transcripts (G) defined in E. See also Tables S1–6 and Figure S3.
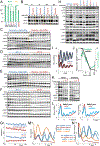
Figure 4 -. Acid suspends the circadian clock through inhibition of mTORC1.
A. mCherry-SEpHluorin-derived intracellular pH (pHi) of U2OS cells treated for 24 h with the indicated pH media or with 500 uM DMOG in low buffer media. Extracellular pH (pHe) at 33 h. Mean pHi ± standard deviation (SD) based on ≥3 10× fields per condition (see Figures S4A-C). T-tests (unpaired, 2-tailed, unequal variances) of pHi ****p≤0.0001, ***p≤0.001, **p≤0.01. RE of 2–3 per condition.B. Timecourse immunoblots of core clock proteins in U2OS cells in normoxic high buffer or hypoxic (1% O2) low or high buffer conditions. C/D. Timecourse immunoblots for HIFIα and clock proteins in U2OS cells in normoxic high buffer or hypoxic (1% O2) low buffer conditions (C) or in pH 7.4 or 6.5 media (D). **E/F.**Immunoblots of lysate collected in C (E) and D (F) for phosphorylated sites (Ser2448 (mTOR), Thr389 (S6K), Ser235/236(S6), Thr37/46(4EBP1)) or total levels of mTORC1 substrates and downstream signaling components. Tubulin shared by E, C. G. Media pH over the 48 h in C-F. H. Immunoblots for core clock proteins and mTORC1 signaling in U2OS cells in normoxia or hypoxia (1% O2) or treated with vehicle or 300 uM DMOG in low or high buffer conditions or in media of pH 7.4 or 6.3 for 8 h. I. Luminescence of U2OS_Arntl_::dLUC cells treated with vehicle or 100 nM Torin1. Mean±SEM of 3 BR. RE of 2. J. Normalized ratio of the intensities of p4EBP1 to total 4EBP1 at 27 h (quantified from K) and the mean±SEM Arntl::dLUC amplitude over 4 days (see Methods) as functions of Torin1 dose. Y-axis scaled log([Torin]+1). K. Immunoblot for mTORC1 signaling in U2OS cells after 1 and 27 h of treatment with vehicle or 1–1000 nM Torin1. Unrelated intervening lanes cropped.L. Luminescence of U2OS Arntl::dLUC cells treated with 10 nM control (siCtl) siRNA or siRNA against_EIF4EBP1_ or EIF4EBP2 prior to 300 uM DMOG in low buffer media. Mean of 2 BR. RE of 2. M/N. Luminescence of U2OS Arntl::dLUC EIF4EBP1 CRISPR knockout (4EBP1 −/−) and editing control clonal lines treated with vehicle or 500 uM DMOG in low buffer conditions (M) or pH 7.4 or 6.3 media (N). Mean of 2–3 BR. RE of ≥3. Black rectangles enclose immunoblots from same gel. Yellow lines for readability only. All cells synchronized except A, K. Hypoxic medias pre-deoxygenated. RE = representative experiment. BR = biological replicates. See also Figure S4.
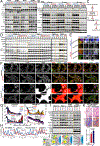
Figure 5 -. Acid inhibits mTORC1 and the clock in an RAG-independent manner not fully rescuable by TSC2 loss.
A./B. mTORC1 signaling in U2OS cells unstarved or starved of serum for 50 minutes in pH 7.4 or 6.3 media and then rescued or not for 10 minutes with serum (A), or likewise starved of leucine, arginine, or lysine and rescued with approximately twice the amino acid sensor Km (Wolfson and Sabatini, 2017) or full DMEM level (B).C. mTORC1 signaling in RAP2A- or RAGBQ99L-expressing U2OS_Arntl_::dLUC cells after 1 h of deprivation of amino acids (AA) or leucine (L) or incubation in replete media. D. Immunoblots of lysate from cell lines in panel C, 23 h after synchronization and treatment with vehicle or 500 uM DMOG in low buffer media. E._Arntl::dLUC luminescence in parallel to D. Mean of 3 BR.F. Immunoblots for HIFIα, mTORCI signaling, and BMAL1 in_Arntl::dLUC TSC2 CRISPR knockout (--) or parental Arntl::dLUC U2OS cells (++) following treatment with vehicle or 500 uM DMOG in low buffer media or with pH 7.4 or 6.3 media for 17 and 24 h. RE of 2.G. Quantification of F. Ratio of the intensity of pS6K or pS6 to total S6K or S6, respectively. Each control-treatment pair normalized to respective control (vehicle, pH 7.4). H. Mean fluorescence intensity (MFI) of pS6 staining of wildtype (+/+) and TSC2 knockout (−/−) CD4+ and CD8+ T cells assessed by flow cytometry after TCR stimulation for 1 h in media of the indicated pH. RE of 5 each with 1–4 BR. RE=representative experiment, BR=biological replicates. See also Figure S5.
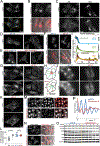
Figure 6 -. Acid-induced peripheral redistribution of lysosomes silences signaling of lysosome-localized mTORC1.
A. U2OS cells immunostained for lysosomal protein LAMP2. Nuclei and cytoplasm outlined in lower panel. B. Live imaging of U2OS cells with lysosomes labeled with LysoTracker. Lower panel merged with phase-contrast image. C. U2OS cells immunostained for LAMP2 and mTOR after amino acid starvation for 115 min and rescue (+AA) or not (-AA) for 25 min. D./E. U2OS cells immunostained for LAMP2 after in media of pH 7.4 or 6.3 for 2.25 h (D) or pH 6.3 for 105 min followed by media pH 7.4 (rescue, left) or 6.3 (mock rescue, right two fields) for 25 min (E).F. Live imaging of U2OS cells expressing LAMP1-mRFP in pH 7.4 or 6.3 media for 4 h. Lower panels: merged mRFP and phase-contrast images.G. U2OS cells immunostained for LAMP2 and α-tubulin after in pH 7.4 or 6.3 media for 2.25 h. H. Model: the perinuclear aggregate of lysosomes disperses peripherally upon acidification.I. Mean intensity of DAPI (nuclear), a-tubulin, and LAMP2 staining as a function of distance from the nucleus center (i.e. radial coordinate) after 2.75 h in pH 7.4 or 6.3 media. (See Figure S6E.) n=15 cells each pH. Mean±SEM normalized to each channel’s maximum. T-test of pH (unpaired, 2-tailed, equal variance) unadjusted p<0.05 (*) at 0, 2, and 117 of 228 data points, respectively. **J./K.** U2OS cells immunostained for LAMP2 and mTOR after amino acid starvation for 130 min in pH 7.4 or 6.3 media and restimulation with amino acids for 10 min in the same pH (J) or after incubation in pH 6.3 media for 2 h with media change (same pH) 15 min prior to processing (K). **L**. Quantification of mTOR lysosomal enrichment in U2OS cells immunostained for LAMP2 and mTOR after amino acid starvation for 155 min and rescue (+AA) or not (-AA) for 8 min or in pH 7.4 or 6.3 media for 165 min. n =11 fields (≥86 cells) per condition. Mean±SEM superimposed with raw data. T-tests (unpaired, 2-tailed) ****p<0.0001, ns = p>0.05. RE of 3. M. Live imaging of U2OS cells treated with vehicle or 40 uM ciliobrevin D (CbD) for 10.5 h. Lysosomes and polymerized tubulin labeled with LysoTracker and TubulinTracker.N. Live imaging of U2OS cells expressing LAMP1-GFP (red pseudocolor) after treatment with vehicle or 60 uM CbD for 55 min (inset) and 9 h (different fields). Right: merged GFP and phase-contrast images.O. mTORC1 signaling in U2OS cells over 8 h of vehicle (veh.) or 40 uM CbD treatment. RE of 3. P. Luminescence of U2OS_Arntl::_dLUC cells synchronized and treated with 50 uM CbD or vehicle. Mean of 2 BR. RE of 2, 2–3 BR each. Representative fields of ≥3 BR for all microscopy. RE = representative experiment. BR = biological replicates. See also Figure S6.
Figure 7 -. Acid inhibits mTORC1 signaling and the clock by spatially separating RHEB and lysosome-bound mTORC1.
A. Immunoblots for mTORC1 signaling, HIFIα, and the human cytomegalovirus (HCMV) proteins IE72 and IE86 in HCMV-infected or uninfected (mock) U2OS cells treated with vehicle or 500 uM DMOG in low buffer media each for 8 and 12 h prior to harvest at 27 and 59 hours post infection (hpi), respectively, or in media pH 7.4 and 6.3 for 1 h prior to harvest.B. mTORC1 signaling and kinesin-1 heavy chain (HC) in U2OS cells at time points post delivery of 10 nM control (Ctl) siRNA or three different siRNA against KIF5B (kinesin-1 HC) and in pH 7.4 and 6.5 media 1 h prior to harvest. RE of 2. C. Model. Acid produced during hypoxic metabolic rewiring suppresses the circadian clock through inhibition of mTORCI-governed translation as a consequence of centrifugal redistribution of lysosome-bound mTORCI limiting mTOR activation by RHEB.D. mTORCI signaling over 32 h in TSC2 CRISPR knockout (−/−) or parental U2OS cells (+/+) treated with vehicle or 50 uM ciliobrevin D. E/F. Parental and RHEB_N153T_-expressing U2OS cells immunostained for LAMP1, mTOR, RHEB and nuclei (DAPI) after 160 min in pH 7.4 or 6.3 media. White boxes in F enlarged in E. RE of 3. G. Mean intensity of DAPI, mTOR, RHEB, and LAMP1 as a function of distance from the nucleus in F. n=10–13 cells each pH per cell line. Mean±SEM normalized to each channel’s parental pH 7.4 maximum. H._Arntl::_dLUC luminescence in TSC2 CRISPR knockout (−/−), RHEB_N153T_-expressing, and respective control U2OS cells synchronized and in pH 7.4 or 6.5 media. Mean of 3 BR. RE of 3–4, 1–3 BR each. I. mTORC1 signaling in parallel to H or treated with vehicle or 500 uM DMOG in low buffer conditions for 20 h (TSC2) or 16 h (RHEBN163T). RE of 2. J. Model of trans-endomembrane contact between lysosome-localized mTORC1 and non-lysosomal RHEB disrupted upon acid-driven peripheral redistribution of lysosome-bound mTOR. MTOC = microtubule organizing center K. Immunohistochemical pS6 staining of HCT116 xenograft tumors hosted by mice drinking tap water or 200 mM sodium bicarbonate _ad libitum_throughout tumor hosting (up to 3 weeks). Representative high-power fields and inset low-power images of entire tumor cross section. Positivity mask in lower panels. Percent pS6 positive pixels quantified over entire viable area of tumor cross section. Mean±SD n=4 mice each arm. 2-tailed Student’s t-test. RE= representative experiment. Biological replicates = BR. See also Figure S7.
Similar articles
- mTOR Senses Intracellular pH through Lysosome Dispersion from RHEB.
Walton ZE, Brooks RC, Dang CV. Walton ZE, et al. Bioessays. 2019 Jul;41(7):e1800265. doi: 10.1002/bies.201800265. Epub 2019 Jun 3. Bioessays. 2019. PMID: 31157925 Free PMC article. - Upregulation of 6-phosphofructo-2-kinase (PFKFB3) by hyperactivated mammalian target of rapamycin complex 1 is critical for tumor growth in tuberous sclerosis complex.
Wang Y, Tang S, Wu Y, Wan X, Zhou M, Li H, Zha X. Wang Y, et al. IUBMB Life. 2020 May;72(5):965-977. doi: 10.1002/iub.2232. Epub 2020 Jan 20. IUBMB Life. 2020. PMID: 31958214 - Circadian Rheb oscillation alters the dynamics of hepatic mTORC1 activity and mitochondrial morphology.
Yuan Q, Chen M, Yang W, Xiao B. Yuan Q, et al. FEBS Lett. 2021 Feb;595(3):360-369. doi: 10.1002/1873-3468.14009. Epub 2020 Dec 11. FEBS Lett. 2021. PMID: 33247956 - Multiplicity of hypoxia-inducible transcription factors and their connection to the circadian clock in the zebrafish.
Pelster B, Egg M. Pelster B, et al. Physiol Biochem Zool. 2015 Mar-Apr;88(2):146-57. doi: 10.1086/679751. Epub 2015 Jan 14. Physiol Biochem Zool. 2015. PMID: 25730270 Review. - Coordination of Rheb lysosomal membrane interactions with mTORC1 activation.
Angarola B, Ferguson SM. Angarola B, et al. F1000Res. 2020 May 27;9:F1000 Faculty Rev-450. doi: 10.12688/f1000research.22367.1. eCollection 2020. F1000Res. 2020. PMID: 32518628 Free PMC article. Review.
Cited by
- Genomics of circadian rhythms in health and disease.
Rijo-Ferreira F, Takahashi JS. Rijo-Ferreira F, et al. Genome Med. 2019 Dec 17;11(1):82. doi: 10.1186/s13073-019-0704-0. Genome Med. 2019. PMID: 31847894 Free PMC article. Review. - A Mathematical Model of Lysosomal Ion Homeostasis Points to Differential Effects of Cl- Transport in Ca2+ Dynamics.
Astaburuaga R, Quintanar Haro OD, Stauber T, Relógio A. Astaburuaga R, et al. Cells. 2019 Oct 16;8(10):1263. doi: 10.3390/cells8101263. Cells. 2019. PMID: 31623161 Free PMC article. - Hypoxia and Selective Autophagy in Cancer Development and Therapy.
Daskalaki I, Gkikas I, Tavernarakis N. Daskalaki I, et al. Front Cell Dev Biol. 2018 Sep 10;6:104. doi: 10.3389/fcell.2018.00104. eCollection 2018. Front Cell Dev Biol. 2018. PMID: 30250843 Free PMC article. Review. - Circadian rhythms, metabolic oscillators, and the target of rapamycin (TOR) pathway: the Neurospora connection.
Lakin-Thomas P. Lakin-Thomas P. Curr Genet. 2019 Apr;65(2):339-349. doi: 10.1007/s00294-018-0897-6. Epub 2018 Oct 26. Curr Genet. 2019. PMID: 30367189 Review. - Lipogenesis mediated by OGR1 regulates metabolic adaptation to acid stress in cancer cells via autophagy.
Pillai S, Mahmud I, Mahar R, Griffith C, Langsen M, Nguyen J, Wojtkowiak JW, Swietach P, Gatenby RA, Bui MM, Merritt ME, McDonald P, Garrett TJ, Gillies RJ. Pillai S, et al. Cell Rep. 2022 May 10;39(6):110796. doi: 10.1016/j.celrep.2022.110796. Cell Rep. 2022. PMID: 35545051 Free PMC article.
References
- Adamovich Y, Ladeuix B, Golik M, Koeners MP, and Asher G (2017). Rhythmic Oxygen Levels Reset Circadian Clocks through HIFIalpha. Cell Metab 25, 93–101. - PubMed
- Boudreau A, Purkey HE, Hitz A, Robarge K, Peterson D, Labadie S, Kwong M, Hong R, Gao M, Del Nagro C, et al. (2016). Metabolic plasticity underpins innate and acquired resistance to LDHA inhibition. Nat Chem Biol 12, 779–786. - PubMed
Publication types
MeSH terms
Substances
Grants and funding
- R01 CA057341/CA/NCI NIH HHS/United States
- R01 CA174746/CA/NCI NIH HHS/United States
- P30 CA076292/CA/NCI NIH HHS/United States
- R01 CA051497/CA/NCI NIH HHS/United States
- R01 CA157846/CA/NCI NIH HHS/United States
- F30 CA200347/CA/NCI NIH HHS/United States
- I01 BX001146/BX/BLRD VA/United States
- R01 CA077575/CA/NCI NIH HHS/United States
- R01 AI077610/AI/NIAID NIH HHS/United States
- P30 CA010815/CA/NCI NIH HHS/United States
- R01 AI091481/AI/NIAID NIH HHS/United States
- U54 CA193489/CA/NCI NIH HHS/United States
- T32 CA009140/CA/NCI NIH HHS/United States
LinkOut - more resources
Full Text Sources
Other Literature Sources
Molecular Biology Databases
Research Materials
Miscellaneous
