A novel long non-coding RNA from NBL2 pericentromeric macrosatellite forms a perinucleolar aggregate structure in colon cancer - PubMed (original) (raw)
A novel long non-coding RNA from NBL2 pericentromeric macrosatellite forms a perinucleolar aggregate structure in colon cancer
Gabrijela Dumbovic et al. Nucleic Acids Res. 2018.
Abstract
Primate-specific NBL2 macrosatellite is hypomethylated in several types of tumors, yet the consequences of this DNA hypomethylation remain unknown. We show that NBL2 conserved repeats are close to the centromeres of most acrocentric chromosomes. NBL2 associates with the perinucleolar region and undergoes severe demethylation in a subset of colorectal cancer (CRC). Upon DNA hypomethylation and histone acetylation, NBL2 repeats are transcribed in tumor cell lines and primary CRCs. NBL2 monomers exhibit promoter activity, and are contained within novel, non-polyA antisense lncRNAs, which we designated TNBL (Tumor-associated NBL2 transcript). TNBL is stable throughout the mitotic cycle, and in interphase nuclei preferentially forms a perinucleolar aggregate in the proximity of a subset of NBL2 loci. TNBL aggregates interact with the SAM68 perinucleolar body in a mirror-image cancer specific perinucleolar structure. TNBL binds with high affinity to several proteins involved in nuclear functions and RNA metabolism, such as CELF1 and NPM1. Our data unveil novel DNA and RNA structural features of a non-coding macrosatellite frequently altered in cancer.
Figures
Figure 1.
NBL2 distribution in the human genome. (A) NBL2 PCR analysis on DNA from human-rodent somatic cell hybrids containing a single human chromosome isolated in a rodent background. Top: in pink are represented the regions amplified by four NBL2 specific primer sets located across the repeat unit. Bottom: PCR products of each primer set from genomic DNA of somatic cell hybrids containing the indicated human chromosome. (B) NBL2 DNA FISH on metaphase spreads from leukocytes of a healthy donor (46XX). Hybridization signals were detected close to the centromeres in the short arms of acrocentric chromosomes 13, 14, 15 and 21 (n = 30). NBL2 in green, DAPI in grey. (C) Ideogram showing genome-wide distribution of NBL2 repeats in the human genome version hg38. 301 hits were color-grouped according to their similarity to NBL2 consensus sequence. Acrocentric chromosomes positive for NBL2 by PCR (A) and FISH (B) are highlighted by a colored box. (D) NBL2 DNA FISH (green) and NPM1 immunofluorescence (magenta) on interphase nuclei (grey) of HCT116 cell line. 3D view (on the right) shows NBL2 repeats from acrocentric chromosomes located in the perinucleolar region. On average, each nucleus contained 8 NBL2 FISH signals, with 92% of detected signals located adjacent to nucleolus (n = 30 nuclei).
Figure 2.
DNA methylation and histone deacetylation maintain NBL2 repressed. (A) Left: NBL2 methylation assessed by bisulfite sequencing in 3 CRC cell lines. Right: relative NBL2 expression analyzed by RT qPCR in CRC cell lines. (B) Left: NBL2 expression analyzed by RT qPCR in HCT116 cell line untreated (NT) and treated with AZA for 72h. Right: NBL2 expression analyzed by RT qPCR in Caco-2 cell line untreated (NT) and treated with AZA in a 5-day time course experiment. (C) Upper left: NBL2 expression assessed by RT qPCR in HCT116 cell line untreated (NT), treated with AZA, treated with AZA followed by TSA, and treated with TSA only. Upper right: relative abundance of NBL2 transcript compared to PUM1 levels (assigned as 1 in each sample) within each treatment group. Lower left: NBL2 methylation assessed by bisulfite sequencing in each treatment group. Each dot represents the average methylation of one NBL2 bisulfite converted sequence. Lower right: H3K9ac chromatin immunoprecipitation at NBL2 loci. Enrichment levels were normalized with H3 total levels at NBL2 loci. (D) Top left: NBL2 methylation assessed by bisulfite sequencing in HCT116 and DKO. Each dot represents the average methylation of one NBL2 bisulfite converted sequence. Top right: NBL2 methylation in HCT116 and DKO represented by a lollipop graph. Each line represents the internal region of 1 bisulfite converted NBL2 cloned DNA molecule. White and black circles: unmethylated and methylated CpGs, respectively. Lower left: RT qPCR of NBL2 in HCT116 untreated, DKO untreated, DKO treated with AZA and DKO treated with TSA. Lower right: relative abundance of NBL2 transcripts compared to PUM1 levels (assigned as 1 in each sample). All qPCRs show relative levels obtained using comparative Ct method and normalized with PUM1.
Figure 3.
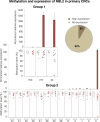
NBL2 somatic DNA hypomethylation predisposes for NBL2 overexpression in CRC. NBL2 expression analyzed in 2 CRC groups. Group 1 (24 tumor and matching normal tissue samples) analyzed for NBL2 expression by RT qPCR (top) and methylation by bisulfite sequencing (bottom). Three representative cases are shown: two cases (727 and 33) with NBL2 overexpression in the tumor and one case (700) with no detectable NBL2 expression. Group 2 (13 tumor and matching normal tissue samples) analyzed for NBL2 expression by RT qPCR (top) and NBL2 DNA methylation by bisulfite sequencing (bottom). In methylation graphs each dot represents average methylation of an internal region of 1 NBL2 bisulfite converted sequence. Red dots for tumor, grey dots for normal. Pie chart shows the percentage of patients expressing NBL2 considering both groups (n = 37). Statistical analysis was not performed due to low number of samples.
Figure 4.
TNBL is a long, non-polyA, nuclear and stable transcript. (A) TNBL RT qPCR of oligo(dT) or random primed cDNA from HCT116 (left) and Caco-2 (right) AZA and TSA treated cells. Control RNAs: PUM1 as a polyA containing RNA and 18S rRNA as a non polyA containing RNA. (B) Relative enrichment (in %) of TNBL, XIST and PUM1 transcripts in nuclear insoluble, nuclear soluble and cytoplasmic RNA fractions from AZA and TSA treated Caco-2 cells analyzed by RT-qPCR. (C) TNBL stability relative to GAPDH RNA measured by RT qPCR at several time points in LS174T cells treated with Actinomycin D (ActD) during a 6 h time course using two NBL2 specific primer sets (1 and 3). PUM1 and MALAT1 were used as controls of mature RNA, and 45s rRNA of pre-mature RNA. (D) Left: TNBL sense probe 1 Northern blot on RNA from untreated (NT), AZA and AZA/TSA treated Caco-2, HCT116 and TOV112D cells. RNA from mouse C2C12 myoblasts treated with AZA/TSA was used as a negative control. Middle: TNBL sense probe 2 Northern blot on RNA from HCT116 untreated (NT) and AZA/TSA treated, DKO untreated and TSA treated. Negative control: chromosome 9 human-rodent somatic cell hybrid treated with AZA/TSA. Right: TNBL sense probe 2 Northern blot on RNA from LS174T cells. Sample integrity and equal loading was assessed with 18s and 28s rRNA methylene blue staining. (E) NBL2 expression analyzed with RT qPCR in human rodent somatic cell hybrids untreated (NT), AZA treated, and AZA/TSA treated. (F) Northern blot on RNA from chromosome 13, 14, 15 and 21 human rodent somatic cell hybrids untreated and AZA/TSA treated. Sample integrity and equal loading was assessed with 28s rRNA methylene blue staining. (G) Scheme of DNA fragments cloned into pGL3-basic vector driving luciferase gene expression (LUC). Promoter activity was analyzed in DKO cells. NBL2 array is represented 3′ to 5′. 16 different constructs were analyzed: 10 different NBL2 monomer sequences (1.4 kb each); a monomer 21 (928 bp, truncated monomer); a monomer 21 with adjacent transposon elements (TE1: L1MD2-MLT1D); and four fragments encompassing distinct transposon element upstream regions: TE1 (L1MD2-MLT1D), TE2 (MLT1D-MER70-int), TE3 (LTR7-MER70A), TE4 (LTR7). The graph shows relative luciferase activity of tested fragments compared to empty vector. P = 3.9E–03, as evaluated by Mann-Whitney-Wilcoxon test.
Figure 5.
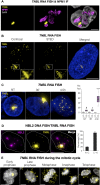
TNBL is a perinucleolar, stable RNA. (A) Maximum intensity projections of TNBL RNA FISH (yellow) and NPM1 immunofluorescence (magenta) in LS174T cells. TNBL forms clusters adjacent to the nucleolus, with typically one or two clusters per nucleus. All of the clusters were located in the perinucleolar region (n = 50 nuclei). DNA shown in grey. Zeta stacks were acquired with a wide-field microscope and deconvolved with Huygens deconvolution software. Scale bar, 5 μm. (B) Maximum intensity projections of confocal and stimulated emission depletion (STED) imaging of TNBL RNA FISH (yellow) in LS174T cells. DNA in blue. Scale bar, 5 μm. (C) Maximum intensity projections of TNBL RNA FISH in untreated LS174T cells and treated with Actinomycin D (ActD) for 30 min and 4.5h. Zeta stacks were acquired with a wide-field microscope. TNBL in yellow, DNA in blue. On the right: quantification of clustered TNBL (labelled as C) and dispersed TNBL (labelled as D) in all treatment conditions. 4.5h treatment with Actinomycin D results in total depletion of TNBL clusters and significant increase in dispersed TNBL signals (***P ≤ 0.001, as evaluated by unpaired _t_-test versus 30′ ActD or NT; n = 50 nuclei). (D) NBL2 DNA/RNA FISH. NBL2 in magenta, TNBL in yellow. Bar plot (n = 70 nuclei) shows the percentage of NBL2 loci co-localizing with TNBL clusters (N–C), and the percentage of TNBL clusters co-localizing with NBL2 loci (C–N). Nucleus border is outlined with a dashed line. (E) TNBL during mitosis detected by RNA FISH in LS174T high expressing clones. TNBL in yellow, DNA in gray. Scale bar, 5 μm.
Figure 6.
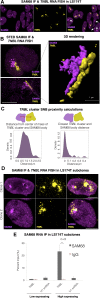
TNBL forms aggregates adjacent to SAM68 perinucleolar body (SNB). (A) Maximum intensity projection of SAM68 IF (magenta) and TNBL RNA FISH (yellow) confocal imaging in LS174T. SNBs (intense magenta) are located adjacent to TNBL clusters. White arrows: SNBs that do not co-localize with TNBL. (B) Left: SAM68 IF and TNBL RNA FISH STED images, top: both structures in an irregular round form, bottom: elongated form. Scale bar, 5 μm. Right: 3D rendering of the bottom left image showing SNB and TNBL aggregate in a lateral interaction through the entire length of the structures. Scale bar, 1 μm. (C) Proximity calculations between SNB and TNBL cluster in STED imaging (n = 54). Left: distances between SNB and TNBL clusters centers of mass. Right: closest exterior distances between SNB and TNBL clusters, median value 0 μm and maximum measured distance at 0.42 μm. (D) Maximum intensity projection of TNBL RNA FISH (yellow) and SAM68 IF confocal imaging in TNBL high expressing LS174T clones. Scale bar, 5 μm. (E) SAM68 UV crosslink RNA IP in high and low TNBL expressing LS174T clones. TNBL and negative control U1 snRNA were monitored by RT qPCR. Error bars indicate s.d., n = 3, **P ≤ 0.01, as evaluated by unpaired _t_-test vs. IgG.
Figure 7.
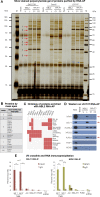
TNBL interacts with CELF1 and NPM1. (A) Polyacrylamide gel with size-separated proteins from RNA-affinity purification (RNA-AP). RNA-AP was performed with protein extracts from 3 CRC cell lines (DKO TSA treated cells, Caco-2 and LS174T). Probes: NBL2 monomer in vitro transcript (IVT) unlabeled (NBL2 U) as a background control, NBL2 monomer IVT biotin-labeled (NBL2 L), 2 biotin-labeled negative control IVTs corresponding to different regions of MALAT1 of the same size and GC content as NBL2 IVT (C1 and C2). Bands indicated with red arrows were cut and subjected to mass spectrometry in replicas. Band indicated with a blue arrow was pulled down only with MALAT1 IVT 2. U stands for unlabeled, L for labeled. (B) Proteins with most peptide count within each band. (C) Functional ontology of proteins enriched with NBL2 RNA-AP. (D) Western blot validation of proteins pulled down with RNA-AP. NBL2 IVT specifically interacts with NPM1 and CELF1 compared with negative control IVTs. (E) UV crosslink and RNA IP with antibodies against CELF1 (left) and NPM1 (right) in LS174T TNBL high expressing clone. TNBL enrichment was monitored by RT-qPCR with two primer sets (1 and 3). Enrichment of JunD, MALAT, PUM1 and U1 snRNA was monitored to control background precipitation. Error bars indicate s.d., CELF1 RNA IP n = 7, NPM1 RNA IP n = 3. ***P ≤ 0.001, as evaluated by unpaired _t_-test versus IgG.
Figure 8.
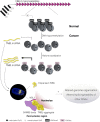
Model for TNBL expression in CRC. Acrocentric chromosomes 13, 14, 15 and 21 contain tandem arrays of NBL2 MSR, repressed by DNA methylation and histone deacetylation in normal colon epithelia. Upon NBL2 DNA hypomethylation TNBL lncRNA is expressed at moderate levels. Subsequent increase of histone acetylation results in high TNBL expression. TNBL location is nuclear where it mostly forms aggregates in the perinucleolar region close to NBL2 loci. These aggregates interact with SNB creating cancer-specific perinucleolar structures. Outside of the perinucleolar aggregates, TNBL is widely dispersed in the nucleus. Whether TNBL selective binding to NPM1, SAM68 and CELF1 proteins, which are involved in genome organization, splicing regulation and mRNA stability respectively, could impair their functionalities and potentially impact nuclear architecture and cell behavior is at the moment unknown.
Similar articles
- A DNA repeat, NBL2, is hypermethylated in some cancers but hypomethylated in others.
Nishiyama R, Qi L, Tsumagari K, Weissbecker K, Dubeau L, Champagne M, Sikka S, Nagai H, Ehrlich M. Nishiyama R, et al. Cancer Biol Ther. 2005 Apr;4(4):440-8. doi: 10.4161/cbt.4.4.1622. Epub 2005 Apr 21. Cancer Biol Ther. 2005. PMID: 15846090 - Stimulated emission depletion (STED) super resolution imaging of RNA- and protein-containing domains in fixed cells.
Dumbović G, Sanjuan X, Perucho M, Forcales SV. Dumbović G, et al. Methods. 2021 Mar;187:68-76. doi: 10.1016/j.ymeth.2020.04.009. Epub 2020 Apr 30. Methods. 2021. PMID: 32360441 - Whole-genome methylation scan in ICF syndrome: hypomethylation of non-satellite DNA repeats D4Z4 and NBL2.
Kondo T, Bobek MP, Kuick R, Lamb B, Zhu X, Narayan A, Bourc'his D, Viegas-Péquignot E, Ehrlich M, Hanash SM. Kondo T, et al. Hum Mol Genet. 2000 Mar 1;9(4):597-604. doi: 10.1093/hmg/9.4.597. Hum Mol Genet. 2000. PMID: 10699183 - Long noncoding RNAs: functions and mechanisms in colon cancer.
Chen S, Shen X. Chen S, et al. Mol Cancer. 2020 Nov 28;19(1):167. doi: 10.1186/s12943-020-01287-2. Mol Cancer. 2020. PMID: 33246471 Free PMC article. Review. - Epigenomics in stress tolerance of plants under the climate change.
Kumar M, Rani K. Kumar M, et al. Mol Biol Rep. 2023 Jul;50(7):6201-6216. doi: 10.1007/s11033-023-08539-6. Epub 2023 Jun 9. Mol Biol Rep. 2023. PMID: 37294468 Review.
Cited by
- LncRNAs: Architectural Scaffolds or More Potential Roles in Phase Separation.
Luo J, Qu L, Gao F, Lin J, Liu J, Lin A. Luo J, et al. Front Genet. 2021 Mar 31;12:626234. doi: 10.3389/fgene.2021.626234. eCollection 2021. Front Genet. 2021. PMID: 33868368 Free PMC article. Review. - From telomere to telomere: The transcriptional and epigenetic state of human repeat elements.
Hoyt SJ, Storer JM, Hartley GA, Grady PGS, Gershman A, de Lima LG, Limouse C, Halabian R, Wojenski L, Rodriguez M, Altemose N, Rhie A, Core LJ, Gerton JL, Makalowski W, Olson D, Rosen J, Smit AFA, Straight AF, Vollger MR, Wheeler TJ, Schatz MC, Eichler EE, Phillippy AM, Timp W, Miga KH, O'Neill RJ. Hoyt SJ, et al. Science. 2022 Apr;376(6588):eabk3112. doi: 10.1126/science.abk3112. Epub 2022 Apr 1. Science. 2022. PMID: 35357925 Free PMC article. - Paraspeckles are constructed as block copolymer micelles.
Yamazaki T, Yamamoto T, Yoshino H, Souquere S, Nakagawa S, Pierron G, Hirose T. Yamazaki T, et al. EMBO J. 2021 Jun 15;40(12):e107270. doi: 10.15252/embj.2020107270. Epub 2021 Apr 22. EMBO J. 2021. PMID: 33885174 Free PMC article. - Unravelling the impact of aging on the human endothelial lncRNA transcriptome.
Drekolia MK, Talyan S, Cordellini Emídio R, Boon RA, Guenther S, Looso M, Dumbović G, Bibli SI. Drekolia MK, et al. Front Genet. 2022 Oct 21;13:1035380. doi: 10.3389/fgene.2022.1035380. eCollection 2022. Front Genet. 2022. PMID: 36338971 Free PMC article. - Single-cell imaging reveals unexpected heterogeneity of telomerase reverse transcriptase expression across human cancer cell lines.
Rowland TJ, Dumbović G, Hass EP, Rinn JL, Cech TR. Rowland TJ, et al. Proc Natl Acad Sci U S A. 2019 Sep 10;116(37):18488-18497. doi: 10.1073/pnas.1908275116. Epub 2019 Aug 26. Proc Natl Acad Sci U S A. 2019. PMID: 31451652 Free PMC article.
References
- Diala E.S., Hoffman R.M.. Hypomethylation of HeLa cell DNA and the absence of 5-methylcytosine in SV40 and adenovirus (type 2) DNA: analysis by HPLC. Biochem. Biophys. Res. Commun. 1982; 107:19–26. - PubMed
- Feinberg A.P., Vogelstein B.. Hypomethylation distinguishes genes of some human cancers from their normal counterparts. Nature. 1983; 301:89–92. - PubMed
- Feinberg A.P., Vogelstein B.. Hypomethylation of ras oncogenes in primary human cancers. Biochem. Biophys. Res. Commun. 1983; 111:47–54. - PubMed
Publication types
MeSH terms
Substances
LinkOut - more resources
Full Text Sources
Other Literature Sources


