Effects of Oligosaccharides From Morinda officinalis on Gut Microbiota and Metabolome of APP/PS1 Transgenic Mice - PubMed (original) (raw)
doi: 10.3389/fneur.2018.00412. eCollection 2018.
Chen Diling 3, Yang Jian 3, Liu Ting 2, Hu Guoyan 2, Liang Hualun 4, Tang Xiaocui 3, Lai Guoxiao 3 5, Shuai Ou 3, Zheng Chaoqun 3, Zhao Jun 6, Xie Yizhen 3
Affiliations
- PMID: 29962999
- PMCID: PMC6013575
- DOI: 10.3389/fneur.2018.00412
Effects of Oligosaccharides From Morinda officinalis on Gut Microbiota and Metabolome of APP/PS1 Transgenic Mice
Yang Xin et al. Front Neurol. 2018.
Abstract
Alzheimer's disease (AD), a progressive neurodegenerative disorder, lacks preclinical diagnostic biomarkers and therapeutic drugs. Thus, earlier intervention in AD is a top priority. Studies have shown that the gut microbiota influences central nervous system disorders and that prebiotics can improve the cognition of hosts with AD, but these effects are not well understood. Preliminary research has shown that oligosaccharides from Morinda officinalis (OMO) are a useful prebiotic and cause substantial memory improvements in animal models of AD; however, the mechanism is still unclear. Therefore, this study was conducted to investigate whether OMO are clinically effective in alleviating AD by improving gut microbiota. OMO were administered to APP/PS1 transgenic mice, and potential clinical biomarkers of AD were identified with metabolomics and bioinformatics. Behavioral experiments demonstrated that OMO significantly ameliorated the memory of the AD animal model. Histological changes indicated that OMO ameliorated brain tissue swelling and neuronal apoptosis and downregulated the expression of the intracellular AD marker Aβ1-42. 16S rRNA sequencing analyses indicated that OMO maintained the diversity and stability of the microbial community. The data also indicated that OMO are an efficacious prebiotic in an animal model of AD, regulating the composition and metabolism of the gut microbiota. A serum metabolomics assay was performed using UHPLC-LTQ Orbitrap mass spectrometry to delineate the metabolic changes and potential early biomarkers in APP/PS1 transgenic mice. Multivariate statistical analysis showed that 14 metabolites were significantly upregulated, and 8 metabolites were downregulated in the model animals compared to the normal controls. Thus, key metabolites represent early indicators of the development of AD. Overall, we report a drug and signaling pathway with therapeutic potential, including proteins associated with cognitive deficits in normal mice or gene mutations that cause AD.
Keywords: APP/PS1 transgenic mice; Alzheimer's disease; gut microbiota; metabolites; metabolomics; oligosaccharides of Morinda officinalis.
Figures
Figure 1
Effect of OMO on APP/PS1 transgenic mice. Body weight changes were measured weekly (A). Escape latencies in the H maze (B) and probe test results (C), and histopathological changes in brain tissues (D) are shown. N represents the C57 group, M denotes the APP/PS1 transgenic group, BD indicates the group treated with 50 mg/kg OMO, and BH designates the group treated with 100 mg/kg OMO; the treatments were administered for 6 months (n = 10). Values are presented as the means ± SDs of six independent experiments. #p < 0.05 compared with the control group; **p < 0.01 compared with the M group.
Figure 2
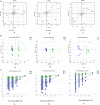
Effects of OMO on the gut microbiota of the APP/PS1 transgenic mice, as determined from fecal samples. The rarefaction curve (A), the results of the NMDS analysis (B), PLS-DA results (C), classification and abundance of fecal contents at the phylum level (D), and the results of 16S rRNA sequencing of the gut microbiota using an Illumina MiSeq sequencing system are shown. N denotes the C57 group, M represents the APP/PS1 transgenic group, BD denotes the 50 mg/kg OMO-treated group, and BH indicates the 100 mg/kg OMO-treated group.
Figure 3
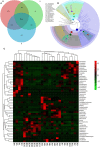
Effects of OMO on the microbiota in fecal samples from the APP/PS1 transgenic mice. A Venn diagram of OTUs (A), a sample species classification tree (B), and the heatmap of 16S rRNA gene sequencing analysis of fecal contents at the genus level (C) are shown. N denotes the control group, M denotes the APP/PS1 transgenic group, and BD designates the 50 mg/kg OMO-treated group.
Figure 4
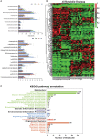
Effects of OMO on the microbiota in fecal samples from the APP/PS1 transgenic mice. The graph in (A) shows the classification and abundance of fecal contents at the phylum level, (B) shows the classification and abundance of fecal contents at the family level, and (C) shows the results of the KEGG pathway enrichment analysis of the gut microbiota with respect to the metabolic systems. Values are presented as the means of six independent experiments. N denotes the control group, M represents the APP/PS1 transgenic group, and BD designates the 50 mg/kg OMO-treated group.
Figure 5
Analysis of the metabolic profiles based on the UPLC/MS spectra of serum samples. Serum BPI chromatograms of APP/PS1 and wild-type mice collected in positive ion mode (A) and negative ion mode (B). N denotes the control group, M represents the APP/PS1 transgenic group, BD denotes the 50 mg/kg OMO-treated group, and BH designates the 100 mg/kg OMO-treated group.
Figure 6
Score plots of metabolite levels in a serum sample. OPLS-DA score plots of the serum metabolic profile (A): (a) N vs. BD, (b) N vs. BH, and (c) N vs. M. Permutation score plots of serum metabolic profiles (B): (a) N vs. BD, (b) N vs. BH, and (c) N vs. M. Loading score plot of the serum metabolic profile (C): (a) N vs. BD, (b) N vs. BH, and (c) N vs. M. N denotes the control group, M represents the APP/PS1 transgenic group, BD denotes the 50 mg/kg OMO-treated group, and BH represents the 100 mg/kg OMO-treated group.
Figure 7
Comparison of the relative intensities of the potential biomarkers (A). KEGG pathway annotations of differentially expressed genes in serum samples (B). Heatmap showing the levels of 24 different metabolites (C). The degree of change is marked with different colors: red represents upregulation, and green indicates downregulation. Each row represents an individual sample, and each column represents a metabolite. N denotes the C57 mice, M represents the APP/PS1 transgenic mice, BD indicates the group treated with 50 mg/kg OMO, and BH denotes the group treated with 100 mg/kg OMO. Values are presented as the means ± SDs of six independent experiments. #p < 0.05 compared with the control group; *p < 0.05 and **p < 0.01 compared with the M group.
Similar articles
- Prebiotic Effect of Fructooligosaccharides from Morinda officinalis on Alzheimer's Disease in Rodent Models by Targeting the Microbiota-Gut-Brain Axis.
Chen D, Yang X, Yang J, Lai G, Yong T, Tang X, Shuai O, Zhou G, Xie Y, Wu Q. Chen D, et al. Front Aging Neurosci. 2017 Dec 8;9:403. doi: 10.3389/fnagi.2017.00403. eCollection 2017. Front Aging Neurosci. 2017. PMID: 29276488 Free PMC article. - Oligosaccharides from Morinda officinalis Slow the Progress of Aging Mice by Regulating the Key Microbiota-Metabolite Pairs.
Xin Y, Diling C, Tianlu C, Jun Z, Xiaocui T, Yinrui G, Ou S, Tianming D, Guoyan H. Xin Y, et al. Evid Based Complement Alternat Med. 2019 Dec 19;2019:9306834. doi: 10.1155/2019/9306834. eCollection 2019. Evid Based Complement Alternat Med. 2019. PMID: 31929824 Free PMC article. - Fructooligosaccharides Ameliorating Cognitive Deficits and Neurodegeneration in APP/PS1 Transgenic Mice through Modulating Gut Microbiota.
Sun J, Liu S, Ling Z, Wang F, Ling Y, Gong T, Fang N, Ye S, Si J, Liu J. Sun J, et al. J Agric Food Chem. 2019 Mar 13;67(10):3006-3017. doi: 10.1021/acs.jafc.8b07313. Epub 2019 Feb 28. J Agric Food Chem. 2019. PMID: 30816709 - Mass spectrometry-based metabolomics: Targeting the crosstalk between gut microbiota and brain in neurodegenerative disorders.
Luan H, Wang X, Cai Z. Luan H, et al. Mass Spectrom Rev. 2019 Jan;38(1):22-33. doi: 10.1002/mas.21553. Epub 2017 Nov 12. Mass Spectrom Rev. 2019. PMID: 29130504 Review. - Alterations in Peripheral Metabolites as Key Actors in Alzheimer's Disease.
Sheng C, Chu X, He Y, Ding Q, Jia S, Shi Q, Sun R, Song L, Du W, Liang Y, Chen N, Yang Y, Wang X. Sheng C, et al. Curr Alzheimer Res. 2023;20(6):379-393. doi: 10.2174/1567205020666230825091147. Curr Alzheimer Res. 2023. PMID: 37622711 Review.
Cited by
- Gut Microbiome in Alzheimer's Disease: from Mice to Humans.
Liang C, Pereira R, Zhang Y, Rojas OL. Liang C, et al. Curr Neuropharmacol. 2024;22(14):2314-2329. doi: 10.2174/1570159X22666240308090741. Curr Neuropharmacol. 2024. PMID: 39403057 Free PMC article. Review. - Herbal medicines in Alzheimer's disease and the involvement of gut microbiota.
Liu M, Li T, Liang H, Zhong P. Liu M, et al. Front Pharmacol. 2024 Jul 16;15:1416502. doi: 10.3389/fphar.2024.1416502. eCollection 2024. Front Pharmacol. 2024. PMID: 39081953 Free PMC article. Review. - Improvement of both human and animal memory by synergy between fructooligosaccharide and L-theanine function establishing a safe and effective food supplement.
Li Y, Jiang Y, Zhang Z, Loake VIP, Bao X, Loake GJ. Li Y, et al. Food Sci Nutr. 2024 May 13;12(7):4966-4980. doi: 10.1002/fsn3.4145. eCollection 2024 Jul. Food Sci Nutr. 2024. PMID: 39055226 Free PMC article. - From Gut Microbiomes to Infectious Pathogens: Neurological Disease Game Changers.
K M M, Ghosh P, Nagappan K, Palaniswamy DS, Begum R, Islam MR, Tagde P, Shaikh NK, Farahim F, Mondal TK. K M M, et al. Mol Neurobiol. 2024 Jul 5. doi: 10.1007/s12035-024-04323-0. Online ahead of print. Mol Neurobiol. 2024. PMID: 38967904 Review. - Gut microbiota-host lipid crosstalk in Alzheimer's disease: implications for disease progression and therapeutics.
Luo YX, Yang LL, Yao XQ. Luo YX, et al. Mol Neurodegener. 2024 Apr 16;19(1):35. doi: 10.1186/s13024-024-00720-0. Mol Neurodegener. 2024. PMID: 38627829 Free PMC article. Review.
References
- Owen JB, Di DF, Sultana R, Perluigi M, Cini C, Pierce WM, et al. . Proteomics-determined diffences in the concanavalin-A-fractionated proteome of hippocampus and inferior parietal lobule in subjects with Alzheimer's disease and mild cognitive impairment: implications for progression of AD. J Proteome Res. (2009) 8:471–82. 10.1021/pr800667a - DOI - PMC - PubMed
LinkOut - more resources
Full Text Sources
Other Literature Sources


