DNA-induced liquid phase condensation of cGAS activates innate immune signaling - PubMed (original) (raw)
DNA-induced liquid phase condensation of cGAS activates innate immune signaling
Mingjian Du et al. Science. 2018.
Abstract
The binding of DNA to cyclic GMP-AMP synthase (cGAS) leads to the production of the secondary messenger cyclic GMP-AMP (cGAMP), which activates innate immune responses. We have shown that DNA binding to cGAS robustly induced the formation of liquidlike droplets in which cGAS was activated. The disordered and positively charged cGAS N terminus enhanced cGAS-DNA phase separation by increasing the valencies of DNA binding. Long DNA was more efficient in promoting cGAS liquid phase separation and cGAS enzyme activity than short DNA. Moreover, free zinc ions enhanced cGAS enzyme activity both in vitro and in cells by promoting cGAS-DNA phase separation. These results demonstrated that the DNA-induced phase transition of cGAS promotes cGAMP production and innate immune signaling.
Copyright © 2018 The Authors, some rights reserved; exclusive licensee American Association for the Advancement of Science. No claim to original U.S. Government Works.
Figures
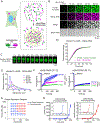
Fig. 1. DNA binding to cGAS induces the formation of liquid-like droplets in which cGAS is activated.
(A) Schematic of hypothetical cGAS–DNA interactions that drive liquid phase condensation. (B) Time-lapse imaging of cGAS–DNA phase separation. Liquid droplets formed after mixing 10 μM full-length human cGAS (3% Alexa 488-labeled) with 10 μM 100-bp DNA (2% Cy3-labeled) and matured over 60 min. The images shown are representative of all fields in the well. (C) Time-lapse micrographs of merging droplets that formed as described in (B). Data are representative of at least ten merging droplets. (D) Fluorescence intensities of cGAS–DNA liquid droplets forming over the time course of 120 min. Data were normalized to 100% by maximal fluorescence intensity. Values shown are means ± SD. N = 4 images. AF488: Alexa Fluor 488. (E) EqDiameter frequency distribution of cGAS–DNA liquid droplets formed at the indicated time points. EqDiameter: the diameter of a circle with the same area as the measured object. cGAS: 5 μM; DNA: 5 μM. (F) Fluorescence recovery after photobleaching (FRAP) of cGAS–DNA liquid droplets. Bleaching was performed at the indicated time points after cGAS (10 μM) and DNA (10 μM) were mixed, and the recovery was allowed to occur at 25 °C (left) or 37 °C (right). Time 0 indicates the start of recovery after photobleaching. Shown are the mean ± SD. N = 3 liquid droplets. One-way ANOVA; p-value: > 0.0332 (n.s.), 0.0332 (*), 0.0021 (**), 0.0002 (***), < 0.0001 (****). (G) Phase separation diagram of full-length human cGAS and 100-bp DNA at indicated concentrations. Blue dots: no phase separation; red dots: phase separation. (H) Left panel: cGAMP production by indicated concentrations of cGAS in the presence of ATP, GTP, and HT-DNA. cGAMP production at low cGAS concentrations is shown in the inset; right panel: normalized cGAMP production divided by cGAS concentrations. Shown are the mean ± SD. N = 3 assays. Data are representative of at least three independent experiments unless indicated otherwise.
Fig. 2. DNA-induced liquid phase separation of cGAS in cells.
(A) Representative live cell images of cGAS–DNA puncta formation after transfection of fluorescein-ISD into BJ cells stably expressing Halo-cGAS, which was covalently labeled with TMR. Zoomed images indicate cGAS–DNA puncta (Boxes). Scale bar: 10 μm. These images are representative of at least 10 cells. (B) MEF cells stably expressing GFP–cGAS were transfected with Cy5-ISD for 4 hours, followed by permeabilization of the cells with saponin and fluorescence microscopy. Shown in blue is the plasma membrane marker wheat germ agglutinin. Scale bar: 50 μm. These images are representative of at least 5 fields examined. (C) Time-lapse micrographs of cGAS (green) and DNA (magenta) puncta formation and fusion (time 0 represents 30 min after Cy5-ISD45 transfection). Scale bar: 15 μm. The fusion events existed in all 8 fields examined. (D) Representative micrographs of cGAS–DNA puncta before and after photobleaching (arrow, bleach site). Scale bar: 15 μm. These images are representative of at least 3 cells in which the cGAS–DNA puncta were photobleached. (E) Quantification of cGAS–DNA puncta FRAP over a 120-second time course. K: exponential constant. R: normalized plateau after fluorescence recovery. Shown are means ± SD. N = 3 cGAS–DNA puncta. (F) Subcellular fractionation of cGAS activity in DNA-transfected cells. HeLa cells transfected with or without HT-DNA were fractionated by differential centrifugation as depicted in Fig. S4B. Fractions were incubated with ATP and GTP followed by measurement of cGAMP. Fractions were also analyzed by immunoblotting with antibodies against histone H2A (nuclear marker), GAPDH (cytoplasmic marker), or cGAS. (G) The P2 fractions from (F) were further separated by Optiprep gradient ultracentrifugation and cGAS activity in different fractions were measured as in (F). Fractions from cells not transfected with DNA had no cGAS activity (upper panel). Error bars in (F) and (G) represent the variation range of duplicate assays. Data are representative of at least three independent experiments.
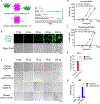
Fig. 3. Multivalent interactions drive cGAS–DNA condensation and promote cGAS activation.
(A) Schematic of hypothetical cGAS and DNA valencies. (B) Representative images of phase separation by mixing cGAS (10 μM) with dsDNA of different lengths (10 μM) in physiological buffer. Scale bar: 10 μm. AF488: Alexa Fluor 488. (C) Bright-field images of phase separation by mixing DNA of different lengths with full-length or N-terminally truncated human or mouse cGAS as indicated. Scale bar: 20 μm. The images shown in (B) and (C) are representative of all fields in the wells. (D & E) cGAMP production by different concentrations of recombinant full length or ΔN human cGAS in low-salt buffer (D) or physiological buffer (E). Shown are the mean ± SD. N = 3 assays. (F) Quantification of cGAS–DNA puncta by imaging of MEF cells expressing GFP-tagged full length human cGAS or ΔN160-cGAS after transfection of Cy5-ISD. Representative images are shown in Figure S6. Values shown are means ± SD. N = 5 images. (G) cGAMP production in the MEF cells expressing full length or ΔN160 human cGAS after transfection with ISD or HT-DNA. Values are means ± SD. N = 3. Multiple t-tests; p-values (for F and G): > 0.0332 (n.s.), 0.0332 (*), 0.0021 (**), 0.0002 (***), < 0.0001 (****). cGAS expression levels are shown in Figure S5F. Data are representative of at least three independent experiments.
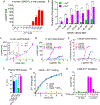
Fig. 4.. Zinc ion promotes DNA-induced phase separation and activation of cGAS.
(A) Zn2+ enhances cGAS activation in vitro. Recombinant human full-length cGAS (15 nM) was incubated with ATP, GTP, and DNA in a physiological buffer containing indicated concentrations of Zn2+, followed by measurement of cGAMP production. (B) Quantification of cGAS–DNA condensates in the presence or absence of zinc. Liquid-phase condensates formed after mixing Alexa Fluor 488-labeled full-length human cGAS with 45-bp Cy3-labeled ISD at indicated concentrations of each in physiological buffer with or without Zn2+ (200 μM). Images were then captured by confocal microscopy and representative images are shown in Figure S7D. Values are means ± SD. N = 5 images. Multiple t tests. (C) cGAMP production in physiological buffer containing HT-DNA and different concentrations of cGAS in the presence or absence of Zn2+ (200 μM). The activity of cGAS at low concentrations is shown in the inset. Multiple t tests. (D) cGAMP production by 10 nM cGAS in physiological buffer containing 200 μM Zn2+ and different concentrations of DNA of indicated lengths. (E) THP1-Lucia ISG cells, which harbor a luciferase gene under the ISG54 promoter, were transfected with indicated DNA for 24 hours followed by measurement of the secreted luciferase activity. RLU: relative luciferase unit. (F) Thermo shift assay to measure the stability of cGAS or cGAS–DNA complex in the presence or absence of Zn2+ (200 μM). Tm: protein melting temperature. Values are means ± SD. N = 3. Unpaired t test. (G) Measurement of cGAS binding to zinc. Zinc ion (10 μM) was incubated with various concentrations of DNA, cGAS, or both, and the solution was passed through a centrifugal filter, followed by measuring zinc ion concentration in the filtrate. The Kd values of zinc binding to cGAS and cGAS–DNA complex were 3.9 ± 1.3 μM and 3.0 ± 0.4 μM, respectively. (H) Depletion of intracellular zinc inhibits cGAS activation by DNA. L929 cells were incubated with the indicated concentrations of Zn2+ chelator TPEN for 2 hours before transfection with HT-DNA. cGAMP production was measured by a bioassay. Images of intracellular zinc depletion are shown in Figure S8B p values for B, C and F: > 0.0332 (n.s.), 0.0332 (*), 0.0021 (**), 0.0002 (***), < 0.0001 (****). Error bars represent the variation range of duplicate assays unless indicated otherwise. Data are representative of at least three independent experiments.
Comment in
- Phase separation focuses DNA sensing.
Ablasser A. Ablasser A. Science. 2018 Aug 17;361(6403):646-647. doi: 10.1126/science.aau6019. Science. 2018. PMID: 30115795 No abstract available. - cGAS activation in phased droplets.
Liu Y, Li HB, Flavell RA. Liu Y, et al. Cell Res. 2018 Oct;28(10):967-968. doi: 10.1038/s41422-018-0087-6. Cell Res. 2018. PMID: 30218060 Free PMC article. No abstract available.
Similar articles
- The catalytic mechanism of cyclic GMP-AMP synthase (cGAS) and implications for innate immunity and inhibition.
Hall J, Ralph EC, Shanker S, Wang H, Byrnes LJ, Horst R, Wong J, Brault A, Dumlao D, Smith JF, Dakin LA, Schmitt DC, Trujillo J, Vincent F, Griffor M, Aulabaugh AE. Hall J, et al. Protein Sci. 2017 Dec;26(12):2367-2380. doi: 10.1002/pro.3304. Epub 2017 Oct 25. Protein Sci. 2017. PMID: 28940468 Free PMC article. - Ku proteins promote DNA binding and condensation of cyclic GMP-AMP synthase.
Tao X, Song J, Song Y, Zhang Y, Yang J, Zhang P, Zhang D, Chen D, Sun Q. Tao X, et al. Cell Rep. 2022 Sep 6;40(10):111310. doi: 10.1016/j.celrep.2022.111310. Cell Rep. 2022. PMID: 36070696 - Human cGAS catalytic domain has an additional DNA-binding interface that enhances enzymatic activity and liquid-phase condensation.
Xie W, Lama L, Adura C, Tomita D, Glickman JF, Tuschl T, Patel DJ. Xie W, et al. Proc Natl Acad Sci U S A. 2019 Jun 11;116(24):11946-11955. doi: 10.1073/pnas.1905013116. Epub 2019 May 29. Proc Natl Acad Sci U S A. 2019. PMID: 31142647 Free PMC article. - Conserved strategies for pathogen evasion of cGAS-STING immunity.
Eaglesham JB, Kranzusch PJ. Eaglesham JB, et al. Curr Opin Immunol. 2020 Oct;66:27-34. doi: 10.1016/j.coi.2020.04.002. Epub 2020 Apr 15. Curr Opin Immunol. 2020. PMID: 32339908 Free PMC article. Review. - The cGAS-cGAMP-STING pathway connects DNA damage to inflammation, senescence, and cancer.
Li T, Chen ZJ. Li T, et al. J Exp Med. 2018 May 7;215(5):1287-1299. doi: 10.1084/jem.20180139. Epub 2018 Apr 5. J Exp Med. 2018. PMID: 29622565 Free PMC article. Review.
Cited by
- Regulation and Consequences of cGAS Activation by Self-DNA.
Zierhut C, Funabiki H. Zierhut C, et al. Trends Cell Biol. 2020 Aug;30(8):594-605. doi: 10.1016/j.tcb.2020.05.006. Epub 2020 Jun 13. Trends Cell Biol. 2020. PMID: 32546434 Free PMC article. Review. - Structural basis for nucleosome-mediated inhibition of cGAS activity.
Cao D, Han X, Fan X, Xu RM, Zhang X. Cao D, et al. Cell Res. 2020 Dec;30(12):1088-1097. doi: 10.1038/s41422-020-00422-4. Epub 2020 Oct 13. Cell Res. 2020. PMID: 33051594 Free PMC article. - DNA-sensing pathways in health, autoinflammatory and autoimmune diseases.
Dong M, Fitzgerald KA. Dong M, et al. Nat Immunol. 2024 Nov;25(11):2001-2014. doi: 10.1038/s41590-024-01966-y. Epub 2024 Oct 4. Nat Immunol. 2024. PMID: 39367124 Review. - Bcl10 phosphorylation-dependent droplet-like condensation positively regulates DNA virus-induced innate immune signaling.
Yang D, Pei G, Dong S, Zhang W, Deng H, Zhao X, Li P, Lin X. Yang D, et al. Sci China Life Sci. 2023 Feb;66(2):283-297. doi: 10.1007/s11427-022-2169-x. Epub 2022 Sep 15. Sci China Life Sci. 2023. PMID: 36115893 - Crosstalk between cGAS-STING signaling and cell death.
Murthy AMV, Robinson N, Kumar S. Murthy AMV, et al. Cell Death Differ. 2020 Nov;27(11):2989-3003. doi: 10.1038/s41418-020-00624-8. Epub 2020 Sep 18. Cell Death Differ. 2020. PMID: 32948836 Free PMC article. Review.
References
- Wu J, Chen ZJ, Innate immune sensing and signaling of cytosolic nucleic acids. Annu Rev Immunol 32, 461–488 (2014). - PubMed
- Chen Q, Sun L, Chen ZJ, Regulation and function of the cGAS-STING pathway of cytosolic DNA sensing. Nat Immunol 17, 1142–1149 (2016). - PubMed
Publication types
MeSH terms
Substances
LinkOut - more resources
Full Text Sources
Other Literature Sources
Molecular Biology Databases


