Inter and Intraspecific Genomic Divergence in Drosophila montana Shows Evidence for Cold Adaptation - PubMed (original) (raw)
Inter and Intraspecific Genomic Divergence in Drosophila montana Shows Evidence for Cold Adaptation
Darren J Parker et al. Genome Biol Evol. 2018.
Abstract
The genomes of species that are ecological specialists will likely contain signatures of genomic adaptation to their niche. However, distinguishing genes related to ecological specialism from other sources of selection and more random changes is a challenge. Here, we describe the genome of Drosophila montana, which is the most extremely cold-adapted Drosophila species known. We use branch tests to identify genes showing accelerated divergence in contrasts between cold- and warm-adapted species and identify about 250 genes that show differences, possibly driven by a lower synonymous substitution rate in cold-adapted species. We also look for evidence of accelerated divergence between D. montana and D. virilis, a previously sequenced relative, but do not find strong evidence for divergent selection on coding sequence variation. Divergent genes are involved in a variety of functions, including cuticular and olfactory processes. Finally, we also resequenced three populations of D. montana from across its ecological and geographic range. Outlier loci were more likely to be found on the X chromosome and there was a greater than expected overlap between population outliers and those genes implicated in cold adaptation between Drosophila species, implying some continuity of selective process at these different evolutionary scales.
Figures
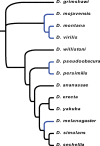
Fig. 1.
—Tree used for multi-species PAML analyses. Cold-tolerant species (species that have a knockdown temperature of <3 °C) are shown in blue (data from Kellermann et al. [2012] and MacMillan et al. [2015]).
Fig. 2.
—Distributions of dN and dS estimates for each of the 250 genes from 13 Drosophila species with significant differences in ω between cold-tolerant and non-cold-tolerant species.
Fig. 3.
—The relationship between values of ω estimated for 5,619 genes in cold-tolerant and non-cold-tolerant species of Drosophila. 250 genes with significantly different estimates of ω are shown in black with red outline. Diagonal line indicates the 1–1 diagonal, points below the diagonal line show elevated levels of ω in cold-tolerant species compared with non-cold-tolerant species, whereas points above the diagonal show elevated levels of ω in non-cold-tolerant species.
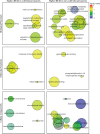
Fig. 4.
—Semantic clustering of significantly (FDR < 0.1) enriched GO-terms for genes showing significantly elevated dN/dS in cold-tolerant or non-cold-tolerant species. Circle size corresponds to the number of genes annotated to the term in the reference database. Circle colour indicates log10 FDR of the GO term.
Fig. 5.
—Average values of ω between D. montana and D. virilis for candidate gene sets. FRTP = female reproductive tract SFP = seminal fluid proteins SRR = sex and reproduction related genes CA = cold acclimation genes. The red and dashed lines indicate the median and mean ω of the genomic background, respectively.
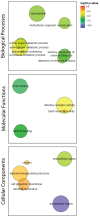
Fig. 6.
—Semantic clustering of significantly (FDR < 0.1) enriched GO-terms for genes showing high dN/dS between D. montana and D. virilis. Circle size corresponds to the number of genes annotated to the term in the reference database. Circle colour indicates log10 FDR of the GO term.
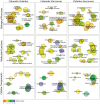
Fig. 7.
—Semantic clustering of significantly (FDR < 0.1) enriched GO-terms for genes showing significant divergence between populations of D. montana. Circle size corresponds to the number of genes annotated to the term in the reference database. Circle colour indicates log10 FDR of the GO term.
Fig. 8.
—Manhattan plot of _q_-values from the three pairwise BayeScan analyses for the SNPs on the mapped chromosomes. Red points denote SNPs which passed the 0.05 _q_-value FDR threshold. Alternating grey and black points denote different scaffolds that have been anchored to the chromosomes. The order of the mapped scaffolds is established but not their orientation.
Similar articles
- Cold adaptation drives population genomic divergence in the ecological specialist, Drosophila montana.
Wiberg RAW, Tyukmaeva V, Hoikkala A, Ritchie MG, Kankare M. Wiberg RAW, et al. Mol Ecol. 2021 Aug;30(15):3783-3796. doi: 10.1111/mec.16003. Epub 2021 Jun 13. Mol Ecol. 2021. PMID: 34047417 - Changes in gene expression linked with adult reproductive diapause in a northern malt fly species: a candidate gene microarray study.
Kankare M, Salminen T, Laiho A, Vesala L, Hoikkala A. Kankare M, et al. BMC Ecol. 2010 Feb 1;10:3. doi: 10.1186/1472-6785-10-3. BMC Ecol. 2010. PMID: 20122138 Free PMC article. - Phylogeographic patterns in Drosophila montana.
Mirol PM, Schäfer MA, Orsini L, Routtu J, Schlötterer C, Hoikkala A, Butlin RK. Mirol PM, et al. Mol Ecol. 2007 Mar;16(5):1085-97. doi: 10.1111/j.1365-294X.2006.03215.x. Mol Ecol. 2007. PMID: 17305862 - Drosophila biology in the genomic age.
Markow TA, O'Grady PM. Markow TA, et al. Genetics. 2007 Nov;177(3):1269-76. doi: 10.1534/genetics.107.074112. Genetics. 2007. PMID: 18039866 Free PMC article. Review. - Helitrons shaping the genomic architecture of Drosophila: enrichment of DINE-TR1 in α- and β-heterochromatin, satellite DNA emergence, and piRNA expression.
Dias GB, Heringer P, Svartman M, Kuhn GC. Dias GB, et al. Chromosome Res. 2015 Sep;23(3):597-613. doi: 10.1007/s10577-015-9480-x. Chromosome Res. 2015. PMID: 26408292 Review.
Cited by
- Genomic signatures of thermal adaptation are associated with clinal shifts of life history in a broadly distributed frog.
Cayuela H, Dorant Y, Forester BR, Jeffries DL, Mccaffery RM, Eby LA, Hossack BR, Gippet JMW, Pilliod DS, Chris Funk W. Cayuela H, et al. J Anim Ecol. 2022 Jun;91(6):1222-1238. doi: 10.1111/1365-2656.13545. Epub 2021 Jun 18. J Anim Ecol. 2022. PMID: 34048026 Free PMC article. - Evolutionary Dynamics of Abundant 7-bp Satellites in the Genome of Drosophila virilis.
Flynn JM, Long M, Wing RA, Clark AG. Flynn JM, et al. Mol Biol Evol. 2020 May 1;37(5):1362-1375. doi: 10.1093/molbev/msaa010. Mol Biol Evol. 2020. PMID: 31960929 Free PMC article. - Expression analysis of genes related to cold tolerance in Dendroctonus valens.
Zhao D, Zheng C, Shi F, Xu Y, Zong S, Tao J. Zhao D, et al. PeerJ. 2021 Mar 9;9:e10864. doi: 10.7717/peerj.10864. eCollection 2021. PeerJ. 2021. PMID: 33854828 Free PMC article. - Comparative Metabolomic Study of Drosophila Species with Different Lifespans.
Maslov DL, Zemskaya NV, Trifonova OP, Lichtenberg S, Balashova EE, Lisitsa AV, Moskalev AA, Lokhov PG. Maslov DL, et al. Int J Mol Sci. 2021 Nov 28;22(23):12873. doi: 10.3390/ijms222312873. Int J Mol Sci. 2021. PMID: 34884677 Free PMC article. - Transposable elements in Drosophila montana from harsh cold environments.
Tahami MS, Vargas-Chavez C, Poikela N, Coronado-Zamora M, González J, Kankare M. Tahami MS, et al. Mob DNA. 2024 Oct 1;15(1):18. doi: 10.1186/s13100-024-00328-7. Mob DNA. 2024. PMID: 39354634 Free PMC article.
References
- Amrein H. 2004. Pheromone perception and behavior in Drosophila. Curr Opin Neurobiol. 14(4):435–442. - PubMed
- Andersen JL, et al. 2015. How to assess Drosophila cold tolerance: chill coma temperature and lower lethal temperature are the best predictors of cold distribution limits. Funct Ecol. 29(1):55–65.
- Andersen MK, Jensen SO, Overgaard J.. 2017. Physiological correlates of chill susceptibility in Lepidoptera. J Insect Physiol. 98:317–326. - PubMed
- Benoit JB. 2010. Water management by dormant insects: comparisons between dehydration resistance during summer aestivation and winter diapause In: Aestivation. progress in molecular and subcellular biology. Berlin, Heidelberg: Springer; p. 209–229. - PubMed
Publication types
MeSH terms
LinkOut - more resources
Full Text Sources
Other Literature Sources
Molecular Biology Databases


