Signatures of photo-aging and intrinsic aging in skin were revealed by transcriptome network analysis - PubMed (original) (raw)
Signatures of photo-aging and intrinsic aging in skin were revealed by transcriptome network analysis
Byuri Angela Cho et al. Aging (Albany NY). 2018.
Abstract
There are various factors that alter physiological characteristics in skin. Elucidating the underlying mechanism of transcriptional alterations by intrinsic and extrinsic factors may lead us to understand the aging process of skin. To identify the transcriptomic changes of the aging skin, we analyzed publicly available RNA sequencing data from Genotype-Tissue Expression (GTEx) project. GTEx provided RNA sequencing data of suprapubic (n=228) and lower leg (n=349) skins, which are photo-protected and photo-damaged. Using differentially expressed gene analysis and weighted gene co-expression network analysis, we characterized transcriptomic changes due to UV exposure and aging. Genes involved in skin development such as epidermal differentiation complex component (SPRR and LCE families), vasculature development (TGFBR1, TGFBR2, TGFBR3, KDR, FGF2, and VEGFC), and matrix metalloproteinase (MMP2, MMP3, MMP8, MMP10, and MMP13) were up-regulated by UV exposure. Also, down-regulated lipid metabolism and mitochondrial biogenesis were observed in photo-damaged skin. Moreover, wound healing process was universally down-regulated in suprapubic and lower leg with aging and further down-regulation of lipid metabolism and up-regulation of vasculature development were found as photo-aging signatures. In this study, dynamic transcriptomic alterations were observed in aged skin. Hence, our findings may help to discover a potential therapeutic target for skin rejuvenation.
Keywords: Genotype-Tissues Expression project; RNA sequencing; intrinsic-aging; lower leg; photo-aging; suprapubic.
Conflict of interest statement
CONFLICTS OF INTEREST: The authors have no conflict of interest to declare.
Figures
Figure 1
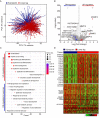
Transcriptome analysis of lower leg (UV exposed) and suprapubic (UV protected) skin samples. (A) Distinct separation of two groups was observed with principal component analysis. (B) Differentially expressed genes were displayed on the volcano plot. A few notable genes were marked. (C) Using differentially expressed genes, enriched pathways were shown in dot plot. Top 10 the most enriched pathways were used. Gene ratio = no. of genes that were enriched on the given pathway/ total no. of genes on the given gene set. _q_-value illustrated the significance. (D) Gene expression profiles of epidermal differentiation complex component genes (upper panel) and lipid metabolic process related genes (lower panel).
Figure 2
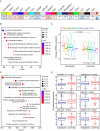
Weighted gene co-expression network analysis using all samples. (A) Module trait relationship of constructed modules. The statistically significant modules were marked with asterisk. The correlation values and Bonferroni-corrected _P_-values (in the bracket) were marked. (B) Pathway enrichment result for tan module. Top 10 the most enriched pathways were shown. (C) Estimated mitochondrial DNA copy number using mitochondrial RNA (mtRNA) expression level. Both tissues showed down-regulation of average mtRNA expression with aging (suprapubic: P for trend < 0.001 and lower leg: P for trend = 0.025). (D) Pathway enrichment result for blue module. Top 15 the most enriched pathways were used. (E) Relative gene expression levels of six angiogenesis related genes from blue module.
Figure 3
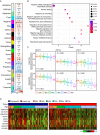
The common gene expression changes with aging in suprapubic and lower leg tissues. (A) Module trait relationship of constructed modules from lower leg. The statistically significant modules were marked with asterisk. The correlation values and Bonferroni-corrected _P_-values (in the bracket) were marked. (B) Pathway enrichment analysis of tan module. Top 10 the most enriched pathways were used. (C) The changes in gene expression level of three genes that play a role in heparan sulfate proteoglycan biosynthetic process in both tissues were shown. (D) Heatmap displays the expression level of nine genes that play a role in wound healing process in both tissues.
Figure 4
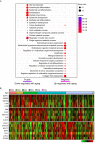
The gene expression alterations that are specific to lower leg. (A) Pathway enrichment analysis of purple and magenta modules. Top 15 the most enriched pathways were used. (B) Heatmap displays the gene expression changes with aging involved in lipid metabolism (top), water loss regulation via skin (middle), and vasculature development (bottom) in lower leg.
Similar articles
- Expression of extracellular matrix protein 1 (ECM1) in human skin is decreased by age and increased upon ultraviolet exposure.
Sander CS, Sercu S, Ziemer M, Hipler UC, Elsner P, Thiele JJ, Merregaert J. Sander CS, et al. Br J Dermatol. 2006 Feb;154(2):218-24. doi: 10.1111/j.1365-2133.2005.07001.x. Br J Dermatol. 2006. PMID: 16433788 - [The role of free radicals in the UV-induced skin damage. Photo-aging].
Emri G, Horkay I, Remenyik E. Emri G, et al. Orv Hetil. 2006 Apr 23;147(16):731-5. Orv Hetil. 2006. PMID: 16711258 Review. Hungarian. - [Skin aging].
Kohl E, Landthaler M, Szeimies RM. Kohl E, et al. Hautarzt. 2009 Nov;60(11):917-33; quiz 934. doi: 10.1007/s00105-009-1790-5. Hautarzt. 2009. PMID: 19898765 German. - [How the sun ages our skin. The dermis as the driving force].
Krutmann J. Krutmann J. Hautarzt. 2011 Aug;62(8):588-90. doi: 10.1007/s00105-011-2132-y. Hautarzt. 2011. PMID: 21786004 Review. German. - The effect of aging in primary human dermal fibroblasts.
Lago JC, Puzzi MB. Lago JC, et al. PLoS One. 2019 Jul 3;14(7):e0219165. doi: 10.1371/journal.pone.0219165. eCollection 2019. PLoS One. 2019. PMID: 31269075 Free PMC article.
Cited by
- Transcriptome-wide analysis reveals GYG2 as a mitochondria-related aging biomarker in human subcutaneous adipose tissue.
Ham M, Cho Y, Kang TW, Oh T, Kim HJ, Kim KH. Ham M, et al. Aging Cell. 2024 Feb;23(2):e14049. doi: 10.1111/acel.14049. Epub 2023 Dec 8. Aging Cell. 2024. PMID: 38062989 Free PMC article. - UV-induced reduction in Polycomb repression promotes epidermal pigmentation.
Li MY, Flora P, Pu H, Bar C, Silva J, Cohen I, Galbo PM Jr, Liu H, Yu X, Jin J, Koseki H, D'Orazio JA, Zheng D, Ezhkova E. Li MY, et al. Dev Cell. 2021 Sep 27;56(18):2547-2561.e8. doi: 10.1016/j.devcel.2021.08.006. Epub 2021 Sep 1. Dev Cell. 2021. PMID: 34473941 Free PMC article. - Protective effects of fucoidan purified from Undaria pinnatifida against UV-irradiated skin photoaging.
Jing R, Guo K, Zhong Y, Wang L, Zhao J, Gao B, Ye Z, Chen Y, Li X, Xu N, Xuan X. Jing R, et al. Ann Transl Med. 2021 Jul;9(14):1185. doi: 10.21037/atm-21-3668. Ann Transl Med. 2021. PMID: 34430626 Free PMC article. - Chemical Distance Measurement and System Pharmacology Approach Uncover the Novel Protective Effects of Biotransformed Ginsenoside C-Mc against UVB-Irradiated Photoaging.
Liu XY, Li H, Hwang E, Park B, Xiao YK, Liu S, Fang J, Kim YJ, Yi TH, Cai C. Liu XY, et al. Oxid Med Cell Longev. 2022 Feb 9;2022:4691576. doi: 10.1155/2022/4691576. eCollection 2022. Oxid Med Cell Longev. 2022. PMID: 35186187 Free PMC article. - Transcriptomic analysis of human skin wound healing and rejuvenation following ablative fractional laser treatment.
Sherrill JD, Finlay D, Binder RL, Robinson MK, Wei X, Tiesman JP, Flagler MJ, Zhao W, Miller C, Loftus JM, Kimball AB, Bascom CC, Isfort RJ. Sherrill JD, et al. PLoS One. 2021 Nov 29;16(11):e0260095. doi: 10.1371/journal.pone.0260095. eCollection 2021. PLoS One. 2021. PMID: 34843523 Free PMC article.
References
- Glass D, Viñuela A, Davies MN, Ramasamy A, Parts L, Knowles D, Brown AA, Hedman AK, Small KS, Buil A, Grundberg E, Nica AC, Di Meglio P, et al., and MuTHER consortium. Gene expression changes with age in skin, adipose tissue, blood and brain. Genome Biol. 2013; 14:R75. 10.1186/gb-2013-14-7-r75 - DOI - PMC - PubMed
MeSH terms
Substances
LinkOut - more resources
Full Text Sources
Other Literature Sources
Medical
Miscellaneous


