Glucose-regulated phosphorylation of TET2 by AMPK reveals a pathway linking diabetes to cancer - PubMed (original) (raw)
. 2018 Jul;559(7715):637-641.
doi: 10.1038/s41586-018-0350-5. Epub 2018 Jul 18.
Di Hu # 1 2, Hao Chen # 1 3, Guoming Shi # 1 2, Irfete S Fetahu 2, Feizhen Wu 1 2, Kimberlie Rabidou 2, Rui Fang 2, Li Tan 1, Shuyun Xu 4, Hang Liu 1, Christian Argueta 2, Lei Zhang 5, Fei Mao 6, Guoquan Yan 5, Jiajia Chen 5, Zhaoru Dong 1, Ruitu Lv 1, Yufei Xu 2, Mei Wang 2, Yong Ye 1, Shike Zhang 2, Danielle Duquette 2, Songmei Geng 4, Clark Yin 2, Christine Guo Lian 4, George F Murphy 4, Gail K Adler 2, Rajesh Garg 2, Lydia Lynch 2, Pengyuan Yang 5, Yiming Li 6, Fei Lan 1, Jia Fan 1, Yang Shi 1 3, Yujiang Geno Shi 7 8
Affiliations
- PMID: 30022161
- PMCID: PMC6430198
- DOI: 10.1038/s41586-018-0350-5
Glucose-regulated phosphorylation of TET2 by AMPK reveals a pathway linking diabetes to cancer
Di Wu et al. Nature. 2018 Jul.
Abstract
Diabetes is a complex metabolic syndrome that is characterized by prolonged high blood glucose levels and frequently associated with life-threatening complications1,2. Epidemiological studies have suggested that diabetes is also linked to an increased risk of cancer3-5. High glucose levels may be a prevailing factor that contributes to the link between diabetes and cancer, but little is known about the molecular basis of this link and how the high glucose state may drive genetic and/or epigenetic alterations that result in a cancer phenotype. Here we show that hyperglycaemic conditions have an adverse effect on the DNA 5-hydroxymethylome. We identify the tumour suppressor TET2 as a substrate of the AMP-activated kinase (AMPK), which phosphorylates TET2 at serine 99, thereby stabilizing the tumour suppressor. Increased glucose levels impede AMPK-mediated phosphorylation at serine 99, which results in the destabilization of TET2 followed by dysregulation of both 5-hydroxymethylcytosine (5hmC) and the tumour suppressive function of TET2 in vitro and in vivo. Treatment with the anti-diabetic drug metformin protects AMPK-mediated phosphorylation of serine 99, thereby increasing TET2 stability and 5hmC levels. These findings define a novel 'phospho-switch' that regulates TET2 stability and a regulatory pathway that links glucose and AMPK to TET2 and 5hmC, which connects diabetes to cancer. Our data also unravel an epigenetic pathway by which metformin mediates tumour suppression. Thus, this study presents a new model for how a pernicious environment can directly reprogram the epigenome towards an oncogenic state, offering a potential strategy for cancer prevention and treatment.
Conflict of interest statement
Competing interests Y.S. is cofounder of Constellation Pharmaceuticals, Inc and a member of its scientific advisory board. All other authors declare no competing financial interests.
Figures
Extended Data Fig. 1 |. Biochemical and molecular analysis of 5hmC and TET2 in response to glucose in primary blood cells and cultured cell lines.
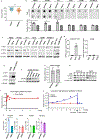
a, Dot blot comparison of global 5hmC levels between PBMC gDNA from 28 healthy donors and 29 patients with diabetes, **P = 0.0017. b, Genomic DNA extracted from several cell types cultured under high or normal glucose were dot blotted for 5hmC, *P = 0.022 (PBMC), 0.046 (HUVEC), 0.047 (TF-1). c, Western blot revealed that endogenous TET2 protein levels in PBMCs, HUVECs and TF-1 cells were higher when cultured in normal glucose than in high glucose. TET1 and TET3 protein levels were minimally detectable in these cell lines. d, e, RT–qPCR (d) and western blot (e) showed that TET2 dominated amongst the TET family in A2058-TET2WT cells. In A2058 cells, expression of all three genes was extremely low. f, Flag–TET2 protein levels in whole-cell lysates from A2058-TET2WT cells cultured in high glucose or normal glucose. g, Comparable levels of Flag–TET2 mRNA from A2058-TET2WT cells cultured in high glucose or normal glucose. h, Half-lives of Flag–TET2 in A2058-TET2WT cells cultured in high glucose or normal glucose. i, High glucose shock resulted in an acute increase in 5hmC in A2058-TET2WT cells followed by a rapid drop to baseline. j, Long-term culturing of A2058-TET2WT cells in normal glucose resulted in a sustained increase in 5hmC, which could be reversed by switching the medium to high glucose. See Supplementary Information for more details. k, Dot blot quantification of 5hmC levels in A2058-TET2WT, mock, A2058-TET2M, and A2058-TET2CD cell lines in Fig. 1e; **P = 0.0068. Data in b–k represent three biologically independent repeats each. Two-sided Student’s _t_-test, data shown as mean ± s.d. *P < 0.05, **P < 0.01. For gel source data, see Supplementary Fig. 1.
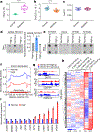
Extended Data Fig. 2 |. Genome-wide alterations in 5mC and 5hmC under normal glucose compared with high glucose.
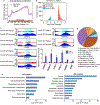
a, Normalized 5mC tag density distribution of A2058-TET2WT across gene bodies under high glucose (red) and normal glucose (blue). Each gene body was normalized relative to position percentage within the gene. In contrast to 5hmC (Fig. 1f), the 5mC landscape of A2058-TET2WT cells showed marginal differences between high and normal glucose conditions. b, Total peak numbers for differentially 5-hydroxymethylated regions (DhMRs) when comparing normal glucose to high glucose. We identified 30,217 DhMRs in total, among which the majority (>80%, ~24,537) were increased in normal glucose, whereas <20% were decreased. c, hMeDIP–qPCR validation of DhMRs in a group of cancer-related genes including CHEK1, CENPA, MCM7, CREB3L2, GABPB1 and COBLL1 in A2058-TET2WT cells under high or normal glucose conditions; n = 3 biologically independent repeats. d, Genome-wide distribution of increased DhMRs in annotated genomic regions in A2058-TET2WT cells under normal glucose compared to high glucose. The majority of the DhMRs (65.4%) localized to transcribed gene regions, with 9.56% in promoters and 55.84% in gene bodies. e, Gene ontology (GO, left) and disease ontology (DO, right) analysis of genes (n = 11,475) that had increased DhMRs in A2058-TET2WT cells under normal glucose compared to high glucose. These genes were enriched in pathways related to cancer.
Extended Data Fig. 3 |. Gene ontology and functional disease ontology analysis of genes that were transcriptionally regulated by glucose and TET2.
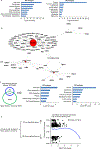
a, The 585 glucose-modulated and TET2-dependent genes (Fig. 1h) identified in A2058-TET2WT cells were analysed by gene ontology (left) and disease ontology (right). These genes are enriched in cell cycle pathways and are strongly correlated with cancers, including carcinoma, colon cancer, lung cancer and embryoma. b, Detailed disease ontology clustering of the 585 genes showed strong association with various cancer types. c, Two hundred and thirteen out of the 585 genes also had increased DhMRs in normal glucose as compared to high glucose. Further analysis of this gene subset by gene ontology and disease ontology showed that these genes are also highly associated with cell cycle functions and strongly correlated with cancers. d, Of these 213 genes with increased 5hmC and altered gene expression in response to glucose alterations, 124 were upregulated and 89 were downregulated. Consistent with the intricate role of 5hmC in gene regulation, correlation analysis revealed no significant relationship between increased 5hmC and gene upregulation.
Extended Data Fig. 4 |. Purification of full-length TET2 recombinant proteins and determination of TET2 S99 phosphorylation by AMPK.
a, SDS–PAGE gel showing the quality and quantity of recombinant TET2WT, TET2S99A, TET2SLF and TET2S1205A proteins. b, Representation of TET2 S99 phosphorylation levels, as detected by LC–MS/MS after in vitro kinase assay. The peak areas represent the abundance of peptides containing non-phosphorylated S99 (lower lane) or phosphorylated S99 (upper lane). The levels of S99 phosphorylation were much higher after the addition of AMPK in the in vitro kinase assay. c, Various amounts of unphosphorylated or phosphorylated TET2S99 peptides were spotted onto nitrocellulose membrane and detected by purified anti-TET2 pS99 antibody (right) or unpurified whole serum (left). The TET2pS99 antibody specifically recognized phosphorylated S99 peptides. Figures in a–c represent three biologically independent repeats each. d, Quantification of the radioactivity of AMPK phosphorylation. At the end of the phosphorylation assay, 20 μg of full-length Flag–TET2 WT and mutant proteins bound to beads were subjected to measurements by Liquid Scintillation Analyzer. The calculation is based on the specific activity of [_γ−_32P]ATP (800 c.p.m. per pmol) used and the calculated molar amounts of TET2 added to the assay tube. The stoichiometry is around 0.38 mol phosphates per mole of TET2WT. This number decreases markedly if the TET2 protein is mutated (S99A mutant or SLF mutant, both of which disrupt the AMPK-recognizing consensus sequence). TET2WT and the S1205A mutant had comparably high levels of phosphorylation. n = 3 biologically independent repeats, with data shown as mean ± s.d.
Extended Data Fig. 5 |. Increased AMPK activation, TET2 phosphorylation and TET2 stability in cells cultured with normal glucose.
a, Representations of TET2 S99 phosphorylation levels detected by LC–MS/MS in A2058-TET2WT cells cultured under high (left) or normal glucose (right). Flag–TET2 from A2058-TET2WT cells cultured under normal or high glucose was purified and then subjected to LC–MS/MS analysis. The peak areas represent the abundance of peptides that contained non-phosphorylated S99 (top) or phosphorylated S99 (bottom). The ratio was calculated as area(phosphorylated S99)/(area(phosphorylated S99) + area(non-phosphorylated S99)), which indicated the level of S99 phosphorylation. S99 phosphorylation (TET2pS99) in cells cultured in normal glucose was significantly higher than the phosphorylation levels observed in cells cultured under high glucose. Data are representative of three biologically independent repeats in each condition. b, A2058-TET2WT cells were switched from high to normal glucose for 0, 2 or 4 days. Results showed a steady increase in the levels of pAMPK as well as TET2pS99 and Flag–TET2 during this period. Data are representative of three biologically independent repeats. c, Western blot showing increased levels of TET2pS99 and pAMPK in cell lines (PBMC, HUVEC, TF-1) cultured under normal glucose versus high glucose. Data are representative of three biologically independent repeats. d, Western blot comparison of TET2, TET2pS99, and pAMPK levels between PBMCs from healthy donors and from patients with diabetes. TET2, TET2pS99 and pAMPK levels were significantly higher in healthy donors than in patients. Data are representative of three western blot repeats.
Extended Data Fig. 6 |. Effects of AMPK activators (A769662 and metformin) on TET2 protein stability and 5hmC levels.
a, A2058-TET2WT cells were treated with metformin and then immunoblotted with the indicated antibodies. Metformin treatment increased the levels of pAMPK, TET2pS99 and Flag–TET2. b, A2058-TET2WT cells were treated with 2 μM, 10 μM or 100 μM A769662 (an AMPK activator) for 30 min or 1 h, and then immunoblotted with the indicated antibodies. A769662 treatment increased pAMPK, TET2pS99 and Flag–TET2 levels. c, Quantification of normalized Flag–TET2WT half-life in A2058-TET2WT cells treated with CHX and with (+) or without (−) metformin (5 mM) in Fig. 3f. Metformin treatment increased the half-life of TET2. d, Left, CHX was used to measure the half-life of Flag–TET2 in A2058-TET2WT cells treated with (+) or without (−) A769662 (100 μM) in high glucose. Right, quantification of normalized Flag–TET2WT treated with CHX and with (+) or without (−) A769662. A769662 increased TET2 stability from 42% to 73% at 4 h after CHX treatment. Data in a–d are representative of three biologically independent repeats each. e, hMeDIP–qPCR showed that metformin treatment increased DhMRs to similar levels as observed in normal glucose in the previously validated genes in Extended Data Fig. 2c. n = 3 biologically independent repeats, data shown as mean ± s.d.
Extended Data Fig. 7 |. Effects of AMPK knockdown on 5hmC in cells expressing TET2WT, TET2S99A or TET2S99D.
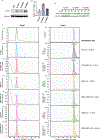
a, b, Western blot (a) and RT–qPCR (b) to measure TET2 protein and mRNA levels in cells expressing TET2WT, TET2S99A or TET2S99D. TET2S99A has the lowest protein level (a), but it has the highest mRNA level (b) amongst the three cell lines. c, Representations of HPLC–MS/MS analysis of genomic DNA from A2058 cells expressing TET2WT, TET2S99A or TET2S99D with or without AMPK knockdown (AMPK KD) in Fig. 3i. Left, chromatograms of 5hmC in cells expressing TET2WT or mutants with or without AMPK KD. Right, corresponding chromatograms of G. Total cytosine levels were estimated and equalized to the intensities of G. The ratios (right) were calculated as 5hmC intensity/G intensity, which indicated the cellular 5-hydroxymethylation level. 5hmC levels in A2058 cells expressing TET2WT, but not TET2S99A or TET2S99D, were decreased after AMPK KD. d, Comparison of the rescuing effects of calpain inhibitor on TET2WT, TET2S99A and TET2S99D. Data are representative of three biologically independent repeats in a, b, d and three technical repeats in c. Data shown as mean ± s.d.
Extended Data Fig. 8 |. In vitro characterization of the effects of glucose and the AMPK–TET2 axis on tumour suppression.
a. MTS proliferation assay shows that A2058-TET2WT cells grew significantly more slowly under normal glucose than under high glucose, but mock cells showed no difference; n = 5 biologically independent repeats, P = 5.68 × 10⁻⁵. b, TET2 was effectively knocked down (KD) in TF-1 cells, as confirmed by western blot (left) and RT–qPCR (right). c, TF-1 TET2 KD cells exhibited cytokine-independent growth under no cytokines, consistent with a previous report. d, Proliferation of TF-1 shControl and shTET2 cells treated with high or normal glucose under the indicated cytokine concentrations. TF-1 shControl proliferation was slower under the lower glucose condition, but TF-1 shTET2 cells showed no differential growth rates. P values (from left to right) are 0.0078, 1.94 × 10⁻⁵, 3.21 × 10⁻⁴, 0.0011, and 0.0091. a and d suggest that TET2 is a crucial point through which glucose levels affect tumour growth rates. n = 3 biologically independent repeats in b–d. e, Left, dot blot showing 5hmC levels in A2058-TET2WT, A2058-TET2S99A and mock cells with (+) and without (−) metformin (5 mM) treatment. Right, normalization of n = 5 biologically independent dot blot repeats; P = 0.026. f, MTS proliferation assay of A2058 cells expressing TET2WT, TET2S99A or mock treated with (+) or without (−) metformin (5 mM); n = 5 biologically independent repeats, P = 7.18 × 10⁻⁵. g, h, Soft agar growth of A2058-TET2WT, A2058-TET2S99A and mock cells treated with 0 mM, 2 mM or 4 mM metformin (g) and respective colony counting (h). P = 6.99 × 10⁻⁵ (top), 0.004 (middle), 0.0013 (bottom). i, j, mRNA (i) and protein (j) levels in MDA-MB-231 cells stably expressing mock, TET2WT or TET2S99A. k, l, Soft agar growth (k) and quantification (l) of MDA-MB-231 cells stably expressing mock, TET2WT or TET2S99A; n = 3 biologically independent repeats. The data suggest that TET2WT suppresses anchorage-independent tumour cell growth in vitro. Prevention of TET2 phosphorylation at S99 results in loss of this TET2-mediated suppression. Two-sided Student’s _t_-test, data shown as mean ± s.d. *P < 0.05, **P < 0.01, ****P < 0.0001.
Extended Data Fig. 9 |. The mouse study paradigm and examination of the regulatory function of the tumour-suppressive glucose–AMPK–TET2 axis in vivo.
a, Division of mice into eight groups. b, Outline of experimental procedure. In brief, nude mice were first induced to develop diabetes, and then transplanted with designated tumour cells. Tumour formation and sizes were documented continuously for three weeks, followed by histological and pathological examination. See more details in Supplementary Information. c, d, Growth curves of A2058-TET2WT and A2058 mock tumours in diabetic (c) and non-diabetic (d) nude mice, with and without metformin treatment. n = 5, P = 0.048 in c; n = 4–5, P = 0.0046 in d. e, f, Comparison between endpoint A2058-TET2WT and mock tumour sizes in diabetic and non-diabetic mice. Mice were treated either with (f) or without (e) metformin, n = 4–5. Tumours from diabetic TET2 groups were significantly larger than that from nondiabetic TET2 groups in both e and f. However, mock groups showed no difference between diabetic or non-diabetic conditions in either e or f. *P = 0.026 (bottom), ***P = 0.00043 (top) in e; **P = 0.0023 (bottom), ***P = 0.00013 (top) in f. g, Western blot showed successful TET2 knock down (A2058-TET2KD cells) in comparison with its TET2WT precursor. Data are representative of three biologically independent repeats. h, Growth curves of A2058-TET2WT and A2058-TET2KD tumours with and without metformin treatment, n = 4–5. The curve indicates that A2058-TET2KD tumours were no longer suppressed by metformin, and grew larger than A2058-TET2WT tumours; *P = 0.031. Two-sided Student’s _t_-test, data shown as mean ± s.e.m. *P < 0.05, **P < 0.01, ***P < < 0.001, ****P < 0.0001; ns, not significant.
Extended Data Fig. 10 |. 5hmC and pAMPK levels in tumour xenografts after metformin treatment in diabetic and non-diabetic mice.
a, Representative histology of pAMPK IHC staining in mock and A2058-TET2WT tumours treated with (+) or without (−) metformin (200×); pictures represent four different stained slides in each group. b, Representative histology of 5hmC IHC staining in mock and A2058-TET2WT tumours treated with (+) or without (−) metformin (200×); pictures represent four different stained slides in each group. All slides were counterstained with haematoxylin (light blue). c, d, Statistical analyses of the average score of pAMPK and 5hmC staining in mock and A2058-TET2WT tumours treated with or without metformin. Counts were done on 10 random fields in each group. Metformin treatment increased pAMPK in both mock and A2058-TET2WT tumours xenografted into diabetic and non-diabetic mice; ***P = 6.06 × 10⁻⁶ (1), **P = 0.0013 (2), ****P = 1.04 × 10⁻¹¹ (3), ****P = 3.53 × 10⁻⁶ (4). However, metformin increased 5hmC only in A2058-TET2WT tumours in diabetic and non-diabetic mice, with no increase in 5hmC in mock tumours under metformin treatment; **P = 0.0010 (5), **P = 0.028 (6). Box plot: centre lines, median; limits, upper and lower quartiles; top and bottom whiskers, minima and maxima. Two-sided Student’s _t_-test, data shown as mean ± s.d. *P < 0.05, **P < 0.01, ***P < 0.001, ****P < 0.0001.
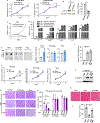
Fig. 1 |. Hyperglycaemia deregulates global DNA 5hmC levels, and this regulation requires a functional, full-length TET2.
a, Comparison of HbA1c between 28 healthy donors and 29 patients with diabetes. ****P = 2.88 × 10⁻¹⁵. Box plot: centre lines, median; limits, upper and lower quartiles; top and bottom whiskers, 10% and 90% percentiles; points, outliers. b, High-performance liquid chromatography with tandem mass spectrometry (HPLC–MS/MS) analysis of ratio of 5hmC to total C in randomly selected gDNA from 15 healthy donors and 18 patients. ****P = 7.44 × 10⁻⁵. c, HPLC–MS/MS analysis of ratio of 5mC to total C from the same samples as in b. d, Left, dot blot of 5hmC in DNA extracted from A2058-TET2WT cell line cultured in high glucose (high-g) or normal glucose (normal-g), or switched from normal to high glucose (high-g*). Right, quantification of dot blots. *P = 0.034 (high-g), P = 0.026 (high-g*). e, Dot blot comparison of 5hmC levels in A2058-TET2WT, mock (an A2058 cell line stably expressing empty vector), A2058-TET2M, and A2058-TET2CD cell lines cultured in high and normal glucose. f, Normalized hMeDIP–seq 5hmC tag density distribution across gene bodies in A2058-TET2WT cells cultured in high glucose (red) or normal glucose (blue). Each gene body was normalized relative to position percentage within the gene. g, hMeDIP–seq results of representative genes in which 5hmC is increased across the gene body in normal glucose. _y_-axis represents 5hmC density. h, Unguided clustering of genes that are differentially expressed when TET2 is present (in red frame) and not differentially expressed when TET2 is absent. Mut, A2058-TET2M. i, RT–qPCR validation of a subset of cancer-associated genes identified in h. Data represent three technical repeats in i and three biologically independent repeats in d, e. Two-sided Student’s _t_-test, data shown as mean ± s.d., *P < 0.05, ****P < 0.0001.
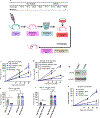
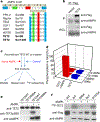
Fig. 2 |. TET2 is a substrate of AMPK, which specifically phosphorylates TET2 at S99.
a, Conserved AMPK recognition motif of several key AMPK target enzymes, including TET2. b, Co-immunoprecipitation showing that Flag–TET2 interacts with the activated form of AMPK (AMPKpT172). c, Flowchart of the in vitro kinase assay with different detection approaches. d, LC–MS/MS profiling of the in vitro AMPK kinase assay showed that TET2S99 is specifically phosphorylated in the presence of active AMPK. e, Immunoblot validation of TET2pS99 phosphorylation using a TET2pS99-specific antibody. f, Determination of TET2 phosphorylation at S99 via 32P-autoradiograph (SLF is a naturally occurring mutant that probably disrupts the AMPK binding site). Data represent three biologically independent repeats in b, e, f.
Fig. 3 |. Glucose regulates TET2 stability via the TET2pS99 phosphorylation switch, which is controlled by AMPK.
a, Left, immunoblot signal of phosphoserine 99 (TET2pS99) on Flag–TET2WT immunoprecipitated from cells cultured in high or normal glucose. Right, quantification of TET2pS99 signals normalized by total TET2, *P = 0.027. b, LC–MS/MS validation of pS99 levels in the cells under high and normal glucose, *P = 0.030. c, Normalized TET2, TET2pS99 and pAMPK levels in PBMCs from healthy donors and patients with diabetes; n = 6, ****P = 1.01 × 10⁻⁶ (TET2), **P = 0.0035 (TET2pS99), ***P = 5.26 × 10⁻⁴ (pAMPK). d, Flag–TET2WT half-life and pAMPK levels under normal glucose or normal glucose switched to high glucose. e, Left, dot blot showing 5hmC levels in A2058-TET2WT cells after treatment with 100 μM A769662 (an AMPK activator). Right, normalized quantification of dot blot signals; *P = 0.029. f, CHX treatment to measure the half-life of Flag–TET2WT in cells treated with (+) or without (−) metformin (Met; 5 mM). g, Effects of knocking down AMPK_α_2 on the protein stabilities of Flag–TET2WT and TET2S99A. Scr, scrambled shRNA. h, Half-lives of Flag–TET2S99D and TET2S99A. i, HPLC–MS/MS results showing the effects of knocking down AMPK_α_2 on 5hmC levels in TET2WT (**P = 0.006 (sh1), 0.003 (sh2)) cells and cells overexpressing TET2S99A or TET2S99D. Data represent three biologically independent repeats in a, b, d–i. Two-sided Student’s _t_-test, data shown as mean ± s.d., * P < 0.05, **P < 0.01, ***P < 0.001, ****P < 0.0001. For gel source data, see Supplementary Fig. 1.
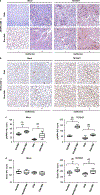
Fig. 4 |. Hyperglycaemia promotes xenografted tumour growth, which is suppressed by TET2 and further prevented by metformin.
a, b, Representative images of tumour-bearing diabetic (a) and nondiabetic (b) nude mice xenografted with A2058-TET2WT (left) or mock tumour cells (right) treated with (+) or without (−) metformin. c, d, Quantitative comparison of tumour size and efficacy of metformin’s tumour suppressive function on A2058-TET2WT and mock tumours in diabetic (c) and non-diabetic (d) nude mice. c, n = 5, ***P = 8.3 × 10⁻⁴ (TET2 versus mock), *P = 0.048 (TET2 versus TET2 + Met). d, n = 4–5, ****P = 5.2 × 10⁻⁶ (TET2 versus mock), 0.0046 (TET2 versus TET2 + Met). Two-sided Student’s _t_-test, data shown as mean ± s.e.m. *P < 0.05, **P < 0.01, ***P < 0.001, ****P < 0.0001; NS, not significant.
Comment in
- A sugar rush of DNA methylation.
Strzyz P. Strzyz P. Nat Rev Mol Cell Biol. 2018 Oct;19(10):617. doi: 10.1038/s41580-018-0051-9. Nat Rev Mol Cell Biol. 2018. PMID: 30061710 No abstract available. - AMPK Regulates the Epigenome through Phosphorylation of TET2.
Fiedler EC, Shaw RJ. Fiedler EC, et al. Cell Metab. 2018 Oct 2;28(4):534-536. doi: 10.1016/j.cmet.2018.09.015. Cell Metab. 2018. PMID: 30282044
Similar articles
- TET2 Drives 5hmc Marking of GATA6 and Epigenetically Defines Pancreatic Ductal Adenocarcinoma Transcriptional Subtypes.
Eyres M, Lanfredini S, Xu H, Burns A, Blake A, Willenbrock F, Goldin R, Hughes D, Hughes S, Thapa A, Vavoulis D, Hubert A, D'Costa Z, Sabbagh A, Abraham AG, Blancher C, Jones S, Verrill C, Silva M, Soonawalla Z, Maughan T, Schuh A, Mukherjee S, O'Neill E. Eyres M, et al. Gastroenterology. 2021 Aug;161(2):653-668.e16. doi: 10.1053/j.gastro.2021.04.044. Epub 2021 Apr 27. Gastroenterology. 2021. PMID: 33915173 - Structural insight into substrate preference for TET-mediated oxidation.
Hu L, Lu J, Cheng J, Rao Q, Li Z, Hou H, Lou Z, Zhang L, Li W, Gong W, Liu M, Sun C, Yin X, Li J, Tan X, Wang P, Wang Y, Fang D, Cui Q, Yang P, He C, Jiang H, Luo C, Xu Y. Hu L, et al. Nature. 2015 Nov 5;527(7576):118-22. doi: 10.1038/nature15713. Epub 2015 Oct 28. Nature. 2015. PMID: 26524525 - TET2-mediated 5-hydroxymethylcytosine of TXNIP promotes cell cycle arrest in systemic anaplastic large cell lymphoma.
Yu Z, Zhong L, Tang W, Zhang W, Lin T, Zhu W, Chen G, Wang J. Yu Z, et al. Clin Epigenetics. 2025 Jan 21;17(1):10. doi: 10.1186/s13148-025-01816-0. Clin Epigenetics. 2025. PMID: 39838392 Free PMC article. - The TET2 interactors and their links to hematological malignancies.
Pan F, Weeks O, Yang FC, Xu M. Pan F, et al. IUBMB Life. 2015 Jun;67(6):438-45. doi: 10.1002/iub.1389. Epub 2015 Jun 22. IUBMB Life. 2015. PMID: 26099018 Free PMC article. Review. - Epigenetic Function of TET Family, 5-Methylcytosine, and 5-Hydroxymethylcytosine in Hematologic Malignancies.
Li W, Xu L. Li W, et al. Oncol Res Treat. 2019;42(6):309-318. doi: 10.1159/000498947. Epub 2019 May 3. Oncol Res Treat. 2019. PMID: 31055566 Review.
Cited by
- Metformin effectively treats Tsc1 deletion-caused kidney pathology by upregulating AMPK phosphorylation.
Fang Y, Li F, Qi C, Mao X, Wang F, Zhao Z, Chen JK, Zhang Z, Wu H. Fang Y, et al. Cell Death Discov. 2020 Jun 15;6:52. doi: 10.1038/s41420-020-0285-0. eCollection 2020. Cell Death Discov. 2020. PMID: 32566257 Free PMC article. - Downregulation of 5-hydroxymethylcytosine is an early event in pancreatic tumorigenesis.
Fujikura K, Alruwaii ZI, Haffner MC, Trujillo MA, Roberts NJ, Hong SM, Macgregor-Das A, Goggins MG, Roy S, Meeker AK, Ding D, Wright M, He J, Hruban RH, Wood LD. Fujikura K, et al. J Pathol. 2021 Jul;254(3):279-288. doi: 10.1002/path.5682. Epub 2021 May 21. J Pathol. 2021. PMID: 33870509 Free PMC article. - Inferring the Cancer Cellular Epigenome Heterogeneity via DNA Methylation Patterns.
Li S. Li S. Cancer Treat Res. 2023;190:375-393. doi: 10.1007/978-3-031-45654-1_12. Cancer Treat Res. 2023. PMID: 38113008 - AMP-activated protein kinase links acetyl-CoA homeostasis to BRD4 recruitment in acute myeloid leukemia.
Jiang Y, Hu T, Wang T, Shi X, Kitano A, Eagle K, Hoegenauer KA, Konopleva MY, Lin CY, Young NL, Nakada D. Jiang Y, et al. Blood. 2019 Dec 12;134(24):2183-2194. doi: 10.1182/blood.2019001076. Blood. 2019. PMID: 31697807 Free PMC article. - The ageing epigenome and its rejuvenation.
Zhang W, Qu J, Liu GH, Belmonte JCI. Zhang W, et al. Nat Rev Mol Cell Biol. 2020 Mar;21(3):137-150. doi: 10.1038/s41580-019-0204-5. Epub 2020 Feb 4. Nat Rev Mol Cell Biol. 2020. PMID: 32020082 Review.
References
- Nathan DM Long-term complications of diabetes mellitus. N. Engl. J. Med 328, 1676–1685 (1993). - PubMed
- Gregg EW et al. Changes in diabetes-related complications in the United States, 1990–2010. N. Engl. J. Med 370, 1514–1523 (2014). - PubMed
- Giovannucci E et al. Diabetes and cancer: a consensus report. CA Cancer J. Clin 60, 207–221 (2010). - PubMed
- Chowdhury TA Diabetes and cancer. QJM 103, 905–915 (2010). - PubMed
- Brower V Illuminating the diabetes-cancer link. J. Natl Cancer Inst 104, 1048–1050 (2012). - PubMed
Publication types
MeSH terms
Substances
Grants and funding
- GM112062/NH/NIH HHS/United States
- R01 AI134861/AI/NIAID NIH HHS/United States
- K24 HL103845/HL/NHLBI NIH HHS/United States
- T32 HL007609/HL/NHLBI NIH HHS/United States
- CA194302/NH/NIH HHS/United States
- R01 CA194302/CA/NCI NIH HHS/United States
- R01 GM112062/GM/NIGMS NIH HHS/United States
LinkOut - more resources
Full Text Sources
Other Literature Sources
Medical
Molecular Biology Databases
