Cryo-EM of the dynamin polymer assembled on lipid membrane - PubMed (original) (raw)
Cryo-EM of the dynamin polymer assembled on lipid membrane
Leopold Kong et al. Nature. 2018 Aug.
Erratum in
- Author Correction: Cryo-EM of the dynamin polymer assembled on lipid membrane.
Kong L, Sochacki KA, Wang H, Fang S, Canagarajah B, Kehr AD, Rice WJ, Strub MP, Taraska JW, Hinshaw JE. Kong L, et al. Nature. 2018 Dec;564(7734):E6. doi: 10.1038/s41586-018-0612-2. Nature. 2018. PMID: 30377313 Free PMC article.
Abstract
Membrane fission is a fundamental process in the regulation and remodelling of cell membranes. Dynamin, a large GTPase, mediates membrane fission by assembling around, constricting and cleaving the necks of budding vesicles1. Here we report a 3.75 Å resolution cryo-electron microscopy structure of the membrane-associated helical polymer of human dynamin-1 in the GMPPCP-bound state. The structure defines the helical symmetry of the dynamin polymer and the positions of its oligomeric interfaces, which were validated by cell-based endocytosis assays. Compared to the lipid-free tetramer form2, membrane-associated dynamin binds to the lipid bilayer with its pleckstrin homology domain (PHD) and self-assembles across the helical rungs via its guanine nucleotide-binding (GTPase) domain3. Notably, interaction with the membrane and helical assembly are accommodated by a severely bent bundle signalling element (BSE), which connects the GTPase domain to the rest of the protein. The BSE conformation is asymmetric across the inter-rung GTPase interface, and is unique compared to all known nucleotide-bound states of dynamin. The structure suggests that the BSE bends as a result of forces generated from the GTPase dimer interaction that are transferred across the stalk to the PHD and lipid membrane. Mutations that disrupted the BSE kink impaired endocytosis. We also report a 10.1 Å resolution cryo-electron microscopy map of a super-constricted dynamin polymer showing localized conformational changes at the BSE and GTPase domains, induced by GTP hydrolysis, that drive membrane constriction. Together, our results provide a structural basis for the mechanism of action of dynamin on the lipid membrane.
Conflict of interest statement
Competing financial interests: The authors declare no competing financial interests.
Figures
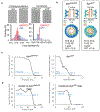
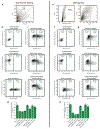
Extended Data Figure 1,. Cryo-EM parameters and data analysis.
a, Diameter distribution of dynamin tubes in the absence or presence of GMPPCP or GTP, scale bar 200 nm. Each experiment was repeated 3 independent times with similar results. b, Local resolution and helical parameters where R=rise, T-twist and SPT=subunits per helical turn. c, Gold standard FSC curves of the dynamin 3D maps. d, Model to map FSC curves. (Dotted blue line indicated the gold standard resolution at 0.5 FSC.)
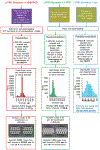
Extended Data Figure 2.. Cryo-EM data collection and processing flowchart.
Starting from the top, the flowchart details the pathways of three separate samples (red, green and blue) of dynamin protein through imaging and processing. The samples were imaged by two different microscopes, and then three different conformational states were selected manually. Each of these states were separately processed by Spider and then RELION. The red stars in the polymer diameter histograms indicate the diameters of the particles used for the final reconstructions. See Methods for details.
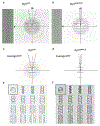
Extended Data Figure 3.. Dynamin helical tubes and their Fourier transforms.
a,b, Representative cryo-EM images (left) are shown of two dynamin polymers in different conformations. Each experiment was repeated 3 independent times with similar results. The Fourier transforms of the polymer images are displayed to the right. The strong layer lines associated with the pitch (red arrows) are highlighted. The distance of the layer lines from the meridian (m), highlighted by dotted black lines, indicate the dynGTP polymer is a 2-start helix, whereas the dynGMPPCP polymer is a 1-start helix. c,d, Power spectrum of 2D class averages from dynGTP and dynGMPPCP respectively, highlighting the differences between a 2-start and 1-start helix. e,f, Sections of the dynGMPPCP and dynGTP maps starting from the outside and going to the middle section. A top middle section looking down the center of the tubes is shown in the top right panels.
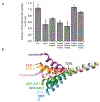
Extended Data figure 4,. Functional cell-based assays probing dynamin mutants and structural comparison of the BSE hinge.
a, Transferrin uptake of additional interface 3 mutants. Wild-type and K44A are shown for comparison. Mean and propagated standard deviation from N=3 biological replicates are shown. Also shown are single GFP(+) biological replicates that are each background subtracted and referenced to mean values (grey dots). Experiment was repeated and trends verified with N=2 biologically independent experiments. b, Comparison of α5G and α2B helices from dynGMPPCP (cryo-bent and cryo-unbent) and available crystal structures, including dynamin bound to GMPPCP (PCP 1 and 2, PDBID: 3ZYC), dynamin bound to GDP- AlF (GDP-AlF 1 and 2, PDBID: 2X2E) and dynamin bound to GDP (GDP 1 and 2, PDBID: 5D3Q). The number after each structure (1 or 2) represents the first or the second member of the dynamin dimer presented in each structure.
Extended Data Figure 5,. FACS gating.
To test the robustness of our gating, we used either side-scattering (a-d) or DAPI (e-h) to isolate single cells in two different experimental replicates. In both cases, single cells were isolated from debris (a, e). Single cells were then separated into GFP(−) and GFP(+) gates (b, c, f, g). Controls lacking transfection or transferrin uptake (b, f) informed gating choices. Inhibitory mutants exhibited characteristic dip in transferrin fluorescence in the GFP(+) cells (c, g). The exact fraction of transferrin uptake was dependent on GFP(+) gating choices (d, h) while qualitative trends were consistent. Mean and propagated standard deviation from N=3 biological replicates are shown. Also shown are single GFP(+) biological replicates that are each background subtracted and referenced to mean values (grey dots).
Extended Data Figure 6,. Comparison of dynGMPPCP and dynAPO at interface G2.
a, A large swing in the BSE of the tetramer in the Apo conformation (PDBID: 5A3F) disrupts interface G2. The Apo tetramer and cryo dynGMPPCP (GMPPCP-bound conformation) were aligned by the stalk. Curved arrow indicates the movement of the G domain. Domains are colored green for GTPase, pink for BSE, blue for stalk in monomer B, and purple for GTPase, orange for BSE, tan for stalk in monomer A. b, Interface G2, colored as above, in Cryo-EM map of dynGMPPCP (grey mesh).
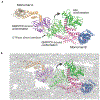
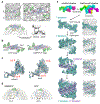
Figure 1,. Cryo-EM map of assembled dynamin in the GTP-bound state (GMPPCP) on membrane at 3.75 Å.
a, Cryo-EM images (left) of helical dynamin tubes were processed to generate a 3D map (right) and subsequently a model of the tetramer was built (domains colored green for GTPase, pink for BSE, blue for stalk and gold for PH) (EMDB-7957: PDBID 6DLU). Dashed red line indicate interface G2. N=3 independent experiments with similar results. b, Regions in map showing high resolution features, ß-sheet in the GTPase domain, GMPPCP molecule, and side chains of the L477-R453 helix in the stalk (box in c). c, Tetramer model of assembled dynamin with surrounding density and domains colored as described above. The assembly interfaces are labeled 1–3. d, Comparison of the crystal structure of dynamin in the apo state (colored as above) with our 3D map (grey).
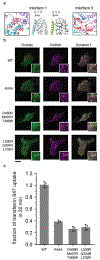
Figure 2,. Mutations in interface 1 and 3 inhibit endocytosis.
a, Interface 1 (L330R/Q334R/L702R) and interface 3 mutations (D406R/M407R/T488W) generated for endocytic assays. Middle panels, the dynGMPPCP polymer has a tighter interface 1 (blue, left) than the soluble crystal tetramer (right, green). Distances between stalks in interface 1 are shown above. b, TIRF images of dynamin and clathrin colocalization at the plasma membrane (N=2 independent experiments). Scale bar, 20 μm. Insets, 10 μm squares. c, Transferrin uptake is defective with interface 1 (L330R/Q334R/L702R) and interface 3 (D406R/M407R/T488W) mutations. Wild-type and K44A are shown for comparison. Mean and propagated standard deviation from N=3 biological replicates are shown with single replicates (grey dots) background subtracted and referenced to mean values. Trends were verified with N=2 biologically independent experiments (Extended Data Figure 5).
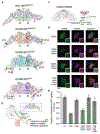
Figure 3,. Comparison of the BSE orientation in relationship to the GTPase domain dimer.
a, Asymmetry of GG domains in the cryo dynGMPPCP dimer reveals a unique kink (pink arrow) in the extended helix from the GTPase to the BSE (T274-E310, colored pink) in the monomer labeled B. Comparison of the GG crystal structures in different nucleotide states show a large swing of the BSE and a lack of unique kink in the extended helix in monomer B. From top to bottom: dynamin bound to GMPPCP (PDBID: 3ZYC), GDP/AlF (PDBID: 2X2E) and GDP (PDBID: 5D3Q). b, Overlay of cryo dynGMPPCP GG domains from monomer A and B illustrating the large asymmetry between the BSE domains (colored blue and yellow for bent and unbent respectively). Mutated residues T292/L293/P294 are highlighted in red. Sequence of the helix is shown on the right with helical propensity calculated by PROFphd (H: alpha-helix). Insert: flipped GG dimer in map. c, Left: A dynamin dimer model with both BSE unbent (pink). The normally bent dynamin has been replaced with an unbent dynamin aligned at the GTPase domain. Right: The PH domains associated with the bent and unbent BSEs resides in the stronger and weaker densities respectively. d, TIRF images of dynamin and clathrin colocalization at the plasma membrane (N=2 independent experiments). Scale bar, 20 μm. Insets, 10 μm squares. e, Transferrin uptake is defective in the helix stabilizing mutant (T292A/L293A/P294A). Wild-type and K44A are shown for comparison. Mean and propagated standard deviation from N=3 biological replicates are shown with single replicates (grey dots) background subtracted and referenced to mean values. Trends were verified with N=2 biologically independent experiments (Extended Data Figure 5).
Figure 4,. 3D map of assembled dynGTP on membrane at 10.1 Å in the super-constricted state.
a, In the presence of GTP, dynamin assembles as a 2-start helix (labeled 1 and 2). The strong PHD density associates with the bent BSE (EMDB-7958: PDB 6DLV). b, Comparison of dynGTP and dynGMPPCP structures aligned at unbent stalk with the dynGTP model in dynGTP density (left) and dynGMPPCP density (right). c, Comparison of GTPase-BSE domains from the dynGMPPCP and dynGTP show a ~3 Å shift in the BSE, and a 9.6 Å and 7.6 Å movement in the GTPase domains toward the membrane in the unbent and bent monomers respectively. d, A dynamin dimer model made with both BSEs unbent (pink). Comparison between the unbent dimer in the GMPPCP density (left) and GTP density (right) illustrates a potential compression of the dimer upon GTP hydrolysis. Distance between the PHDs is 73 Å compared to 46 Å for the dynGMPPCP and dynGTP models respectively. e, Model of dynamin assembly and constriction: The dynamin tetramer unfolds (monomers colored green, cyan, yellow and magenta) and wraps around the lipid tube in a GTP-bound state as a 1-start helix (teal) that is disrupted by GTP hydrolysis allowing for a second strand (purple) to assemble and form 2-start helix.
Similar articles
- Cryo-EM structures of membrane-bound dynamin in a post-hydrolysis state primed for membrane fission.
Jimah JR, Kundu N, Stanton AE, Sochacki KA, Canagarajah B, Chan L, Strub MP, Wang H, Taraska JW, Hinshaw JE. Jimah JR, et al. Dev Cell. 2024 Jul 22;59(14):1783-1793.e5. doi: 10.1016/j.devcel.2024.04.008. Epub 2024 Apr 24. Dev Cell. 2024. PMID: 38663399 - CryoEM structure of the super-constricted two-start dynamin 1 filament.
Liu J, Alvarez FJD, Clare DK, Noel JK, Zhang P. Liu J, et al. Nat Commun. 2021 Sep 13;12(1):5393. doi: 10.1038/s41467-021-25741-x. Nat Commun. 2021. PMID: 34518553 Free PMC article. - Alternate pleckstrin homology domain orientations regulate dynamin-catalyzed membrane fission.
Mehrotra N, Nichols J, Ramachandran R. Mehrotra N, et al. Mol Biol Cell. 2014 Mar;25(6):879-90. doi: 10.1091/mbc.E13-09-0548. Epub 2014 Jan 29. Mol Biol Cell. 2014. PMID: 24478459 Free PMC article. - Building a fission machine--structural insights into dynamin assembly and activation.
Chappie JS, Dyda F. Chappie JS, et al. J Cell Sci. 2013 Jul 1;126(Pt 13):2773-84. doi: 10.1242/jcs.108845. Epub 2013 Jun 18. J Cell Sci. 2013. PMID: 23781021 Free PMC article. Review. - Dynamin: functional design of a membrane fission catalyst.
Schmid SL, Frolov VA. Schmid SL, et al. Annu Rev Cell Dev Biol. 2011;27:79-105. doi: 10.1146/annurev-cellbio-100109-104016. Epub 2011 May 18. Annu Rev Cell Dev Biol. 2011. PMID: 21599493 Review.
Cited by
- The hypervariable region of atlastin-1 is a site for intrinsic and extrinsic regulation.
Kelly CM, Byrnes LJ, Neela N, Sondermann H, O'Donnell JP. Kelly CM, et al. J Cell Biol. 2021 Nov 1;220(11):e202104128. doi: 10.1083/jcb.202104128. Epub 2021 Sep 21. J Cell Biol. 2021. PMID: 34546351 Free PMC article. - Function and regulation of the divisome for mitochondrial fission.
Kraus F, Roy K, Pucadyil TJ, Ryan MT. Kraus F, et al. Nature. 2021 Feb;590(7844):57-66. doi: 10.1038/s41586-021-03214-x. Epub 2021 Feb 3. Nature. 2021. PMID: 33536648 Review. - Reconstitution and real-time quantification of membrane remodeling by single proteins and protein complexes.
Bashkirov PV, Kuzmin PI, Chekashkina K, Arrasate P, Vera Lillo J, Shnyrova AV, Frolov VA. Bashkirov PV, et al. Nat Protoc. 2020 Aug;15(8):2443-2469. doi: 10.1038/s41596-020-0337-1. Epub 2020 Jun 26. Nat Protoc. 2020. PMID: 32591769 Free PMC article. - Dynamin-2 R465W mutation induces long range perturbation in highly ordered oligomeric structures.
Hinostroza F, Neely A, Araya-Duran I, Marabolí V, Canan J, Rojas M, Aguayo D, Latorre R, González-Nilo FD, Cárdenas AM. Hinostroza F, et al. Sci Rep. 2020 Oct 23;10(1):18151. doi: 10.1038/s41598-020-75216-0. Sci Rep. 2020. PMID: 33097808 Free PMC article. - A Molecular Perspective on Mitochondrial Membrane Fusion: From the Key Players to Oligomerization and Tethering of Mitofusin.
De Vecchis D, Brandner A, Baaden M, Cohen MM, Taly A. De Vecchis D, et al. J Membr Biol. 2019 Oct;252(4-5):293-306. doi: 10.1007/s00232-019-00089-y. Epub 2019 Sep 4. J Membr Biol. 2019. PMID: 31485701 Review.
References
- Reubold TF et al. Crystal structure of the dynamin tetramer. Nature 525, 404–408 (2015). - PubMed
Additional References
- Zhang P & Hinshaw JE Three-dimensional reconstruction of dynamin in the constricted state. Nat Cell Biol 3, 922–926 (2001). - PubMed
Publication types
MeSH terms
Substances
LinkOut - more resources
Full Text Sources
Other Literature Sources
Molecular Biology Databases
Research Materials
