Single-cell analysis reveals that stochasticity and paracrine signaling control interferon-alpha production by plasmacytoid dendritic cells - PubMed (original) (raw)
doi: 10.1038/s41467-018-05784-3.
Nikita Subedi 3 4, Nicole van Buuringen 1, Daan Heister 1, Judith Vivié 5, Inge Beeren-Reinieren 1, Rob Woestenenk 6, Harry Dolstra 6, Aigars Piruska 7, Joannes F M Jacobs 8, Alexander van Oudenaarden 5, Carl G Figdor 1, Wilhelm T S Huck 7, I Jolanda M de Vries 1, Jurjen Tel 9 10 11
Affiliations
- PMID: 30127440
- PMCID: PMC6102223
- DOI: 10.1038/s41467-018-05784-3
Single-cell analysis reveals that stochasticity and paracrine signaling control interferon-alpha production by plasmacytoid dendritic cells
Florian Wimmers et al. Nat Commun. 2018.
Abstract
Type I interferon (IFN) is a key driver of immunity to infections and cancer. Plasmacytoid dendritic cells (pDCs) are uniquely equipped to produce large quantities of type I IFN but the mechanisms that control this process are poorly understood. Here we report on a droplet-based microfluidic platform to investigate type I IFN production in human pDCs at the single-cell level. We show that type I IFN but not TNFα production is limited to a small subpopulation of individually stimulated pDCs and controlled by stochastic gene regulation. Combining single-cell cytokine analysis with single-cell RNA-seq profiling reveals no evidence for a pre-existing subset of type I IFN-producing pDCs. By modulating the droplet microenvironment, we demonstrate that vigorous pDC population responses are driven by a type I IFN amplification loop. Our study highlights the significance of stochastic gene regulation and suggests strategies to dissect the characteristics of immune responses at the single-cell level.
Conflict of interest statement
The authors declare no competing interests.
Figures
Fig. 1
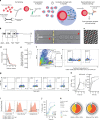
Single-cell analysis reveals functional heterogeneity within individually stimulated pDCs. a Schematic overview of the droplet microfluidic assay. The pDCs were coated with cytokine capture reagents, encapsulated in picoliter droplets, and stimulated with TLR ligands. After incubation, cells were stained for viability, cytokine, and surface marker expression, and analyzed by flow cytometry. b Schematic overview of the employed microfluidic chip with microscopic image of the flow-focusing nozzle for the encapsulation of cells in droplets. c Microscopic image of emulsion after droplet production. b, c Red arrows indicate cells. Scale bars equal 100 µm. d The pDCs were encapsulated at a concentration of 1,300,000 cells/mL in 92 pL droplets. The distribution of cells in droplets was measured by manual analysis of microscopic images showing the emulsion directly after production. Shown is the fraction of droplets plotted against the number of cells per droplet; n = 85, black line indicates median, red line indicates predicted values. e Shown is the fraction of cell-containing droplets with exactly one cell; n = 85. Lines indicate mean, hinges mark interquartile ranges, and whiskers reach to the highest/lowest value that is within 1.5 × interquartile range. f–k The pDCs were treated as described above and stimulated with 5 μg/mL or 50 µg/mL CpG-C. f Viable pDCs were detected by forward scatter (FSC) and side scatter (SSC) analysis and subsequent gating on CD14−CD19− and viability dye− cells. g IFNα- and TNFα-secreting cells were detected within that population. h Shown is the fraction of cytokine-secreting cells plotted against incubation time; n (5 µg/mL) = 3, n (50 µg/mL) = 6. i Surface marker-expressing pDCs were identified comparing the expression levels to fluorescence-minus-one controls. j Shown is the fraction of surface marker-expressing cells plotted against the incubation time; n > = 4. k The co-expression of CCR7, CD40, CD86, and TNFα by single IFNα+ and IFNα− pDCs was analyzed. Shown is the relative contribution of each functional response pattern to the total pDC population. h, j Dots indicate mean, error bars indicate SEM
Fig. 2
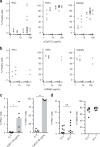
TLR-L concentration does not influence the fraction of IFNα-producing pDCs in droplets. a, b The pDCs were coated with capture reagent, encapsulated in picoliter droplets, and stimulated individually with a CpG-C or b R848 for 12 h. After staining for viability, surface marker expression and cytokine secretion, cytokine-secreting cells, and viable cells were detected via flow cytometry. Shown is the fraction of marker-expressing cells plotted against TLR ligand concentration. Different concentrations were tested in different donors; a n ≥ 3, b n ≥ 2. c The pDCs were treated as described above and stimulated with 0.01 µg/mL IL- 3 or 50 µg/mL CpG-C. Shown is the fraction of cytokine-secreting cells plotted against treatment condition; n = 5. Bars indicate mean. d The pDCs were treated as described above and stimulated with 50 µg/mL CpG-C for 12 h or 24 h. Shown is the fraction of IFNα-secreting or viable cells plotted against treatment condition; n = 8 (c, d) Mann–Whitney test *p < 0.05, **p < 0.01
Fig. 3
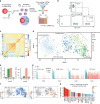
Single-cell RNA-sequencing identifies type I IFN-expressing cells early after activation. a The pDCs were coated with capture reagent, encapsulated in picoliter droplets, and stimulated individually with 50 µg/mL CpG-C for varying amounts of time. b After staining for surface marker expression and cytokine secretion, different pDC subsets were collected using fluorescence-activated cell sorting (FACS) and their transcriptomes were sequenced using the SORT-Seq protocol. c Heat map of the 774 cells that passed quality control filters representing transcriptome similarities as measured by Euclidean distance. The _k_-medoid clustering in combination with the raceID2 algorithm identified 8 distinct cell clusters. d t-SNE map showing all identified clusters. Different colors indicate clusters, different shapes indicate stimulation time. e The employed workflow allowed to link protein expression data acquired during FACS to the transcriptome data. The number of IFNα+ cells assigned to each cluster, and the percentage of sorted IFNα+ cells in each cluster, is plotted against the cluster name. f t-SNE map showing the fluorescence intensity of IFNα and TNFα as measured during FACS for each cell. g Shown are transcript counts for genes of the type I IFN response and the TNF gene in single cells stimulated for 2 h with CpG-C. IFNα+ cells, identified during FACS, are indicated in blue, other cells are shown in red. h Genes that were upregulated in cluster 5 compared to cells from all other clusters were detected (p < 10−8). Shown is the log2(fold change) for each gene. The color scale indicates the corresponding p value
Fig. 4
Type I IFN-expressing pDCs show unique gene expression patterns. a Differentially regulated genes in cells from all activated clusters compared to cluster 1 were identified. Differentially regulated genes from cluster 5. The average log2(count) of each gene is plotted against the log2(fold change) compared to cells in Cl1. Red color indicates p value < 10−8. **b** The top 30 most upregulated genes are shown for cluster 5. Shown is the log2 fold change for each gene. The color scale indicates the average log2(Count) for each transcript in Cl5. **c** Venn diagram of the upregulated genes (log2(fold change) > 1.5, p value < 10−8) within different clusters. d Lists of upregulated genes were submitted to DAVID for GO enrichment analysis and KEGG enrichment analysis. Heat maps show the most significantly enriched terms for the gene list from cluster 5. The color scale indicates the significance of enrichment of a particular term in all selected clusters after Benjamini–Hochberg correction for multiple testing
Fig. 5
Microenvironmental factors influence the fraction of IFNα-producing pDCs. a, b The pDCs were coated with cytokine capture reagents, encapsulated in droplets of varying size (b, scale bar equals 100 µm), and stimulated individually with 50 µg/mL CpG-C for 12 h. The distribution of cells in droplets was measured by manual analysis of microscopic images after production. After staining for viability and surface marker expression, viable cells and TNFα-positive cells were detected via flow cytometry. c Shown is the fraction of cell-containing droplets with exactly one cell; n > = 3. Lines indicate mean, hinges mark interquartile ranges, and whiskers reach to the highest/lowest value that is within 1.5 × interquartile range. d The fraction of IFNα-secreting pDCs was plotted against droplet volume. Dots of the same color indicate cells from the same donor. Gray dots are all originating from different donors. Linear regression was employed to calculate a trend line; n = 24. a, e The pDCs were stimulated in ~92 pL droplets with an increasing fraction of droplets containing more than 1 cell. f Shown is the fraction of IFNα-secreting cells plotted against the fraction of droplets containing more than 1 cell. Two models were generated to explain the observed pattern: (red) two random pDCs co-encapsulated in the same droplet can induce type I IFN production in each other; (blue) rare early type I IFN-producing cells can induce type I IFN production in conventional co-encapsulated cells. The root-square-mean error (RMSE) was calculated for both models to compare the fit to the data; n = 24. g Schematic overview of both models
Fig. 6
The pDCs primed with CM or IFNβ are more likely to produce IFNα. a Schematic overview of the priming experiment. The pDCs were stimulated for 2 h with conditioned medium (CM), 0.5 µg/mL CpG-C, or control medium. Cells were washed, coated with cytokine capture reagent, encapsulated in droplets, and stimulated individually with 0.01 µg/mL IL-3 or 50 µg/mL CpG-C for 12 h. CM was generated from bulk pDC cultures stimulated with 5 µg/mL CpG-C at a density of 25,000 cells/well. Cytokine-secreting cells were detected using flow cytometry. b The fraction of IFNα-secreting cells is plotted against different treatment conditions. c Co-expression of CCR7, CD40, CD86, and TNFα by single IFNα+ and IFNα− pDCs was analyzed. Shown is the relative contribution of each functional response pattern to the total pDC population. d The pDCs were primed with different concentrations of CM and stimulated with 50 µg/mL CpG-C. Shown is the fraction of IFNα-secreting cells plotted against CM concentration; n > = 3. Dots indicate mean and whiskers indicate SEM. e The pDCs were treated as described above, primed with 10% CM, and stimulated with different concentrations of CpG-C. Shown is the fraction of IFNα-secreting cells plotted against CpG-C concentration; n = 3. f The pDCs were primed with 10% CM, control medium, or 500 U/mL IFNβ, and stimulated with 50 µg/mL CpG-C. The fraction of IFNα-secreting cells is plotted against different treatment conditions; n > = 3. g Schematic model illustrating stochastic IFNα-production by pDCs. Few pDCs produce IFNα constitutively without stimulation by TLR ligands, here resembled by differentiation from a freshly isolated pDC (pDC0) to an IFNα-secreting pDC (pDC1). Literature indicates that this is not IRF7 dependent but NF-κB and AP-1. Upon TLR9 triggering the IRF7-dependent pathway is activated which also allows differentiation to IFNα-secreting pDC at a much higher rate. Despite involvement of the IRF7 pathway, still only very few pDCs produce IFNα. Paracrine signaling via the type I IFN receptor can increase this rate, probably via the upregulation of IRF7 expression, leading to a large fraction of cells expressing IFNα. After producing IFNα, pDCs become refractory to re-stimulation (pDC2) and eventually die (Φ). b, f Welch-corrected two-sample _t_-test; *p < 0.05, **p < 0.01
Similar articles
- TLR ligands upregulate RIG-I expression in human plasmacytoid dendritic cells in a type I IFN-independent manner.
Szabo A, Magyarics Z, Pazmandi K, Gopcsa L, Rajnavolgyi E, Bacsi A. Szabo A, et al. Immunol Cell Biol. 2014 Sep;92(8):671-8. doi: 10.1038/icb.2014.38. Epub 2014 May 20. Immunol Cell Biol. 2014. PMID: 24839978 - Regulation of type I interferon responses by mitochondria-derived reactive oxygen species in plasmacytoid dendritic cells.
Agod Z, Fekete T, Budai MM, Varga A, Szabo A, Moon H, Boldogh I, Biro T, Lanyi A, Bacsi A, Pazmandi K. Agod Z, et al. Redox Biol. 2017 Oct;13:633-645. doi: 10.1016/j.redox.2017.07.016. Epub 2017 Jul 29. Redox Biol. 2017. PMID: 28818792 Free PMC article. - Selective control of type I IFN induction by the Rac activator DOCK2 during TLR-mediated plasmacytoid dendritic cell activation.
Gotoh K, Tanaka Y, Nishikimi A, Nakamura R, Yamada H, Maeda N, Ishikawa T, Hoshino K, Uruno T, Cao Q, Higashi S, Kawaguchi Y, Enjoji M, Takayanagi R, Kaisho T, Yoshikai Y, Fukui Y. Gotoh K, et al. J Exp Med. 2010 Apr 12;207(4):721-30. doi: 10.1084/jem.20091776. Epub 2010 Mar 15. J Exp Med. 2010. PMID: 20231379 Free PMC article. - Type I Interferon Induction and Exhaustion during Viral Infection: Plasmacytoid Dendritic Cells and Emerging COVID-19 Findings.
Greene TT, Zuniga EI. Greene TT, et al. Viruses. 2021 Sep 15;13(9):1839. doi: 10.3390/v13091839. Viruses. 2021. PMID: 34578420 Free PMC article. Review. - Plasmacytoid dendritic cells in the skin: to sense or not to sense nucleic acids.
Conrad C, Meller S, Gilliet M. Conrad C, et al. Semin Immunol. 2009 Jun;21(3):101-9. doi: 10.1016/j.smim.2009.01.004. Epub 2009 Feb 27. Semin Immunol. 2009. PMID: 19250840 Review.
Cited by
- Plasmacytoid dendritic cells at the forefront of anti-cancer immunity: rewiring strategies for tumor microenvironment remodeling.
Monti M, Ferrari G, Gazzurelli L, Bugatti M, Facchetti F, Vermi W. Monti M, et al. J Exp Clin Cancer Res. 2024 Jul 17;43(1):196. doi: 10.1186/s13046-024-03121-9. J Exp Clin Cancer Res. 2024. PMID: 39020402 Free PMC article. Review. - Single-cell analysis in rheumatic and allergic diseases: insights for clinical practice.
Nishide M, Shimagami H, Kumanogoh A. Nishide M, et al. Nat Rev Immunol. 2024 Nov;24(11):781-797. doi: 10.1038/s41577-024-01043-3. Epub 2024 Jun 24. Nat Rev Immunol. 2024. PMID: 38914790 Review. - Microheterogeneity in the Kinetics and Sex-Specific Response to Type I IFN.
Gal-Oz ST, Baysoy A, Vijaykumar B, Mostafavi S, Benoist C, Shay T; Immunological Genome Project. Gal-Oz ST, et al. J Immunol. 2024 Jul 1;213(1):96-104. doi: 10.4049/jimmunol.2300453. J Immunol. 2024. PMID: 38775402 - Unraveling IFN-I response dynamics and TNF crosstalk in the pathophysiology of systemic lupus erythematosus.
Van Eyndhoven LC, Chouri E, Matos CI, Pandit A, Radstake TRDJ, Broen JCA, Singh A, Tel J. Van Eyndhoven LC, et al. Front Immunol. 2024 Mar 26;15:1322814. doi: 10.3389/fimmu.2024.1322814. eCollection 2024. Front Immunol. 2024. PMID: 38596672 Free PMC article. - The population context is a driver of the heterogeneous response of epithelial cells to interferons.
Metz-Zumaran C, Uckeley ZM, Doldan P, Muraca F, Keser Y, Lukas P, Kuropka B, Küchenhoff L, Rastgou Talemi S, Höfer T, Freund C, Cavalcanti-Adam EA, Graw F, Stanifer M, Boulant S. Metz-Zumaran C, et al. Mol Syst Biol. 2024 Mar;20(3):242-275. doi: 10.1038/s44320-024-00011-2. Epub 2024 Jan 25. Mol Syst Biol. 2024. PMID: 38273161 Free PMC article.
References
Publication types
MeSH terms
Substances
Grants and funding
- PhD grant/Radboud Universitair Medisch Centrum (Radboudumc)/International
- 863.130.24/Nederlandse Organisatie voor Wetenschappelijk Onderzoek (Netherlands Organisation for Scientific Research)/International
- 863.130.24/Nederlandse Organisatie voor Wetenschappelijk Onderzoek (Netherlands Organisation for Scientific Research)/International
- 863.130.24/Nederlandse Organisatie voor Wetenschappelijk Onderzoek (Netherlands Organisation for Scientific Research)/International
- Spinoza Award/Nederlandse Organisatie voor Wetenschappelijk Onderzoek (Netherlands Organisation for Scientific Research)/International
- Spinoza award/Nederlandse Organisatie voor Wetenschappelijk Onderzoek (Netherlands Organisation for Scientific Research)/International
- 863.130.24/Nederlandse Organisatie voor Wetenschappelijk Onderzoek (Netherlands Organisation for Scientific Research)/International
- 024.001.035/Ministerie van Onderwijs, Cultuur en Wetenschap (Ministry of Education, Culture and Science, Netherlands)/International
- 024.001.035/Ministerie van Onderwijs, Cultuur en Wetenschap (Ministry of Education, Culture and Science, Netherlands)/International
- 2009-4402/KWF Kankerbestrijding (Dutch Cancer Society)/International
LinkOut - more resources
Full Text Sources
Other Literature Sources


