Integrated genomic and fossil evidence illuminates life's early evolution and eukaryote origin - PubMed (original) (raw)
Integrated genomic and fossil evidence illuminates life's early evolution and eukaryote origin
Holly C Betts et al. Nat Ecol Evol. 2018 Oct.
Abstract
Establishing a unified timescale for the early evolution of Earth and life is challenging and mired in controversy because of the paucity of fossil evidence, the difficulty of interpreting it and dispute over the deepest branching relationships in the tree of life. Surprisingly, it remains perhaps the only episode in the history of life where literal interpretations of the fossil record hold sway, revised with every new discovery and reinterpretation. We derive a timescale of life, combining a reappraisal of the fossil material with new molecular clock analyses. We find the last universal common ancestor of cellular life to have predated the end of late heavy bombardment (>3.9 billion years ago (Ga)). The crown clades of the two primary divisions of life, Eubacteria and Archaebacteria, emerged much later (<3.4 Ga), relegating the oldest fossil evidence for life to their stem lineages. The Great Oxidation Event significantly predates the origin of modern Cyanobacteria, indicating that oxygenic photosynthesis evolved within the cyanobacterial stem lineage. Modern eukaryotes do not constitute a primary lineage of life and emerged late in Earth's history (<1.84 Ga), falsifying the hypothesis that the Great Oxidation Event facilitated their radiation. The symbiotic origin of mitochondria at 2.053-1.21 Ga reflects a late origin of the total-group Alphaproteobacteria to which the free living ancestor of mitochondria belonged.
Conflict of interest statement
Competing interests
The authors declare no competing interests.
Figures
Figure 1
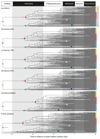
Posterior time estimates when using (a) a Uniform calibration density prior distribution, reflecting a lack of information about the divergence time relative to the fossil constraint, (b) a Cauchy 50% maximum calibration density prior distribution, reflecting a view that the divergence date should fall between the constraints, (c) a Cauchy 10% maximum calibration density prior distribution, reflecting a view that the fossil prior is a good approximation of the divergence date and (d) a Cauchy 90% maximum calibration density prior distribution, reflecting a view that the fossil prior is a poor approximation of the divergence date, all with an uncorrelated clock model. Then posterior age estimates when using (e) a Cauchy 50% maximum calibration density prior distribution with an autocorrelated clock model and finally, (f) a Cauchy 50% maximum calibration density prior distribution, with an uncorrelated clock model and a single partition scheme. All molecular clock analysis converged well. The coloured dots highlight specific nodes with their respective confidence intervals displayed as bars in light blue; orange (LUCA), red (crown Archaeabacteria), blue (crown Eubacteria), yellow (crown Eukaryota), pink (alphaproterobacteria) and dark blue (cyanobacteria). This figure illustrates how divergence times change as alternative approaches to modelling calibrations and the process of molecular revolution change. Divergence estimates from Figure 1f and their credibility intervals could be rejected based on an AIC test. The other results (Figure 1a-e) cannot be rejected.
Figure 2
Changes in divergence times (billions of years before present) that result from applying alternative strategies, (a) Cauchy 50% maximum calibration density prior distribution vs Uniform calibration density prior distribution, (b) Cauchy 50% maximum calibration density prior distribution vs Cauchy 10% maximum calibration density prior distribution, (c) Cauchy 50% maximum calibration density prior distribution vs Cauchy 90% maximum calibration density prior distribution, (d) Cauchy 50% maximum calibration density prior distribution uncorrelated clock model vs Cauchy 50% maximum calibration density prior distribution autocorrelated clock model, (e) Cauchy 50% maximum calibration density prior distribution in both cases, 29 partition scheme vs 1 partition scheme. The lower row displays the results of adding additional genes as infinite sites plots, (f) 5 gene dataset, (g) 10 gene dataset, (h) 15 gene dataset, (i) 20 gene dataset and (j) 29 gene dataset. In all cases blue dots denote the node dates.
Figure 3
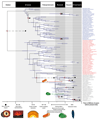
A tree combining uncertainties from approaches using uncorrelated and autocorrelated clock models and different calibration density distributions showing tip labels for Eukaryota (grey), Archaeabacteria (red), and Eubacteria (blue). The purple bars denote the credible intervals for each node. Red dots highlight calibrated nodes and the corresponding black dot highlights the age of the minimum bound of its corresponding calibration. The phylogenetic relationships of the mitochondrion within Alphaproteobacteria are still debated,–, and it is unclear whether the free-living ancestor of the mitochondrion was a crown or a stem representative of this group. The pink and red bars above the crown eukaryote node denote the time period in which crown alphaproteobacteria and stem alphaproteobacteria respectively were also present, and therefore in such time that the mitochondrial endosymbiosis may have occurred. The green bar lower down denotes the time in which the plastid endosymbiosis may have occurred. Some important events in the Earth’s and life’s history are indicated along the base of the figure.
Comment in
- A new timeline of life's early evolution.
York A. York A. Nat Rev Microbiol. 2018 Oct;16(10):582-583. doi: 10.1038/s41579-018-0080-6. Nat Rev Microbiol. 2018. PMID: 30143748 No abstract available.
Similar articles
- The neomuran origin of archaebacteria, the negibacterial root of the universal tree and bacterial megaclassification.
Cavalier-Smith T. Cavalier-Smith T. Int J Syst Evol Microbiol. 2002 Jan;52(Pt 1):7-76. doi: 10.1099/00207713-52-1-7. Int J Syst Evol Microbiol. 2002. PMID: 11837318 Review. - Frameworks for Interpreting the Early Fossil Record of Eukaryotes.
Porter SM, Riedman LA. Porter SM, et al. Annu Rev Microbiol. 2023 Sep 15;77:173-191. doi: 10.1146/annurev-micro-032421-113254. Annu Rev Microbiol. 2023. PMID: 37713454 Review. - A genomic timescale for the origin of eukaryotes.
Hedges SB, Chen H, Kumar S, Wang DY, Thompson AS, Watanabe H. Hedges SB, et al. BMC Evol Biol. 2001;1:4. doi: 10.1186/1471-2148-1-4. Epub 2001 Sep 12. BMC Evol Biol. 2001. PMID: 11580860 Free PMC article. - Dating Alphaproteobacteria evolution with eukaryotic fossils.
Wang S, Luo H. Wang S, et al. Nat Commun. 2021 Jun 3;12(1):3324. doi: 10.1038/s41467-021-23645-4. Nat Commun. 2021. PMID: 34083540 Free PMC article. - Molecular fossils probe life's origins. Research into molecular fossils and modern viruses is shedding light on the evolution of archaea, prokaryotes and eukaryotes.
Hunter P. Hunter P. EMBO Rep. 2013 Nov;14(11):964-7. doi: 10.1038/embor.2013.162. Epub 2013 Oct 15. EMBO Rep. 2013. PMID: 24126762 Free PMC article. No abstract available.
Cited by
- GTP before ATP: The energy currency at the origin of genes.
Mrnjavac N, Martin WF. Mrnjavac N, et al. Biochim Biophys Acta Bioenerg. 2025 Jan 1;1866(1):149514. doi: 10.1016/j.bbabio.2024.149514. Epub 2024 Sep 24. Biochim Biophys Acta Bioenerg. 2025. PMID: 39326542 Free PMC article. Review. - Gene gain facilitated endosymbiotic evolution of Chlamydiae.
Dharamshi JE, Köstlbacher S, Schön ME, Collingro A, Ettema TJG, Horn M. Dharamshi JE, et al. Nat Microbiol. 2023 Jan;8(1):40-54. doi: 10.1038/s41564-022-01284-9. Epub 2023 Jan 5. Nat Microbiol. 2023. PMID: 36604515 Free PMC article. - Host Range and Coding Potential of Eukaryotic Giant Viruses.
Sun TW, Yang CL, Kao TT, Wang TH, Lai MW, Ku C. Sun TW, et al. Viruses. 2020 Nov 21;12(11):1337. doi: 10.3390/v12111337. Viruses. 2020. PMID: 33233432 Free PMC article. Review. - On the Origin of Iron/Sulfur Cluster Biosynthesis in Eukaryotes.
Tsaousis AD. Tsaousis AD. Front Microbiol. 2019 Nov 8;10:2478. doi: 10.3389/fmicb.2019.02478. eCollection 2019. Front Microbiol. 2019. PMID: 31781051 Free PMC article. - Divergent genomic trajectories predate the origin of animals and fungi.
Ocaña-Pallarès E, Williams TA, López-Escardó D, Arroyo AS, Pathmanathan JS, Bapteste E, Tikhonenkov DV, Keeling PJ, Szöllősi GJ, Ruiz-Trillo I. Ocaña-Pallarès E, et al. Nature. 2022 Sep;609(7928):747-753. doi: 10.1038/s41586-022-05110-4. Epub 2022 Aug 24. Nature. 2022. PMID: 36002568 Free PMC article.
References
- dos Reis M, Donoghue PCJ, Yang Z. Bayesian molecular clock dating of species divergences in the genomics era. Nat Rev Genet. 2016;17:71–80. - PubMed
- Wacey D. Early life on earth: a practical guide. Vol. 31 Springer Science & Business Media; 2009.
- Inoue J, Donoghue PCJ, Yang Z. The impact of the representation of fossil calibrations on Bayesian estimation of species divergence times. Systematic Biology. 2009;59:74–89. - PubMed
Publication types
MeSH terms
LinkOut - more resources
Full Text Sources
Other Literature Sources


