Common Bean Subtelomeres Are Hot Spots of Recombination and Favor Resistance Gene Evolution - PubMed (original) (raw)
Common Bean Subtelomeres Are Hot Spots of Recombination and Favor Resistance Gene Evolution
Nicolas W G Chen et al. Front Plant Sci. 2018.
Abstract
Subtelomeres of most eukaryotes contain fast-evolving genes usually involved in adaptive processes. In common bean (Phaseolus vulgaris), the Co-2 anthracnose resistance (R) locus corresponds to a cluster of nucleotide-binding-site leucine-rich-repeat (NL) encoding sequences, the prevalent class of plant R genes. To study the recent evolution of this R gene cluster, we used a combination of sequence, genetic and cytogenetic comparative analyses between common bean genotypes from two distinct gene pools (Andean and Mesoamerican) that diverged 0.165 million years ago. Co-2 is a large subtelomeric cluster on chromosome 11 comprising from 32 (Mesoamerican) to 52 (Andean) NL sequences embedded within khipu satellite repeats. Since the recent split between Andean and Mesoamerican gene pools, the Co-2 cluster has experienced numerous gene-pool specific NL losses, leading to distinct NL repertoires. The high proportion of solo-LTR retrotransposons indicates that the Co-2 cluster is located in a hot spot of unequal intra-strand homologous recombination. Furthermore, we observe large segmental duplications involving both Non-Homologous End Joining and Homologous Recombination double-strand break repair pathways. Finally, the identification of a Mesoamerican-specific subtelomeric sequence reveals frequent interchromosomal recombinations between common bean subtelomeres. Altogether, our results highlight that common bean subtelomeres are hot spots of recombination and favor the rapid evolution of R genes. We propose that chromosome ends could act as R gene incubators in many plant genomes.
Keywords: Phaseolus vulgaris (common bean); evolution; homologous recombination (HR); non-homologous end-joining (NHEJ); resistance gene; satellite; segmental duplication; subtelomere.
Figures
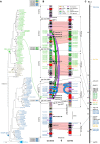
FIGURE 1
Phylogenetic analysis, physical and genetic maps of CNL genes. (A) ML tree of CNLs of the Co-2 region. This tree was constructed using the CNL NB domains (from the P-loop to the MHD motif). Numbers at nodes indicate posterior probabilities (only > 50% are indicated). CNL names are colored according to major CNL1 (green) CNL2 (gray) and CNL3/4 (blue) clades. Gene names are abbreviated as follows: Gm, G. max; Gt, G. tomentella; PvA (or 11G when only found in WGS sequence) P. vulgaris Andean accession G19833; PvM, P. vulgaris Mesoamerican accession BAT93. (B) Physical map of the Co-2 region in G19833 (Andean) and BAT93 (Mesoamerican) common bean genotypes. Arrows represent predicted genes, CNL segments, or khipu blocks and their orientation. CNL names and conserved low-copy genes (A to L) are listed on the flanks. NL retrieved outside sequenced contigs in G19833 WGS sequence are represented by arrows in boxes with corresponding names, to the left of G19833 sequenced contigs (not drawn to scale). Markers used for genetic mapping (black) and number of khipu repeats in a block (red) are listed in the inside. Fill colors of CNL genes correspond to the colors of the clades defined in (A). Horizontal lines represent alleles of low-copy (black), CNL1 (green), CNL3/4 (blue) or TNL (yellow) genes. Red-filled zones correspond to regions strictly collinear based on low-copy and CNL alleles. Curved green, gray, or blue lines represent segmental green, gray, or blue duplication events, respectively. Green and gray arrowheads indicate the putative orientation of green and gray event, respectively. The large orange arrow represents the 34 kb SD from the Co-2 cluster to chromosome 10. Black arrowheads at the right side of G19833 contigs point to corresponding junctions at the edge of segmental duplications. These junctions are detailed in Figure 4. (C) Genetic map of the Co-2 locus (LG B11). Markers are listed on the right. Green and blue text correspond to the CNL1 and CNL3/4, respectively. Red text corresponds to resistance genes. Genetic distances between each marker are indicated on the left in Kosambi cM. An asterisk has been added at the end of CNL sequence names corresponding to pseudogenes.
FIGURE 2
Pachytene FISH mapping of multiple probes at the end of chromosome 11 in common bean genotypes G19833 and JaloEEP558 (Andean) and BAT93 (Mesoamerican). These experiments were done at least twice for each genotype with similar results, except for G19833 because it was highly difficult to obtain buds containing cells at the pachytene stage from this genotype. The number of loci for each probe was confirmed in at least three cells per experiment. Bars = 10 _μ_m. (a) Black-white-converted image showing the end of chromosome 11 stained with DAPI. Terminal knob is indicated by a white star. (b) khipu satellite (red). (c) 45S rDNA (light blue). For G19833, cells were too much damaged for analyzing 45S rDNA. (d) FISH-CNL1 probe (green). The large CNL1 signal corresponding to the Co-2 cluster is indicated by a green star. (e) FISH-CNL3/4 probe (blue). The large CNL3/4 signal corresponding to the Co-2 cluster is indicated by a blue star. Additional CNL3/4 loci are indicated by blue arrowheads. (f) FISH-TNL-7 probe (yellow). Loci are indicated by yellow arrowheads. (g) Overview of FISH-CNL1 (green), FISH-CNL3/4 (blue), FISH-TNL-7 (yellow), khipu (red) and 45S rDNA (light blue). The main CNL1 and CNL3/4 clusters (corresponding to region sequenced in Figure 1) are indicated by a green star and a blue star, respectively. Additional CNL3/4 and TNL-7 loci are indicated by blue and yellow arrowheads, respectively. (h) FISH-CNL3/4 probe without DAPI counterstaining. The terminal FISH-CNL3/4 signals are boxed. The main CNL3/4 cluster is indicated by a blue star. Additional CNL3/4 loci are indicated by blue arrowheads. (i) Diagrammatic representation of cytogenetic maps of chromosome 11 long arm terminal region, and hypothetical model of evolution. Chromosomes are in gray, and colors are the same as described above. Curved lines represent minimal putative ectopic segmental duplications involving TNL-7 (yellow), CNL3/4 (blue), and khipu (red).
FIGURE 3
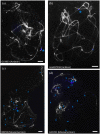
Localization of FISH-CNL3/4 probe on pachytene chromosomes of common bean genotypes from the Andean and Mesoamerican gene pools. Chromosomes are counterstained with DAPI (gray), and FISH-CNL3/4 signals are in blue. The Co-2 locus is indicated by a blue star, and FISH-CNL3/4-labeled terminal knobs are indicated by blue arrowheads. (a) G19833 (Andean), (b) JaloEEP558 (Andean), (c) BAT93 (Mesoamerican), (d) G11051 (Mesoamerican). These experiments were done at least twice for each genotype with similar results. The number of loci for each probe was confirmed in at least three cells per experiment. Bars = 10 μm.
FIGURE 4
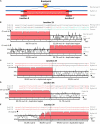
Analysis of junctions from SD‘ events at Co-2 subtelomeric region of chromosome 11 long arm. (A) Simplified summary model describing the resulting stages of a SD event. The double-strand break occurs somewhere in the recipient (blue) molecule. Before repair, partial digestion of the breakpoint borders may occur, leading to loss of sequence. During the repair process, there is a duplicative invasion of the recipient molecule by the donor (red) molecule. Black short lines represent the regions that has to be aligned to accurately resolve the junctions (X and Y) between the broken molecule (recipient) and the duplicated region (donor), resulting in the final hybrid molecule. For more detailed information on double-strand break repair models, please refer to Puchta (2005) and Fiston-Lavier et al. (2007). (B–E) Nucleotide alignment at junctions 1X, 2X, 3X, and 3Y, respectively. Sequences are named according to their corresponding contigs. Aligned matching bases are red. For larger-scale vizualization, the 1000 bp surrounding region was analyzed using mVISTA (Mayor et al., 2000) after indels removal. Identity between sequences is indicated in %. Regions with identity equal or above 70% in 10bp windows are filled in red. Note that when the hybrid molecule is retained in the progeny, the recipient molecule is lost and a putative recipient molecule has to be found in another genotype to help resolving the breakpoint event. Therefore in (B) we used PvM11B contig from BAT93 genotype to help resolving junction 1X from an SD that occurred between PvA11B and PvA11C contigs in G19833 genotype. For junctions 2X (C), 3X (D) and 3Y (E), the recipient was not retrieved in BAT93, therefore the junctions are a bit less accurately resolved, but it was sufficient to infer the associated repair mechanism (i.e., NHEJ or HR).
Similar articles
- The Subtelomeric khipu Satellite Repeat from Phaseolus vulgaris: Lessons Learned from the Genome Analysis of the Andean Genotype G19833.
Richard MM, Chen NW, Thareau V, Pflieger S, Blanchet S, Pedrosa-Harand A, Iwata A, Chavarro C, Jackson SA, Geffroy V. Richard MM, et al. Front Plant Sci. 2013 Oct 16;4:109. doi: 10.3389/fpls.2013.00109. eCollection 2013. Front Plant Sci. 2013. PMID: 24137164 Free PMC article. - Molecular analysis of a large subtelomeric nucleotide-binding-site-leucine-rich-repeat family in two representative genotypes of the major gene pools of Phaseolus vulgaris.
Geffroy V, Macadré C, David P, Pedrosa-Harand A, Sévignac M, Dauga C, Langin T. Geffroy V, et al. Genetics. 2009 Feb;181(2):405-19. doi: 10.1534/genetics.108.093583. Epub 2008 Dec 15. Genetics. 2009. PMID: 19087965 Free PMC article. - Genomic and epigenomic immunity in common bean: the unusual features of NB-LRR gene family.
Richard MMS, Gratias A, Thareau V, Kim KD, Balzergue S, Joets J, Jackson SA, Geffroy V. Richard MMS, et al. DNA Res. 2018 Apr 1;25(2):161-172. doi: 10.1093/dnares/dsx046. DNA Res. 2018. PMID: 29149287 Free PMC article. - Evolution of SSR diversity from wild types to U.S. advanced cultivars in the Andean and Mesoamerican domestications of common bean (Phaseolus vulgaris).
Gioia T, Logozzo G, Marzario S, Spagnoletti Zeuli P, Gepts P. Gioia T, et al. PLoS One. 2019 Jan 31;14(1):e0211342. doi: 10.1371/journal.pone.0211342. eCollection 2019. PLoS One. 2019. PMID: 30703134 Free PMC article. - Current State and Perspectives in Population Genomics of the Common Bean.
Cortinovis G, Frascarelli G, Di Vittori V, Papa R. Cortinovis G, et al. Plants (Basel). 2020 Mar 5;9(3):330. doi: 10.3390/plants9030330. Plants (Basel). 2020. PMID: 32150958 Free PMC article. Review.
Cited by
- Screening for resistance to four fungal diseases and associated genomic regions in a snap bean diversity panel.
Campa A, Geffroy V, Bitocchi E, Noly A, Papa R, Ferreira JJ. Campa A, et al. Front Plant Sci. 2024 Jun 11;15:1386877. doi: 10.3389/fpls.2024.1386877. eCollection 2024. Front Plant Sci. 2024. PMID: 38919821 Free PMC article. - Genome-Wide Analysis of MYB Gene Family in Chrysanthemum ×morifolium Provides Insights into Flower Color Regulation.
Wang B, Wen X, Fu B, Wei Y, Song X, Li S, Wang L, Wu Y, Hong Y, Dai S. Wang B, et al. Plants (Basel). 2024 Apr 28;13(9):1221. doi: 10.3390/plants13091221. Plants (Basel). 2024. PMID: 38732436 Free PMC article. - Subtelomeric plasticity contributes to gene family expansion in the human parasitic flatworm Schistosoma mansoni.
Brann T, Beltramini A, Chaparro C, Berriman M, Doyle SR, Protasio AV. Brann T, et al. BMC Genomics. 2024 Feb 27;25(1):217. doi: 10.1186/s12864-024-10032-8. BMC Genomics. 2024. PMID: 38413905 Free PMC article. - Differential amplification of the subtelomeric satellite DNA JcSAT1 in the genus Jatropha L. (Euphorbiaceae).
Ribeiro T, Vasconcelos E, de Mendonça Filho JR, Sato S, de Argollo Marques D, Brasileiro-Vidal AC. Ribeiro T, et al. Genetica. 2024 Feb;152(1):43-49. doi: 10.1007/s10709-024-00204-5. Epub 2024 Feb 13. Genetica. 2024. PMID: 38349466 - Fine-mapping and evolutionary history of R-BPMV, a dominant resistance gene to Bean pod mottle virus in Phaseolus vulgaris L.
Meziadi C, Alvarez-Diaz JC, Thareau V, Gratias A, Marande W, Soler-Garzon A, Miklas PN, Pflieger S, Geffroy V. Meziadi C, et al. Theor Appl Genet. 2023 Dec 13;137(1):8. doi: 10.1007/s00122-023-04513-9. Theor Appl Genet. 2023. PMID: 38092992
References
LinkOut - more resources
Full Text Sources
Other Literature Sources


