Palmitoylation controls trafficking of the intracellular Ca2+ channel MCOLN3/TRPML3 to regulate autophagy - PubMed (original) (raw)
Palmitoylation controls trafficking of the intracellular Ca2+ channel MCOLN3/TRPML3 to regulate autophagy
So Woon Kim et al. Autophagy. 2019 Feb.
Abstract
MCOLN3/TRPML3 is a Ca2+-permeable cation channel that is expressed in multiple subcellular compartments with dynamic localization. Our previous studies suggest that upon macroautophagy/autophagy induction MCOLN3/TRPML3 is recruited and provides Ca2+ for the fusion process in autophagosome biogenesis. However, how intracellular trafficking and the Ca2+ channel function of MCOLN3/TRPML3 are related to autophagy are not known. Here we report that MCOLN3/TRPML3 undergoes palmitoylation at its C-terminal region, which is required for dynamic trafficking and cellular function of MCOLN3/TRPML3 in autophagy. Palmitoylation regulated MCOLN3/TRPML3 surface expression and trafficking, but not channel properties or localization and function of intracellular MCOLN3/TRPML3. Activation of intracellular MCOLN3/TRPML3 induced robust Ca2+ release, which solely increased autophagy in Ca2+- and palmitoylation-dependent manners. Palmitoylation regulated not only intracellular MCOLN3/TRPML3 trafficking to autophagic structures but also autophagic flux in induced autophagy. Importantly, nutrient starvation activated MCOLN3/TRPML3 to release Ca2+ and increased the level of MCOLN3/TRPML3 palmitoylation. Disruption of MCOLN3/TRPML3 palmitoylation, however, abolished the starvation-induced MCOLN3/TRPML3 activation without affecting channel activity. These results suggest that trafficking and channel function of MCOLN3/TRPML3 are regulated in the context of autophagy, and palmitoylation is a prerequisite for the function of MCOLN3/TRPML3 as a Ca2+ channel in autophagosome formation by controlling its trafficking between subcellular compartments. Abbreviations: 17-ODYA, 17-octadecynoic acid; 2-BP, 2-bromopalmitate; BFA, brefeldin A; DN, dominant-negative; GPN, glycyl-L-phenylalanine-beta-naphthylamide; HN, hydroxylamine; KD, knockdown; MCOLN3/TRPML3, mucolipin 3; MS, mass spectrometry; PAT, palmitoyl acyltransferase; PM, plasma membrane; WT, wild type; ZDHHC, a zinc-finger motif and an Asp-His-His-Cys sequence.
Keywords: Autophagy; Ca channel; MCOLN3/TRPML3; membrane trafficking; palmitoylation.
Figures
Figure 1.
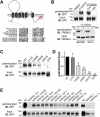
Palmitoylation sites and PATs of MCOLN3/TRPML3. (a) Schematic of MCOLN3/TRPML3 showing palmitoylation sites (gray and red circles) predicted by CSS-Palm v2.0 and sequence alignments of the indicated cysteine residues across different species and among MCOLN/TRPML subfamily members. (b) MCOLN3/TRPML3 palmitoylation assay. HEK293T cells expressing GFP-tagged MCOLN3/TRPML3 (upper panel) or HEK293T and SW13 cells (lower panel) were either treated with DMSO (control) or metabolically labeled with 100 μM 17-ODYA. After 6 h, membrane fractions were prepared followed by reaction between biotin-azide and 17-ODYA using click chemistry. Biotinylated proteins were affinity isolated using streptavidin beads and eluates were analyzed by western blot using anti-GFP antibody or anti-MCOLN3/TRPML3 antibody to detect palmitoylated proteins. Tris or HN were added to the reaction mixture and incubated for 1 h at RT before adding the beads. Input samples were 1% of protein lysate used in the click chemistry reactions. (c) MCOLN3/TRPML3 and cysteine mutant palmitoylation assays. HEK293T cells expressing GFP-tagged MCOLN3/TRPML3 and the indicated single or triple cysteine mutants were assayed as in (b). (d) Quantified data of ratios of palmitoylated MCOLN3/TRPML3s to total MCOLN3/TRPML3 protein levels (n = 3, *p < 0.05, ***p < 0.005 compared to WT, Student’s _t_-test). Data are presented as the mean ± SEM. (e) HEK293T cells treated with the indicated siRNAs targeting human ZDHHCs for 72 h were transfected with pEGFPC1-MCOLN3/TRPML3 for 24 h to be assayed as in (b). NC indicates negative control siRNA.
Figure 2.
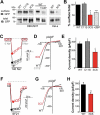
Effect of palmitoylation on MCOLN3/TRPML3 surface expression. (a) Analysis of surface expression by biotinylation. HEK293T cells expressing WT MCOLN3/TRPML3, MCOLN3/TRPML3(C11S), or MCOLN3/TRPML3(3CS) treated with ethanol (control) or 2-BP, and HeLa cells expressing WT MCOLN3/TRPML3 or MCOLN3/TRPML3(3CS) were used for surface biotinylation assays. Total and surface proteins were analyzed by western blot using anti-GFP antibody. The data are representative of 3 independent experiments. (b) Densitometric analysis of surface MCOLN3/TRPML3s to total MCOLN3/TRPML3 protein levels (n = 3, *p < 0.05, ***p < 0.005 compared to WT, Student’s _t_-test) of western blots from HEK293T cells similar to those in (a). Data are presented as the mean ± SEM. (c) Whole cell current was measured in HEK293T cells expressing WT MCOLN3/TRPML3, MCOLN3/TRPML3(C11S), or MCOLN3/TRPML3(3CS). The MCOLN3/TRPML3 current was activated by sequentially exposing the cells to bath solutions containing 0 and 140 mM Na+. Current was measured by applying 100 ms ramps from −100 to + 100 mV and plotted at −100 mV. Dashed lines here and in (f) indicate the 0 current levels. (d) I/V relationships of the MCOLN3/TRPML3 currents recorded at the times shown in the filled circles in panel (c). (e) The current amplitudes of WT MCOLN3/TRPML3, MCOLN3/TRPML3(C11S), and MCOLN3/TRPML3(3CS) are plotted as the mean ± SEM of 10–13 cells (*p < 0.05, Student’s _t_-test). (f) The whole cell current was measured in HEK293T cells expressing WT MCOLN3/TRPML3 or MCOLN3/TRPML3(3CS) by applying 5 µM SF21 in a 140 mM Na+ bath solution. (g) I/V relationships of the MCOLN3/TRPML3 current recorded at the times shown in the filled circles in panel (f). (h) The current amplitudes of WT MCOLN3/TRPML3 and MCOLN3/TRPML3(3CS) are plotted as the mean ± SEM of 10 cells each (**p < 0.01, Student’s _t_-test).
Figure 3.
Effects of palmitoylation on MCOLN3/TRPML3 trafficking. (a) Schematic for MCOLN3/TRPML3 trafficking to and from the PM. (b and d) HEK293T cells expressing WT MCOLN3/TRPML3 or MCOLN3/TRPML3(3CS) were treated with either 20 µM BFA (b) for 4 h or 100 µM Dynasore (d) for 2 h at 37°C. MCOLN3/TRPML3 currents were measured by applying 5 µM SF21 in 140 mM Na+ bath solution. I/V relationships of the MCOLN3/TRPML3 current recorded from cells treated with the indicated compound (black and red traces) at the indicated time points are shown. (c and e) The current amplitudes and relative current density of WT MCOLN3/TRPML3 (black circle) and MCOLN3/TRPML3(3CS) (red circle) in experiments similar to those in panel (b and d) were plotted as the mean ± SEM of 10–21 cells (*p < 0.05, ***p < 0.005, Student’s _t_-test). (f) HeLa cells transfected with mCherry-MCOLN3/TRPML3 or mCherry-MCOLN3/TRPML3(3CS) were incubated with Alexa Fluor 488-EGF or Alexa Fluor 488-TF for 10 min, fixed, and imaged by confocal microscopy. Scale bars here and in all other confocal images: 20 µm. (g) ImageJ was used to count the number of puncta in 14–16 cells from 2–3 experiments and the number of particles is plotted as the mean ± SEM at the indicated conditions (***p < 0.005, Student’s _t_-test). Con indicates the empty vector control.
Figure 4.
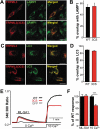
Organellar localization and Ca2+ release by WT MCOLN3/TRPML3 and MCOLN3/TRPML3(3CS). (a) HeLa cells transfected with plasmids encoding mCherry-MCOLN3/TRPML3 or mCherry-MCOLN3/TRPML3(3CS) were stained for LAMP1 (green) and imaged by confocal microscopy. (b) Images similar to those in panel (a) from 5–9 cells were used to determine the overlap with ImageJ. The results are given as the mean ± SEM. (c) HeLa cells transfected with a plasmid encoding mCherry-MCOLN3/TRPML3 or mCherry-MCOLN3/TRPML3(3CS) and GFP-LC3 were imaged by confocal microscopy. (d) Images similar to those in panel (c) from 7 cells were used to determine the overlap with ImageJ. The results are given as the mean ± SEM. (e) HEK293T cells expressing GFP (gray trace), WT MCOLN3/TRPML3 (black trace) or MCOLN3/TRPML3(3CS) (red trace) were preincubated in Ca2+-free medium to block PM Ca2+ influx. Organellar Ca2+ efflux was measured by applying 20 µM ML-SA1 in Ca2+-free medium and then, Ca2+ influx from the PM was measured by increasing Ca2+o to 10 mM. (f) Cellular responses to ML-SA1 and 10 mM Ca2+o were compared in cells transfected with WT MCOLN3/TRPML3 and MCOLN3/TRPML3(3CS). Results are plotted as the mean ± SEM of 28–29 cells (***p < 0.005, Student’s _t_-test).
Figure 5.
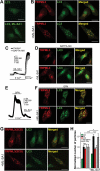
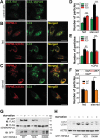
Differential effect of organellar Ca2+ efflux via WT MCOLN3/TRPML3 and MCOLN3/TRPML3(3CS) on autophagy. (a and b) HeLa cells transfected with a plasmid encoding GFP-LC3 only (a) or co-transfected with a plasmid encoding mCherry-MCOLN3/TRPML3 (b) were treated with vehicle or 20 µM ML-SA1 in Ca2+-free medium for 1 h at 37°C. (c) HEK293T cells transfected with a plasmid encoding WT MCOLN3/TRPML3 were preincubated with 10 µM BAPTA-AM for 30 min and intracellular Ca2+ was measured as in Figure 4(e). (d) HeLa cells expressing GFP-LC3 and mCherry-MCOLN3/TRPML3 were preincubated with 10 µM BAPTA-AM in Ca2+-free medium for 30 min and treated as in panel (b). (e) Ca2+ was measured from HEK293T cells transfected with WT MCOLN3/TRPML3 by applying 500 µM GPN and then 20 µM ML-SA1. (f) HeLa cells expressing GFP-LC3 and mCherry-MCOLN3/TRPML3 were preincubated with 500 µM GPN and 10 µM CPA in Ca2+-free medium for 30 min and treated as in panel (b). (g) HeLa cells transfected with a plasmid encoding GFP-LC3 and mCherry-MCOLN3/TRPML3(3CS) were treated as in panel (b). (h) The normalized number of GFP-LC3 puncta in panel (a, b, d, f, g) was counted using ImageJ and given as the mean ± SEM of 23–33 cells for panel (a, b, g) and that of 4–14 cells for panel (D and F) (***p < 0.005, Student’s _t_-test).
Figure 6.
Effect of palmitoylation on MCOLN3/TRPML3 trafficking in the context of autophagy. (A-C) HeLa cells transfected with a plasmid encoding GFP-LC3 only (a) or co-transfected with a plasmid encoding mCherry-MCOLN3/TRPML3 or mCherry-MCOLN3/TRPML3(3CS) were kept in fed medium (b) or serum starved for 2 h (c). (d and e) The number of GFP-LC3 puncta in serum-starved cells (d) or in cells treated with 25 µM CPA for 3 h (e) was counted using ImageJ and given as the mean ± SEM of 12–28 cells (*p < 0.05, ***p < 0.005, Student’s _t_-test). (f) The upper panel shows the C-terminal amino acid sequence of WT MCOLN3/TRPML3 and MCOLN3/TRPML3(Δ5), where Δ5 indicates truncation of the last 5 amino acids of MCOLN3/TRPML3 including the palmitoylation sites. The number of GFP-LC3 puncta in cells co-transfected with WT MCOLN3/TRPML3 or MCOLN3/TRPML3(Δ5) was counted and given as the mean ± SEM of 11–14 cells (*p < 0.05, Student’s _t_-test). (g) HEK293T cells expressing GFP-tagged WT, 3CS or D458K MCOLN3/TRPML3 with FLAG-GABARAPL2 were kept in full medium or serum-starved for 2 h and immunoprecipitated samples with anti-GFP antibody were subjected to western blotting with anti-FLAG antibody. The inputs, corresponding to 5% of the amount used for each immunoprecipitation, were blotted with anti-FLAG antibody (middle panel) and anti-GFP antibody (lower panel). (h) Cell lysates in panel (g) were used for western blot analysis to assay endogenous LC3 levels. ACTB/β-actin was used as a loading control.
Figure 7.
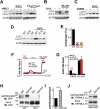
Effect of channel function and palmitoylation of MCOLN3/TRPML3 on autophagy and vice versa. (a) HeLa cells transfected with either negative control siRNA (-) or siRNA targeting MCOLN3/TRPML3 (+) for 72 h were treated with 100 nM bafilomycin A1 in HBSS for 4 h or with 10 µg/ml E64d and 10 µg/ml pepstatin A in serum-free medium for 11 h and processed for western blot analysis to assay endogenous LC3 levels. (b) HeLa cells transfected with negative control siRNA in panel (a) were treated with 100 nM bafilomycin A1 in HBSS for 4 h in the presence and absence of 10 µM ML-SI1 and assayed as in panel (a). (c) HEK293T cells expressing control vector (-) or MCOLN3D458K (+) were treated with 100 nM bafilomycin A1 in HBSS for 4 h and assayed as in panel (a). (d) HeLa cells transfected with a plasmid encoding mCherry-tagged WT MCOLN3/TRPML3, MCOLN3/TRPML3(3CS), or MCOLN3/TRPML3(Δ5) were treated with DMSO or 100 nM bafilomycin A1 in PBS for 3 h and processed for western blot analysis to assay endogenous LC3 levels. The result is representative of 3 independent experiments. (e) Autophagic flux was calculated from the change in normalized LC3-II levels to ACTB/β-actin upon bafilomycin A1 treatment in (d). Values are relative to WT MCOLN3/TRPML3 and are plotted as the mean ± SEM from 3 independent experiments (***p < 0.005, Student’s _t_-test). (f) Intracellular Ca2+ was measured in HEK293T cells expressing WT MCOLN3/TRPML3, MCOLN3/TRPML3(3CS), or MCOLN3D458K while the cells were kept in fed medium and then exposed to HBSS. Organellar Ca2+ efflux was measured by applying 20 µM ML-SA1. (g) The increase of 340:380 ratio in panel (f) was presented as the mean ± SEM of 6–34 cells (***p < 0.005, Student’s _t_-test). (h) HEK293T cells expressing GFP-tagged WT MCOLN3/TRPML3 or MCOLN3/TRPML3(3CS) were kept in fed medium or serum-starved during treatment with 100 μM 17-ODYA for 6–8 h and assayed as in Figure 1(b). (i) Quantified data of ratios of palmitoylated MCOLN3/TRPML3 to total MCOLN3/TRPML3 protein levels in fed or starved condition are presented as the mean ± SEM (n = 3, *p < 0.05, Student’s _t_-test). (j) HEK293T cells were treated as in panel (h) and analyzed by western blot using anti-MCOLN3/TRPML3 antibody to detect endogenous palmitoylated MCOLN3/TRPML3.
Comment in
- MCOLN3/TRPML3 bridges the regulation of autophagosome biogenesis by PtdIns3P and the calcium channel.
Lei Y, Klionsky DJ. Lei Y, et al. Autophagy. 2023 Feb;19(2):377-378. doi: 10.1080/15548627.2022.2148808. Epub 2022 Nov 24. Autophagy. 2023. PMID: 36383451 Free PMC article.
Similar articles
- MCOLN3/TRPML3 bridges the regulation of autophagosome biogenesis by PtdIns3P and the calcium channel.
Lei Y, Klionsky DJ. Lei Y, et al. Autophagy. 2023 Feb;19(2):377-378. doi: 10.1080/15548627.2022.2148808. Epub 2022 Nov 24. Autophagy. 2023. PMID: 36383451 Free PMC article. - The Ca2+ channel TRPML3 specifically interacts with the mammalian ATG8 homologue GATE16 to regulate autophagy.
Choi S, Kim HJ. Choi S, et al. Biochem Biophys Res Commun. 2014 Jan 3;443(1):56-61. doi: 10.1016/j.bbrc.2013.11.044. Epub 2013 Nov 20. Biochem Biophys Res Commun. 2014. PMID: 24269818 - The Ca(2+) channel TRPML3 regulates membrane trafficking and autophagy.
Kim HJ, Soyombo AA, Tjon-Kon-Sang S, So I, Muallem S. Kim HJ, et al. Traffic. 2009 Aug;10(8):1157-67. doi: 10.1111/j.1600-0854.2009.00924.x. Epub 2009 May 11. Traffic. 2009. PMID: 19522758 Free PMC article. - The TRPML3 channel: from gene to function.
Noben-Trauth K. Noben-Trauth K. Adv Exp Med Biol. 2011;704:229-37. doi: 10.1007/978-94-007-0265-3_13. Adv Exp Med Biol. 2011. PMID: 21290299 Review. - TRPML2 and mucolipin evolution.
García-Añoveros J, Wiwatpanit T. García-Añoveros J, et al. Handb Exp Pharmacol. 2014;222:647-58. doi: 10.1007/978-3-642-54215-2_25. Handb Exp Pharmacol. 2014. PMID: 24756724 Review.
Cited by
- Evolutionary Aspects of TRPMLs and TPCs.
Jaślan D, Böck J, Krogsaeter E, Grimm C. Jaślan D, et al. Int J Mol Sci. 2020 Jun 11;21(11):4181. doi: 10.3390/ijms21114181. Int J Mol Sci. 2020. PMID: 32545371 Free PMC article. Review. - Construction of Prediction Model for Atrial Fibrillation with Valvular Heart Disease Based on Machine Learning.
Li Q, Lei S, Luo X, He J, Fang Y, Yang H, Liu Y, Deng CY, Wu S, Xue YM, Rao F. Li Q, et al. Rev Cardiovasc Med. 2022 Jun 28;23(7):247. doi: 10.31083/j.rcm2307247. eCollection 2022 Jul. Rev Cardiovasc Med. 2022. PMID: 39076905 Free PMC article. - TRPML3/BK complex promotes autophagy and bacterial clearance by providing a positive feedback regulation of mTOR via PI3P.
Xu M, Zhong XZ, Huang P, Jaślan D, Wang P, Sun X, Weiden EM, El Hiani Y, Grimm C, Dong XP. Xu M, et al. Proc Natl Acad Sci U S A. 2023 Aug 22;120(34):e2215777120. doi: 10.1073/pnas.2215777120. Epub 2023 Aug 16. Proc Natl Acad Sci U S A. 2023. PMID: 37585464 Free PMC article. - Reduction of DHHC5-mediated beclin 1 S-palmitoylation underlies autophagy decline in aging.
Guo R, Liu J, Min X, Zeng W, Shan B, Zhang M, He Z, Zhang Y, He K, Yuan J, Xu D. Guo R, et al. Nat Struct Mol Biol. 2024 Feb;31(2):232-245. doi: 10.1038/s41594-023-01163-9. Epub 2024 Jan 4. Nat Struct Mol Biol. 2024. PMID: 38177673 - A Not-So-Ancient Grease History: Click Chemistry and Protein Lipid Modifications.
Suazo KF, Park KY, Distefano MD. Suazo KF, et al. Chem Rev. 2021 Jun 23;121(12):7178-7248. doi: 10.1021/acs.chemrev.0c01108. Epub 2021 Apr 6. Chem Rev. 2021. PMID: 33821625 Free PMC article. Review.
References
- Choi S, Kim HJ. The Ca2+ channel MCOLN3/TRPML3 specifically interacts with the mammalian ATG8 homologue GATE16 to regulate autophagy. Biochem Biophys Res Commun. 2014. January 3;443(1):56–61. - PubMed
Publication types
MeSH terms
Substances
Grants and funding
This work was supported by the National Research Foundation of Korea [NRF-2014R1A1A2057830] and [NRF-2018R1A4A1023822].
LinkOut - more resources
Full Text Sources
Other Literature Sources
Molecular Biology Databases
Miscellaneous
