Fluorescent blood-brain barrier tracing shows intact leptin transport in obese mice - PubMed (original) (raw)
Fluorescent blood-brain barrier tracing shows intact leptin transport in obese mice
Luke Harrison et al. Int J Obes (Lond). 2019 Jun.
Abstract
Background/objectives: Individuals carrying loss-of-function gene mutations for the adipocyte hormone leptin are morbidly obese, but respond favorably to replacement therapy. Recombinant leptin is however largely ineffective for the vast majority of obese individuals due to leptin resistance. One theory underlying leptin resistance is impaired leptin transport across the blood-brain-barrier (BBB). Here, we aim to gain new insights into the mechanisms of leptin BBB transport, and its role in leptin resistance.
Methods: We developed a novel tool for visualizing leptin transport using infrared fluorescently labeled leptin, combined with tissue clearing and light-sheet fluorescence microscopy. We corroborated these data using western blotting.
Results: Using 3D whole brain imaging, we display comparable leptin accumulation in circumventricular organs of lean and obese mice, predominantly in the choroid plexus (CP). Protein quantification revealed comparable leptin levels in microdissected mediobasal hypothalami (MBH) of lean and obese mice (p = 0.99). We further found increased leptin receptor expression in the CP (p = 0.025, p = 0.0002) and a trend toward elevated leptin protein levels in the MBH (p = 0.17, p = 0.078) of obese mice undergoing weight loss interventions by calorie restriction or exendin-4 treatment.
Conclusions: Overall, our findings suggest a crucial role for the CP in controlling the transport of leptin into the cerebrospinal fluid and from there to target areas such as the MBH, potentially mediated via the leptin receptor. Similar leptin levels in circumventricular organs and the MBH of lean and obese mice further suggest intact leptin BBB transport in leptin resistant mice.
Conflict of interest statement
MHT is a scientific advisor to Novo Nordisk and ERX. The remaining authors declare that they have no conflict of interest.
Figures
Fig. 1
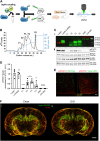
Labeled leptin combined with tissue clearing and light-sheet fluorescence microscopy allows for 3D visualization of leptin distribution in the intact mouse brain. a Leptin was coupled to either an infrared fluorescent dye (CW800) or a far-red fluorescent dye (650). Labeled leptin was then injected into chow-fed lean mice or age-matched diet-induced obese (DIO) mice fed with HFD for 20 weeks. Brains were collected 45 min after leptin injections and subjected to tissue clearing followed by LSFM to obtain 3D whole brain images. b Anion exchange chromatography was used to purify CW800 labeled leptin. Individual fractions F1–F4 were collected based on UV absorption (280 nm). A final fraction (F5) was collected by increasing the NaCl concentration above 50%, which is known to remove any remaining bound substances from the column. c-i Leptin, leptin-CW800, fractions F1–F4, PBS and CW800 alone were subjected to SDS-Page and Western blotting. Leptin bands were detected by either immunolabeling with a leptin antibody (red) or infrared fluorescence (green). c-ii Murine LepRb overexpressing HEK293 cells were incubated for 30 min with native leptin, leptin-CW800, fractions F1–F4, CW800 alone, or PBS to measure pSTAT3 levels as a marker for leptin bioactivity. d Densitometric analysis of the pSTAT3 signal from the western blots seen in c-ii . e Bioactivity was further confirmed in vivo by injecting leptin-650 (i.p., 5 mg kg−1) in mice and analyzing pSTAT3 45 min after leptin administration (pSTAT3 shown in red, leptin-650 or the 650 dye alone shown in green). f Mice, either chow-fed and lean (i) or HFD-fed and DIO (ii), were injected with leptin-CW800 (i.p., 5 mg kg−1) and lectin-647 (i.v., 250 µg). 3D-reconstruction of the brains reveals leptin accumulation in the ME and CP (Lectin-647 shown in red, leptin-CW800 shown in green). Scale bars for e and f are 100 and 1000 µm, respectively. Data in D are means ± SEM for 3 independent experiments. Significance was determined using One-Way ANOVA and Bonferonni’s post-hoc testing. Significance is depicted as *p < 0.05, **p < 0.01, ****p < 0.0001
Fig. 2
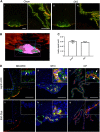
Accumulation of labeled leptin in circumventricular organs and the choroid plexus of mice. a Leptin-CW800 (i.p., 5 mg kg−1) and lectin-647 (i.v., 250 µg) were injected into either DIO or chow control mice, and the brains examined with LSFM. (Leptin-CW800 shown in green, lectin-647 shown in red). Leptin-CW800 that has entered the brain parenchyma is seen as green, whereas leptin-CW800 within the blood vessels is visualized as yellow. a-i and a-iii depict the ME and a-ii and a-iv depict the CP in the lateral ventricle. b Screenshot depicting the leptin volume (pink) and blood vessel volume (turquoise) calculations from the ARIVIS image analysis software package. c Quantification of the total leptin volume within the ME for lean chow fed and DIO mice. d To obtain higher resolution of specific regions, leptin-650 (i.p., 5 mg kg−1) or 650-Dye and lectin-488 (i.v., 250 µg) were injected into chow fed mice and examined via confocal microscopy. Arrows indicate leptin-650 in the brain parenchyma, arrowheads indicate leptin-650 within blood vessels. ME median eminence, ARC arcuate nucleus, SFO subfornical organ, CP choroid plexus (lateral ventricle). Scale bars for a-i and ii are 100 µm, and for di–vi 100 µm. Leptin-CW800/leptin-650 are shown in green, lectin-647/lectin488 are shown in red, DAPI is shown in blue. Data in c are means ± SEM for an n of 3. Significance was determined using a two-tailed student’s _t_-test
Fig. 3
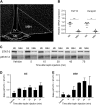
Leptin signaling in dissected median eminence (ME) and mediobasal hypothalamus (MBH) mouse brain tissue. a The ME and MBH were dissected from murine brains as depicted in a. b A correct dissection was determined using RT-qPCR of specific ME-residing tanycyte genes (FGF10 and Darpp32). c–e Leptin transport kinetics into the ME and MBH were assessed in mice injected with leptin (i.p., 5 mg kg−1) or vehicle. ME and MBH tissue samples were dissected 5–75 min after leptin/vehicle treatment and subjected to western blot (c) and densitometric analyses (d, e). Data in b, d and e are means ± SEM. Differences were analyzed by a two-tailed Student’s _t_-test. **p < 0.01, ***p < 0.001 between ME and MBH samples. (Each data point consists of samples from 2 animals, which were pooled due to detection limitations. n = 4 per group for b and n = 2–3 for d, e). ME median eminence, MBH mediobasal hypothalamus. The scale bar in a is 200 µm
Fig. 4
Weight loss by CR or EX4 treatment drives upregulation of leptin receptor mRNA in the choroid plexus. a Effects of obesity and weight loss on the transport of leptin into the MBH were recorded in age-matched mice exposed to at least 20 weeks of chow or HFD (Chow, HFD) and additional groups of age-matched and HFD-fed DIO mice after a diet intervention (HFD > Chow; CR) or pharmacological treatment (EX4). Body weights were recorded daily for all groups (chow and HFD every 3 days) for 11 days during the intervention. b–d Final day body weights for all animals (b) as well as changes in fat and lean mass (c, d). e, f On day 11, the choroid plexus was isolated from all mice and expression levels of LRP2 and LepR were measured. All data are means ± SEM. Groups with the same character indicate groups that are not significantly different from each other. Groups with different characters are significantly different from each other as determined by One-Way or Two-Way ANOVA with Tukey’s post-hoc testing (n = 11–13 for a–d and n = 9–10 for e, f. HFD high fat diet, H > C diet switch, CR calorie restriction, EX4 exendin-4)
Fig. 5
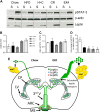
Profound weight loss is associated with increased leptin transport into the MBH. a–d Leptin levels in the MBH 45 min after vehicle (saline, S) or leptin (L) injections (i.p., 5 mg kg−1) in age-matched mice exposed to chow, HFD, H > C, CR or EX4 treatment. Mice were dissected and MBH samples subjected to western blotting (a) and densitometric analyses (b–d) for leptin or leptin sensitivity marker pSTAT3. e Schematic representation of the proposed route of leptin transport to the MBH in chow and DIO mice. Each diet group consists of 6 animals, however samples were pooled due to detection limitations, resulting in n = 3 replicates for statistical analyses. All data are means ± SEM. Significance was determined using one-way ANOVA. HFD high fat diet, H > C diet switch, CR calorie restriction, EX4 exendin-4. Significance is depicted as *p < 0.05, **p < 0.01
Similar articles
- Deficient Leptin Cellular Signaling Plays a Key Role in Brain Ultrastructural Remodeling in Obesity and Type 2 Diabetes Mellitus.
Hayden MR, Banks WA. Hayden MR, et al. Int J Mol Sci. 2021 May 21;22(11):5427. doi: 10.3390/ijms22115427. Int J Mol Sci. 2021. PMID: 34063911 Free PMC article. Review. - Obesity is associated with a decreased leptin transport across the blood-brain barrier in rats.
Burguera B, Couce ME, Curran GL, Jensen MD, Lloyd RV, Cleary MP, Poduslo JF. Burguera B, et al. Diabetes. 2000 Jul;49(7):1219-23. doi: 10.2337/diabetes.49.7.1219. Diabetes. 2000. PMID: 10909981 - Impaired transport of leptin across the blood-brain barrier in obesity.
Banks WA, DiPalma CR, Farrell CL. Banks WA, et al. Peptides. 1999 Nov;20(11):1341-5. doi: 10.1016/s0196-9781(99)00139-4. Peptides. 1999. PMID: 10612449 - The blood-brain barrier as a regulatory interface in the gut-brain axes.
Banks WA. Banks WA. Physiol Behav. 2006 Nov 30;89(4):472-6. doi: 10.1016/j.physbeh.2006.07.004. Epub 2006 Aug 10. Physiol Behav. 2006. PMID: 16904139 Review.
Cited by
- Leptin, Obesity, and Leptin Resistance: Where Are We 25 Years Later?
Izquierdo AG, Crujeiras AB, Casanueva FF, Carreira MC. Izquierdo AG, et al. Nutrients. 2019 Nov 8;11(11):2704. doi: 10.3390/nu11112704. Nutrients. 2019. PMID: 31717265 Free PMC article. Review. - Regulation of energy balance by leptin as an adiposity signal and modulator of the reward system.
Asgari R, Caceres-Valdiviezo M, Wu S, Hamel L, Humber BE, Agarwal SM, Fletcher PJ, Fulton S, Hahn MK, Pereira S. Asgari R, et al. Mol Metab. 2025 Jan;91:102078. doi: 10.1016/j.molmet.2024.102078. Epub 2024 Nov 29. Mol Metab. 2025. PMID: 39615837 Free PMC article. Review. - Arcuate Nucleus-Dependent Regulation of Metabolism-Pathways to Obesity and Diabetes Mellitus.
Jais A, Brüning JC. Jais A, et al. Endocr Rev. 2022 Mar 9;43(2):314-328. doi: 10.1210/endrev/bnab025. Endocr Rev. 2022. PMID: 34490882 Free PMC article. Review. - The pleiotropic roles of leptin in metabolism, immunity, and cancer.
de Candia P, Prattichizzo F, Garavelli S, Alviggi C, La Cava A, Matarese G. de Candia P, et al. J Exp Med. 2021 May 3;218(5):e20191593. doi: 10.1084/jem.20191593. J Exp Med. 2021. PMID: 33857282 Free PMC article. Review. - Multi-organ Coordination of Lipoprotein Secretion by Hormones, Nutrients and Neural Networks.
Stahel P, Xiao C, Nahmias A, Tian L, Lewis GF. Stahel P, et al. Endocr Rev. 2021 Nov 16;42(6):815-838. doi: 10.1210/endrev/bnab008. Endocr Rev. 2021. PMID: 33743013 Free PMC article. Review.
References
Publication types
MeSH terms
Substances
LinkOut - more resources
Full Text Sources
Other Literature Sources
Miscellaneous


