Reducing dynamin 2 (DNM2) rescues DNM2-related dominant centronuclear myopathy - PubMed (original) (raw)
. 2018 Oct 23;115(43):11066-11071.
doi: 10.1073/pnas.1808170115. Epub 2018 Oct 5.
Suzie Buono 1 2 3 4 5, Hichem Tasfaout 1 2 3 4, Yotam Levy 6, Christine Kretz 1 2 3 4, Leighla Tayefeh 7, John Matson 7, Shuling Guo 7, Pascal Kessler 1 2 3 4, Brett P Monia 7, Marc Bitoun 8 9 10, Julien Ochala 6, Jocelyn Laporte 11 2 3 4, Belinda S Cowling 11 2 3 4
Affiliations
- PMID: 30291191
- PMCID: PMC6205463
- DOI: 10.1073/pnas.1808170115
Reducing dynamin 2 (DNM2) rescues _DNM2_-related dominant centronuclear myopathy
Suzie Buono et al. Proc Natl Acad Sci U S A. 2018.
Abstract
Centronuclear myopathies (CNM) are a group of severe muscle diseases for which no effective therapy is currently available. We have previously shown that reduction of the large GTPase DNM2 in a mouse model of the X-linked form, due to loss of myotubularin phosphatase MTM1, prevents the development of the skeletal muscle pathophysiology. As DNM2 is mutated in autosomal dominant forms, here we tested whether DNM2 reduction can rescue _DNM2_-related CNM in a knock-in mouse harboring the p.R465W mutation (_Dnm2_RW/+) and displaying a mild CNM phenotype similar to patients with the same mutation. A single intramuscular injection of adeno-associated virus-shRNA targeting Dnm2 resulted in reduction in protein levels 5 wk post injection, with a corresponding improvement in muscle mass and fiber size distribution, as well as an improvement in histopathological CNM features. To establish a systemic treatment, weekly i.p. injections of antisense oligonucleotides targeting Dnm2 were administered to _Dnm2_RW/+mice for 5 wk. While muscle mass, histopathology, and muscle ultrastructure were perturbed in _Dnm2_RW/+mice compared with wild-type mice, these features were indistinguishable from wild-type mice after reducing DNM2. Therefore, DNM2 knockdown via two different strategies can efficiently correct the myopathy due to DNM2 mutations, and it provides a common therapeutic strategy for several forms of centronuclear myopathy. Furthermore, we provide an example of treating a dominant disease by targeting both alleles, suggesting that this strategy may be applied to other dominant diseases.
Keywords: adeno-associated virus; antisense oligonucleotides; congenital myopathy; dynamin 2; myotubular myopathy.
Conflict of interest statement
Conflict of interest statement: H.T., J.L., and B.S.C. are inventors of a patent on targeting DNM2 for the treatment of centronuclear myopathies. J.L. and B.S.C. are scientific advisors for Dynacure.
Figures
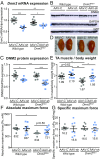
Fig. 1.
Reducing DNM2 by intramuscular AAV-shRNA delivery in _Dnm2_RW/+ mice improves muscle mass. (A) Dnm2 mRNA expression quantified by RT-qPCR, relative to Hprt expression, in wild-type and DNM2 R465W knock-in (_Dnm2_RW/+) mice, treated with AAV-shRNA targeting Dnm2 (AAV-sh) or AAV-scrambled control (AAV-C). (B) Immunoblot for protein expression of DNM2, GAPDH (protein loading control), and GFP (AAV-control). (C) DNM2 protein expression quantified relative to GAPDH loading control. (D) TA representative images. (E) TA muscle mass from wild-type and _Dnm2_RW/+ mice, treated with AAV-sh or AAV-C as a ratio to body weight. (F) Absolute maximum force (Po) and (G) specific maximum force (sPo) (relative to TA muscle weight). Graphs represent mean ± SEM. Each point represents one mouse; n > 5 per group. *P < 0.05, **P < 0.01, ***P < 0.001.
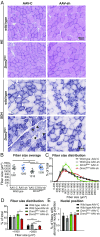
Fig. 2.
Reducing DNM2 by AAV-shRNA in _Dnm2_RW/+ mice corrects histological features of disease. (A) Transverse muscle sections from wild-type and DNM2 R465W knock-in (_Dnm2_RW/+) mice, treated with AAV-shRNA targeting Dnm2 (AAV-sh) or AAV-scrambled control (AAV-C), stained with H&E or SDH. Arrows indicate abnormal central accumulation of oxidative staining. (Scale bar: 50 µm.) (B) Fiber size average and (C and D) fiber size distribution were quantified from H&E images in A. (E) Fibers with internal or centralized nuclei (“abnormal nuclei position”) were quantified from H&E images in A. n = 7–8 mice per group. (B_–_E) More than 500 fibers per mouse were analyzed. Graphs represent mean ± SEM. *P < 0.05, **P < 0.01, ***P < 0.001.
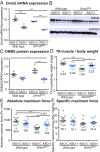
Fig. 3.
Reducing DNM2 by systemic ASO injection in _Dnm2_RW/+ mice improves muscle mass. (A) Dnm2 mRNA expression quantified by RT-qPCR analysis, relative to Hprt expression, in wild-type and DNM2 R465W knock-in (_Dnm2_RW/+) mice, treated with ASO-1–targeting Dnm2 (ASO-1) or ASO-control (ASO-C). (B) Immunoblot for protein expression of DNM2 and GAPDH (protein loading control). (C) DNM2 protein expression quantified relative to GAPDH loading control. (D) TA muscle mass from wild-type and _Dnm2_RW/+ mice, treated with ASO-1 or ASO-C, represented as a ratio to body weight. (E) Absolute maximum force (Po) and (F) specific maximum force (sPo) (relative to TA muscle weight). Each point represents one mouse; n ≥ 5 per group. Graphs represent mean ± SEM. *P < 0.05, ***P < 0.001.
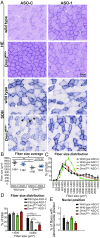
Fig. 4.
Reducing DNM2 by systemic ASO injection in _Dnm2_RW/+ mice corrects histological features of disease. (A) Transverse muscle sections from wild-type and DNM2 R465W knock-in (_Dnm2_RW/+) mice, treated with ASO-1 targeting Dnm2 (ASO-1) or ASO-control (ASO-C), stained with H&E or SDH. Arrows indicate abnormal central accumulation of oxidative staining. (Scale bar: 50 µm.) (B) Fiber size average and (C and D) fiber size distribution were quantified from H&E images in A. (E) Fibers with internal or centralized nuclei (“abnormal nuclei position”) were quantified from H&E images in A. n = 5–6 mice per group. (B_–_E) More than 500 fibers per mouse were analyzed. Graphs represent mean ± SEM. *P < 0.05, **P < 0.01, ***P < 0.001.
Fig. 5.
Ultrastructure morphology of _Dnm2_RW/+ muscles after reducing DNM2 by systemic ASO injection. TA ultrastructure in wild-type and _Dnm2_RW/+ mice, treated with ASO control (ASO-C) or ASO targeting Dnm2 (ASO-1) at high magnification. (Scale bar: 1 µm.) Low-magnification images can be found in
SI Appendix
. Images are representative of two mice per genotype. Asterisks (*) indicate abnormally small myofibrils that were not observed in _Dnm2_RW/+ after ASO-1 administration.
Fig. 6.
ASO treatment in _Dnm2_RW/+ mice improves fiber size in isolated fibers. (A) TA fibers from wild type (WT) and _Dnm2_RW/+ mice, treated with ASO targeting Dnm2 (ASO-1) or ASO-control (ASO-C), were isolated, skinned, and stained for actin (phalloidin, red) and nuclei position (DAPI, blue). (B) Cross-sectional area of isolated fibers (µm2), estimated from fiber width and depth. (C) Comparison of the nuclei position (number of nuclei/mm), relative to fiber size (µm2). A total of 18–22 fibers per genotype were analyzed. A one-way ANOVA statistical test was performed. Graphs represent mean ± SEM, with individual values shown. **P < 0.01, ***P < 0.001.
Similar articles
- Antisense oligonucleotide-mediated Dnm2 knockdown prevents and reverts myotubular myopathy in mice.
Tasfaout H, Buono S, Guo S, Kretz C, Messaddeq N, Booten S, Greenlee S, Monia BP, Cowling BS, Laporte J. Tasfaout H, et al. Nat Commun. 2017 Jun 7;8:15661. doi: 10.1038/ncomms15661. Nat Commun. 2017. PMID: 28589938 Free PMC article. - Single Intramuscular Injection of AAV-shRNA Reduces DNM2 and Prevents Myotubular Myopathy in Mice.
Tasfaout H, Lionello VM, Kretz C, Koebel P, Messaddeq N, Bitz D, Laporte J, Cowling BS. Tasfaout H, et al. Mol Ther. 2018 Apr 4;26(4):1082-1092. doi: 10.1016/j.ymthe.2018.02.008. Epub 2018 Feb 14. Mol Ther. 2018. PMID: 29506908 Free PMC article. - Different in vivo impacts of dynamin 2 mutations implicated in Charcot-Marie-Tooth neuropathy or centronuclear myopathy.
Massana Muñoz X, Buono S, Koebel P, Laporte J, Cowling BS. Massana Muñoz X, et al. Hum Mol Genet. 2019 Dec 15;28(24):4067-4077. doi: 10.1093/hmg/ddz249. Hum Mol Genet. 2019. PMID: 31628461 - Centronuclear myopathies: a widening concept.
Romero NB. Romero NB. Neuromuscul Disord. 2010 Apr;20(4):223-8. doi: 10.1016/j.nmd.2010.01.014. Epub 2010 Feb 23. Neuromuscul Disord. 2010. PMID: 20181480 Review. - Centronuclear (myotubular) myopathy.
Jungbluth H, Wallgren-Pettersson C, Laporte J. Jungbluth H, et al. Orphanet J Rare Dis. 2008 Sep 25;3:26. doi: 10.1186/1750-1172-3-26. Orphanet J Rare Dis. 2008. PMID: 18817572 Free PMC article. Review.
Cited by
- Multi-omics comparisons of different forms of centronuclear myopathies and the effects of several therapeutic strategies.
Djeddi S, Reiss D, Menuet A, Freismuth S, de Carvalho Neves J, Djerroud S, Massana-Muñoz X, Sosson AS, Kretz C, Raffelsberger W, Keime C, Dorchies OM, Thompson J, Laporte J. Djeddi S, et al. Mol Ther. 2021 Aug 4;29(8):2514-2534. doi: 10.1016/j.ymthe.2021.04.033. Epub 2021 May 1. Mol Ther. 2021. PMID: 33940157 Free PMC article. - Translational medicine in neuromuscular disorders: from academia to industry.
Cowling BS, Thielemans L. Cowling BS, et al. Dis Model Mech. 2019 Oct 24;13(2):dmm041434. doi: 10.1242/dmm.041434. Dis Model Mech. 2019. PMID: 31658990 Free PMC article. Review. - New Therapeutics Options for Pediatric Neuromuscular Disorders.
Flotats-Bastardas M, Hahn A. Flotats-Bastardas M, et al. Front Pediatr. 2020 Nov 23;8:583877. doi: 10.3389/fped.2020.583877. eCollection 2020. Front Pediatr. 2020. PMID: 33330280 Free PMC article. Review. - Antagonistic control of active surface integrins by myotubularin and phosphatidylinositol 3-kinase C2β in a myotubular myopathy model.
Samsó P, Koch PA, Posor Y, Lo WT, Belabed H, Nazare M, Laporte J, Haucke V. Samsó P, et al. Proc Natl Acad Sci U S A. 2022 Oct 4;119(40):e2202236119. doi: 10.1073/pnas.2202236119. Epub 2022 Sep 26. Proc Natl Acad Sci U S A. 2022. PMID: 36161941 Free PMC article. - A dog model for centronuclear myopathy carrying the most common DNM2 mutation.
Böhm J, Barthélémy I, Landwerlin C, Blanchard-Gutton N, Relaix F, Blot S, Laporte J, Tiret L. Böhm J, et al. Dis Model Mech. 2022 Apr 1;15(4):dmm049219. doi: 10.1242/dmm.049219. Epub 2022 Apr 14. Dis Model Mech. 2022. PMID: 35244154 Free PMC article.
References
- Romero NB. Centronuclear myopathies: A widening concept. Neuromuscul Disord. 2010;20:223–228. - PubMed
- Jungbluth H, et al. Congenital myopathies: Disorders of excitation-contraction coupling and muscle contraction. Nat Rev Neurol. 2018;14:151–167. - PubMed
- Bitoun M, et al. Mutations in dynamin 2 cause dominant centronuclear myopathy. Nat Genet. 2005;37:1207–1209. - PubMed
Publication types
MeSH terms
Substances
LinkOut - more resources
Full Text Sources
Other Literature Sources
Molecular Biology Databases
Research Materials


