Galanin neurons in the ventrolateral preoptic area promote sleep and heat loss in mice - PubMed (original) (raw)
Fig. 1
Expression of AAV-ChR2 in VLPOGAL neurons in GAL-IRES-Cre mice. a Schematic representation of viral vector injections and implantation of optical fibers and EEG/EMG leads. b Outlines of viral injection sites in the VLPO at two levels (equivalent to AP: +0.26 and +AP: 0.14 in Ref. ); Animal IDs (n = 10 mice) and the percentage increase in NREM sleep observed after photoactivation in each mouse is represented in matching colors. c cFos expression (black nuclei) in mCherry-expressing neurons (brown) after 2 h of optical stimulation (1 Hz, 10 ms) in VLPOGAL-mCherry mice (left) and VLPOGAL-ChR2 mice (right). 3 V, 3rd Ventricle; AC anterior commissure; OC optic chiasm; MnPO median preoptic nucleus; MPO medial preoptic area; PvPO periventricular preoptic area; VLPO ventrolateral preoptic area; VLPOc VLPO core; VLPOed VLPO extended dorsal; VLPOem VLPO extended medial. Scale bars in c are 200 μm (upper panels) and 50 μm (lower panels)
Fig. 2
Optogenetic activation of VLPOGAL neurons increases NREM sleep. a In vitro stimulation of ChR2-expressing VLPOGAL neurons-one minute recordings with 10 ms pulses at 0.5, 1, 2, 4, 8, 16 Hz (middle column showing the first 30 s of stimulation); first three pulses (left column) and last three pulses (right column); dotted line represents the 0 mV level; laser stimulations in blue above traces. Note that stimulation rates of 8 Hz or above fail to elicit action potentials after the first laser pulses. b Quantification of stimulation-induced action potentials over the first minute of stimulation in a, one-way ANOVA for treatment, followed by Tukey’s post hoc test; F(5, 57) = 16.11, p < 0.0001 (n = 13 cells from three mice). c Frequency dependence of NREM sleep with optical stimulation (two-way repeated measures (RM) ANOVA for 2 h of recording time for ‘virus type’ and ‘stimulation frequency’ followed by Sidak’s post hoc test (virus type: F(1,14) = 31.69, p < 0.0001; stimulation frequency: F(6,84) = 5.809, p < 0.0001), n = 10 VLPOGAL-ChR2 mice vs. n = 6 VLPOGAL-mCherry mice). d Representative sample traces of EEG/EMG recordings during baseline (upper traces) and 1 Hz photostimulation of VLPOGAL neurons (lower traces); note large-amplitude and low frequency events in wake, NREM and REM sleep during stimulation; scale bar is 2 s. e EEG spectral analysis for NREM sleep, REM sleep and wake during 2 h of 1 Hz stimulation (Mann–Whitney test: NREM (Delta p = 0.0390, Theta p = 0.0390), REM (Delta p = 0.0028, Theta p = 0.1063), wake (Delta p = 0.0017, Theta p = 0.0110), n = 10 VLPOGAL-ChR2 mice vs. n = 6 VLPOGAL-mCherry mice). Data are Mean ± SEM. ∗p < 0.05, ∗∗p < 0.01, ∗∗∗p < 0.001, ∗∗∗∗p < 0.0001
Fig. 3
Optogenetic inhibition of VLPOGAL neurons decreases NREM sleep. a Schematic representation of AAV injections and implantation of optical fibers and EEG/EMG leads. b In vitro whole-cell recordings in current clamp mode from VLPOGAL neurons expressing ArchT-GFP. Yellow/orange-light pulses (5 min duration) strongly hyperpolarized (difference in resting membrane potential between the last 10 s prior to laser pulse vs. the last 10 s of laser illumination was 28.4 ± 3.7 mV; p = 0.00026, paired t_-test, n = 7 neurons in three mice) VLPOGAL neurons expressing ArchT and abolished action potentials (dotted line: 0 mV). c In vivo inhibition of VLPOGAL neurons by yellow/orange laser light (593.5 nm wavelength; ~10 mW/mm2 illumination at fiber tip) applied for 5 min every 30 min decreased the percent time spent in NREM sleep during the 12 h dark period. We compared 5 min periods ‘before’, ‘during’, and ‘after’ the photoinhibition using a one-way repeated measures ANOVA for ‘treatment groups’, followed by Tukey’s post hoc test (F(2, 12) = 15.86, p = 0.0005, n = 7 mice. d Sham photoinhibition did not alter the amount of NREM sleep in the same mice. Data are Mean ± SEM. ∗_p < 0.05, ∗∗p < 0.01. Scale bars in b are 20 mV, 50 s
Fig. 4
Chemoactivation of VLPOGAL neurons by CNO. a Schematic representation of viral vector injections. b Outlines of AAV-hM3Dq injection sites in VLPO at two levels (equivalent to AP: +0.26 and AP: +0.14 in Ref. ; Animal IDs (n = 15 mice) and the magnitude of hypothermia observed after chemoactivation in each mouse is represented in matching colors c cFos expression (black nuclei) in mCherry-expressing neurons (brown) 3 h after i.p. injections of CNO (0.3 mg/kg) in VLPOGAL-mCherry mice (left) and VLPOGAL-hM3Dq mice (right). d Representative trace of in vitro activation of an hM3Dq-expressing VLPOGAL neuron with 1 μM CNO (n = 5 cells from five mice). 3 V, 3rd Ventricle; AC Anterior commissure; OC optic chiasm; MnPO Median preoptic nucleus; MPO Medial preoptic area; PvPO Periventricular preoptic area; VLPO Ventrolateral preoptic area; VLPOc. VLPO core; VLPOed, VLPO extended dorsal; VLPOem, VLPO extended medial. Scale bars in c 200 μm (upper panels) and 50 μm (lower panels) and d 20 mV, 60 s
Fig. 5
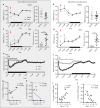
Chemoactivation of VLPOGAL neurons promotes NREM sleep and hypothermia. a, b Percentages of NREM sleep every 4 h for 24 h after saline or CNO administration (red arrow) at 19:00 h a or 10:00 h b and respective NREM sleep latencies. Two-way repeated measures (RM) ANOVA for the first 12 h after treatment for ‘time’ and ‘compound injected’, followed by Sidak’s post hoc test (19:00 h injections (n = 9 mice): time F(2,32) = 2.398, p = 0.1070, compound injected F(1,16) = 22.76, p = 0.0002; 10:00 h injections (n = 13 mice): time F(2,48) = 77.29, p < 0.0001, compound injected F(1,24) = 28.92, p < 0.0001). c, d Percentages of REM sleep after saline or CNO at 19:00 h c or 10:00 h d with respective REM sleep latencies. Two-way RM ANOVA followed by Sidak’s post hoc test (19:00 h injections (n = 9 mice): time F(2,32) = 10.77, p = 0.0003, compound injected F(1,16) = 7.763, p = 0.0132; 10:00 h injections (n = 13 mice): time F(2,48) = 11.75, p < 0.0001, compound injected F(1,24) = 41.06, p < 0.0001); Wilcoxon matched-pairs signed-rank test for REM sleep latencies (19:00 h injections p = 0.0010; 10:00 h injections p = 0.0002). e, f T_b after saline or CNO at 19:00 h e or 10:00 h f; dotted lines represent SEM; Two-way RM ANOVA for the first 12 h after treatment for ‘time’ and ‘compound injected’, followed by Sidak’s post hoc test (19:00 h injections: time F(143, 4004) = 19.4, p < 0.0001, compound injected F(1,28) = 19.09, p = 0.0002; n = 15 mice; 10:00 h injections: time F(143,4290) = 65, p < 0.0001, compound injected F(1,30) = 29.78, p < 0.0001; n = 16 mice). g, i Correlation between percentage change in NREM sleep and fall in T_b after CNO at 19:00 h g or 10:00 h i; Pearson correlation (19:00 h injections: r = 0.5831, p = 0.1292, n = 8 mice; 10:00 h injections: r = 0.7076, p = 0.01; n = 12 mice). h, j Correlation between percentage change in REM sleep and fall in T_b after CNO at 19:00 h h or 10:00 j; Pearson correlation (19:00 h injections r = 0.4093, p = 0.3140, n = 8 mice; 10:00 injections: r = 0.5749, p = 0.0505; n = 12 mice). Red arrows indicate saline/CNO injections. Data are Mean ± SEM, except sleep latencies which are Mean ± SD, ∗_p < 0.05, ∗∗_p < 0.01, ∗∗∗_p < 0.001, ∗∗∗∗p < 0.0001
Fig. 6
Warm ambient temperatures (_T_a) enhance NREM sleep with chemoactivation of VLPOGAL neurons. a Schematic of experimental paradigm: baseline _T_a 22 °C and exposure to _T_a 29 °C and 36 °C. b Mean _T_b for 2 h after saline/CNO (0.3 mg/kg) injections at 19:00 h in different _T_a: Two-way repeated measures (RM) ANOVA for 2 h after treatment for ‘_T_a’ and ‘compound injected’, followed by Sidak’s post hoc test (_T_a: F(2,28) = 46.87, p < 0.0001, compound injected: F(1,14) = 26.26, p = 0.0002; n = 8 mice). c Percentages of NREM sleep for 2 h after saline or CNO treatment in different _T_a: Two-way RM ANOVA followed by Sidak’s post hoc test (_T_a: F(2,28) = 28.29, p < 0.0001, compound injected: F(1,14) = 40.08, p < 0.0001; n = 8 mice). d NREM latencies after saline or CNO injections in different _T_a: Two-way RM ANOVA followed by Sidak’s post hoc test (_T_a: F(2,28) = 0.1369, p = 0.0002, compound injected: F(1,14) = 5.12, p = 0.0401; n = 8 mice). e CNO/Saline ratio of NREM delta power for 2 h after saline or CNO treatment in different _T_a. One-way ANOVA (Friedman test) for 2 h after treatment for ‘_T_a‘, followed by Dunn’s multiple comparisons test (p = 0.0303); f Percentages of REM sleep for 2 h after saline or CNO treatment in different _T_a: Two-way RM ANOVA followed by Sidak’s post hoc test (T_a: F(2,28) = 3.228, p = 0.0548, compound injected: F(1,14) = 20.19, p = 0.0005; n = 8 mice). g Cumulative REM sleep amounts every 4 h for 24 h after saline or CNO at T_a 29 °C during the light period (10:00 h). Note that animals at 29 °C who received CNO had less REM sleep in the initial 4 hours, but by the end of the next 16 hours REM rebound resulted in catching up to animals treated with saline: Two-way RM ANOVA for ‘time’ and ‘compound injected’, followed by Sidak’s post hoc test (time: F(5,170) = 391.5, p < 0.0001, compound injected: F(3,34) = 12.79, p < 0.0001; n = 13 mice (T_a 22 °C), n = 6 mice (T_a 29 °C). Data are Mean ± SEM, ∗_p < 0.05, ∗∗_p < 0.01, ∗∗∗_p < 0.001, ∗∗∗∗_p < 0.0001
Fig. 7
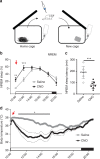
Chemogenetic activation of VLPOGAL neurons attenuates sleep-onset insomnia. a Schematic of experimental setup showing mice introduced to a new cage with fresh nesting material immediately after i.p. injections of either saline or CNO. b Percentages of NREM sleep every 2 h for 12 h after saline or CNO (0.3 mg/kg) injections and cage change at 10:00 h. Typically, mice introduced to a new cage during the day (when they usually sleep about 60% of the time) have reduced sleep for 2–4 h with a prolonged latency to first NREM sleep. This is rescued by activation of VLPOGAL neurons. Two-way repeated measures (RM) ANOVA for the first 6 h after treatment for ‘time’ and ‘compound injected’, followed by Sidak’s post hoc test (time: F(3,36) = 64.72, p < 0.0001, compound injected: F(1,12) = 8.644, p = 0.0124; n = 7 mice). c NREM sleep latencies after injections and cage change: Wilcoxon matched-pairs signed-rank test (p = 0.0156; n = 7 mice). d T_b after injections and cage change. Two-way RM ANOVA for the first 6 h after treatment for ‘time’ and ‘compound injected’, followed by Sidak’s post hoc test (time: F(71,852) = 14.72, p < 0.0001, compound injected: F(1,12) = 15.21, p = 0.0021; n = 7 mice). Red arrows indicate saline/CNO injections. The data are Mean ± SEM, except sleep latencies which are Mean ± SD, ∗_p < 0.05, ∗∗p < 0.01, ∗∗∗p < 0.001


