Patient-derived frontotemporal lobar degeneration brain extracts induce formation and spreading of TDP-43 pathology in vivo - PubMed (original) (raw)
Fig. 1
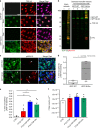
Inducible cytoplasmic TDP-43 cell-based assay for screening of FTLD-TDP brain-extract seeding activity. a Representative photomicrographs of IF analysis to detect TDP-43 proteins (red and merge) in iGFP-WT and iGFP-NLSm cells in the absence of Dox (Dox−) or after 72 h of Dox treatment (Dox+). Expression of GFP-WT or GFP-NLSm proteins (green) is detectable after Dox treatment (Dox+). Cells were counterstained with DAPI to label the nuclei. Scale bar = 20 µm. b Immunoblot analysis of the sarkosyl-insoluble fraction from CTRL and FTLD-TDP brains used as a seeds (left panel, lanes #1 and #2, respectively) and sarkosyl-insoluble extracts from iGFP-WT and iGFP-NLSm cells (right panels) transduced with CTRL or FTLD-TDP seeds at 3 dpt. A C-terminal TDP-43 antibody (C1039, green) was used to detect total TDP-43 protein and the phospho-specific Ser409/Ser410 mAb (p409-410, red) was used for detection of the insoluble/pathological TDP-43. GFP-WT or GFP-NLSm were detected at ~69 KDa, CTFs ~25–20 KDa, and endogenous TDP-43 at ~43 KDa (arrow). c Representative photomicrographs of IF analysis using the p409–410 (red and merge) in iGFP-WT and iGFP-NLSm cells (green and merge) transduced with FTLD-TDP extracts at 3 dpt. Arrows point to p409–410-positive aggregates. Cells were counterstained with DAPI to label the nuclei. Scale bar = 20 µm. d Plots show the percentage of area occupied by p409–410 immunostaining in iGFP-WT and iGFP-NLSm cells at 3 dpt. Box-and-whisker plots show the median (solid line) and whiskers indicate the minimum and maximum values, with individual points representing independent experiments (n = 4) overlaid as black circles. Unpaired two-tailed Student's t test was used for the analysis. ∗P < 0.05. In e, plots show the quantification of the percentage of area occupied by p409-410 staining in iGFP-NLSm cells transduced with sporadic FTLD-TDP (red), FTLD-TDP-GRN (blue), FTLD-TDP-C9+ (green), and CTRL (white) extracts and the number of DAPI counts µm−2 in f. In e, f, bar plots show mean and whiskers s.e.m., with individual points representing a different brain extract overlaid as black circles. A one-way ANOVA followed by a Tukey’s multiple comparisons test was used for the analysis; in e, treatment; P = 0.004, F = 7.08, degrees of freedom (DF) = 3. ∗P < 0.05 and ∗∗P < 0.01
Fig. 2
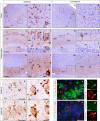
FTLD-TDP-GRN extracts induce de novo TDP-43 pathology in CamKIIa-hTDP-43NLSm mice. Representative photomicrographs of p409-410 IHC staining in the cortex (layers I–VI, a–d) and hippocampus (e–n) of injected CamKIIa-hTDP-43NLSm mice at 1 mpi (n = 3) in ipsilateral and contralateral sides of the brain. Higher magnifications of the black-dashed boxes in a, c show p409-410-positive staining in cortical cells in b, d. Arrow in b points to the cell magnified in the inset. e–n show p409-410 immunostaining in the hippocampus: CA1 layer, stratum radiatum (rad), stratum oriens (or), dentate gyrus (DG), and subiculum (Sub). Higher magnifications of the black-dashed boxes in e, h, k, m show CA1 pyramidal cells (f, i), granule cells (Gr) and mossy fibers (MF) (g, j) and Sub (l, n). Arrows in f, g, l point to cells magnified in the insets. o–r show p409-410 and p403-404 IHC staining in adjacent sections of hippocampus from injected CamKIIa-hTDP-43NLSm mice at 1 mpi. p, r show higher magnifications of the black-dashed boxes in o, q, respectively, and arrow points to the same neuron bearing NCIs positive for p409-410 (p) and p403-404 (r). s, t show representative double-label IF images of p409-410 (red) staining and hTDP-43 (s, green) and mouse TDP-43 (t, green). Asterisks in s indicate the primary cytoplasmic distribution of hTDP-43NLSm protein. Panels at the far right depict higher magnifications of the white-dashed boxes in s and t, showing co-localization with aggregates positive for p409-410 (red, white arrow) and hTDP-43NLSm (green, white arrow) or nuclear clearance and reduced recruitment of mTDP-43 (green, white arrow) into p409-410-positive aggregates (red, white arrow). Scale bar = 200 µm (a, c, e, h, k, m), 50 µm (l, m, o, g, s, t) 20 µm (b, d, f, g, i, j) and 10 µm (right panels in s, t and insets)
Fig. 3
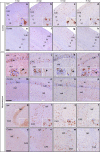
TDP-43 pathology distribution in the cortex and hippocampus in CamKIIa-hTDP43NLSm mice. Representative photomicrographs of p409-410 IHC staining in coronal brain sections of cortex (layers I–VI, a–h) and hippocampus (i–x) from injected CamKIIa-hTDP43NLSm mice analyzed at 1 mpi (n = 3), 3 mpi (n = 2), 5 mpi (n = 3), and 9 mpi (n = 3) in the ipsilateral (Ipsi) and contralaleral (Contra) side of injection. In the cortex, a–h show p409-410 staining in cortical layers, insets are higher magnifications of the white boxes in a–d. In the hippocampus, i–p show p409-410-positive staining in CA1 layer, stratum radiatum (rad), and stratum oriens (or). Insets are higher magnifications of the white boxes in i–l. Arrows point to p409-410-positive NCIs in CA1 layer and arrowheads point to p409-410-positive neuronal neuritic processes in rad. q–x show p409-410 staining in CA3 layer and mossy fibers (MF). Insets are a higher magnifications of the white boxes in q-t showing p409-410-positive staining in MF (q) and CA3 neurons (r–t). Scale bar = 200 µm (a–h), 100 µm (i–x), and 20 µm (insets)
Fig. 4
Heat maps show time-dependent spreading pattern of TDP-43 pathology. Heat maps show the distribution and burden of TDP-43 pathology in neurons and in white matter tracts in the brains of CamKIIa-hTDP-43NLSm mice at different post-injection times (1, 3, 5, and 9 mpi) in ipsilateral (Ipsi) and contralateral (Contra) sides. The panels in the far left column illustrate sagittal views of the corresponding coronal planes (blue line) and three sites of the injection into cortex, hippocampus, and thalamus (red asterisks). Each panel represents a coronal plane (Bregma; 2.10 mm, 0.98 mm, −2.18 mm, −3.52 mm, −4.48 mm, and −6.84 mm) for the different post-injection times. The burden of TDP-43 pathology was graded from negative (0, gray) to most abundant (3, red) and color-coded (scale bar) in the six representative coronal sections illustrated here depicting rostral to causal brain regions. Heat maps represent the mean values of the grades TDP-43 pathology from n = 3 mice at 1 mpi, n = 2 mice at 3 mpi, n = 3 mice at 5 mpi, and n = 3 mice at 9 mpi
Fig. 5
TDP-43 pathology spreading to rostral deep brain nuclei and white matter tracts. Representative photomicrographs of p409-410 IHC staining in rostral deep brain nuclei distal from the injection sites and white matter tracts over time in CamKIIa-hTDP-43NLSm mice at 1 mpi (n = 3), 3 mpi (n = 2), 5 mpi (n = 3), and 9 mpi (n = 3). The panels in the far left column illustrate sagittal views of the corresponding coronal planes (blue line) and three sites of the injection into cortex, hippocampus, and thalamus (red asterisks). p409-410 IHC staining in nucleus accumbens (Acb) (a–d, bregma 1.18 mm), septum (e–h, lateral septum (LS), bregma 0.50 mm), and white matter tracts in fornix (i–l, dorsal fimbria (df) and ventral hippocampal commissure (vhc), bregma −0.58 mm) and pyramidal fiber tracts (Py) (m–p, Bregma −6.72 mm). Insets are higher magnifications of the white boxes in a–h and m–p. Scale bar = 100 µm (a–d, i–l, and m–p), 500 µm (e–h) and 20 µm (insets)
Fig. 6
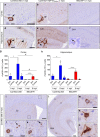
TDP-43 mislocalization increases seeding efficiency and spread of pathology. Representative photomicrographs of p409-410 IHC staining in the cortex and hippocampus of CamKIIa-208 (a, d), CamKIIa-hTDP-43NLSm (b, e) and B6C3HF1 (c, f) mice at 1 mpi. Insets are higher magnifications of white framed areas. Arrows and arrowhead points to p409-410-positive NCIs and dendrites, respectively. g, h Plot shows number of p409-410-positive cells in the cortex and hippocampus in Ipsi and Contra sides of CamKIIa-208 (blue bars) and B6C3HF1 mice (red bars) at 1 and 9 mpi. Bar plots show mean and whiskers s.e.m., with individual points representing different mouse overlaid as black circles. Two-way ANOVA followed by a Sidak’s multiple comparisons test was used to compare time points (Factor, P value (F, degrees of freedom)); in g CamKIIa-208 (Cx): side P = 0.019 (8.55, 1), time P = 0.020 (8.32, 1), and interaction P = 0.137 (2.72, 1); B6C3HF1 (Cx): side P = 0.008 (11.97, 1), time P = 0.028 (7.12, 1), and interaction P = 0.105 (3.32, 1). In h CamKIIa-208 (Hp): side P < 0.0001 (85.98, 1), time P < 0.0001 (81.74, 1), and interaction P < 0.0001 (77.6, 1); B6C3HF1 (Hp): side P < 0.0001 (94.6, 1), time P < 0.0001 (78.8, 1), and interaction P < 0.0001 (65.69, 1). ∗P < 0.05, ∗∗∗∗P < 0.0001. Two-way ANOVA followed by Sidak’s multiple comparisons test was used to compare genotypes; in g Cx (ipsi); genotype P = 0.007 (11.71, 1), time P = 0.010 (10.42, 1), and interaction P = 0.008 (3.78, 1); Cx (contra): genotype P = 0.033 (6.26, 1), time, P = 0.041 (5.63, 1), and interaction P = 0.0456 (5.37, 1). In h Hp (Ipsi): genotype P = 0.054 (4.88, 1), time P = 0.002 (17.57, 1), and interaction P = 0.483 (0.53, 1); Hp (contra): genotype P = 0.107 (3.20, 1), time P = 0.038 (5.86, 1), and interaction P = 0.119 (2.95, 1). #P < 0.05. i–o show p409-410 immunostaining in areas distal from the injection site in CamKIIa-208 mice at 9 mpi. Higher magnifications of black framed areas in i and l show p409-410 NCIs in cingulate cortex (j), caudate putamen (Cp) (k), superficial and deep cortical layers (m, n, respectively), and lateral entorhinal cortex (Lent) (o). Arrows in j and k point to p409-410-positive neurons magnified in insets. Scale bar = 200 µm (i, l), 50 µm (j, k) and 10 µm (m–o and insets)


