Cdh1 and Pik3ca Mutations Cooperate to Induce Immune-Related Invasive Lobular Carcinoma of the Breast - PubMed (original) (raw)
. 2018 Oct 16;25(3):702-714.e6.
doi: 10.1016/j.celrep.2018.09.056.
Jessica R Adams 2, Daniel P Hollern 3, Anthony Zhao 4, Stephen G Chang 4, Miki S Gams 4, Philip E D Chung 5, Xiaping He 3, Rhea Jangra 2, Juhi S Shah 2, Joanna Yang 2, Lauren A Beck 2, Nandini Raghuram 1, Katelyn J Kozma 1, Amanda J Loch 2, Wei Wang 2, Cheng Fan 3, Susan J Done 6, Eldad Zacksenhaus 5, Cynthia J Guidos 4, Charles M Perou 7, Sean E Egan 8
Affiliations
- PMID: 30332649
- PMCID: PMC6276789
- DOI: 10.1016/j.celrep.2018.09.056
Cdh1 and Pik3ca Mutations Cooperate to Induce Immune-Related Invasive Lobular Carcinoma of the Breast
Yeji An et al. Cell Rep. 2018.
Abstract
CDH1 and PIK3CA are the two most frequently mutated genes in invasive lobular carcinoma (ILC) of the breast. Transcription profiling has identified molecular subtypes for ILC, one of which, immune-related (IR), is associated with gene expression linked to lymphocyte and macrophage infiltration. Here, we report that deletion of Cdh1, together with activation of Pik3ca in mammary epithelium of genetically modified mice, leads to formation of IR-ILC-like tumors with immune cell infiltration, as well as gene expression linked to T-regulatory (Treg) cell signaling and activation of targetable immune checkpoint pathways. Interestingly, these tumors show enhanced Rac1- and Yap-dependent transcription and signaling, as well as sensitivity to PI3K, Rac1, and Yap inhibitors in culture. Finally, high-dimensional immunophenotyping in control mouse mammary gland and IR-ILC tumors by mass cytometry shows dramatic alterations in myeloid and lymphoid populations associated with immune suppression and exhaustion, highlighting the potential for therapeutic intervention via immune checkpoint regulators.
Keywords: Cdh1; Hif1a; Pik3ca; Rac1; Yap; immune checkpoint; immune infiltration; lobular breast cancer; tumor-associated macrophages; tumor-infiltrative lymphocytes.
Copyright © 2018 The Authors. Published by Elsevier Inc. All rights reserved.
Conflict of interest statement
DECLARATION OF INTERESTS
The authors declare no competing interests.
Figures
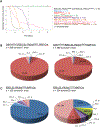
Figure 1.. Cdh1 and Pik3ca Mutations Cooperate to Induce Mammary Tumor Formation in Mice
(A) Kaplan-Meier mammary tumor-free survival curves show mammary tumor latency in cohorts of mice with mammary-specific deletion of Cdh1 and expression of activated Pik3ca (Pik3ca E545K and Pik3ca H1047R) compared with mice with either mutation or other controls. A dashed line is included to highlight the date at which mammary tumor-free survival lines cross for mice from _Pik3ca_E545K cohorts ± Cdh1 homozygous deletion. (B)Pie chart representation of mammary tumor pathology in female mice from Cdh1 loxP/loxP;R26-LSL-Pik3ca E545K;WAP-Cre and Cdh1 loxP/loxP;R26-LSL-Pik3ca H1047R;WAP-Cre cohorts. (C) Pie chart representation of mammary tumor pathology in female mice from R26-LSL-Pik3ca E545K; WAP-Cre and R26-LSL-Pik3ca E545K;WAP-Cre cohorts. Acin, acinar adenocarcinoma; AME, adenomyoepithelioma; ASC, adenosquamous carcinoma; CAC, complex adenocarcinoma; KA, keratoacanthoma; PDA, poorly differentiated adenocarcinoma; RS, radial scar; SC, squamous cyst; SCC, squamous cell carcinoma; SCT, spindle cell tumor; SNC, solid nodular carcinoma; ST, scirrhous tumor; STC, scirrhous tubular carcinoma.
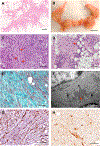
Figure 2.. _Cdh1_loxP/loxP;_Pik3ca_mut Mammary Tumors Share Morphological Features with Human ILC
(A) Cdh1 loxP/loxP ;Pik3ca H1047R mouse tumor with diffusely infiltrative borders. (B) Cdh1 loxP/loxP ;Pik3caH1047R tumor network connecting mammary glands 4 and 5 on each side of the midline. (C) Cdh1 loxP/loxP ;Pik3ca H1047R mammary tumor with ILC-like single-file invasive growth pattern (red arrows). (D) Mouse tumor with targetoid growth (red arrows). (E) Masson trichrome staining reveals an abundance of collagen between rows of tumor cells. (F) Electron microscopy shows a small apical lumen between tumor cells (red arrow) with adjacent junctional complexes (black arrows). (G and H) Cdh1 loxP/loxP;R26-Pik3ca H1047R tumors express the estrogen receptor (G) and progester-one receptor (H). See also Figure S2. Scale bars, 500, 5, 50, 50, 50, 1, 50, and 50 mm for (A)–(H), respectively.
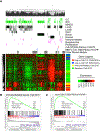
Figure 3.. Relationship of _Cdh1_loxP/loxP;R26-_Pik3ca_H1047R Tumors to Human Breast Cancer
(A) The dendrogram at the top illustrates relationships between human and mouse tumor samples. All human samples are from a TCGA (The Cancer Genome Atlas) cohort that includes invasive ductal carcinoma (IDC) from all major subtypes as well as ILC (Ciriello et al., 2015). This collection includes tumors from each intrinsic subtype. All mouse samples are from Pfefferle et al. (2013), plus the ten ILC-like samples described in this paper. Immediately below, color bars mark the position of each tumor type in the dendrogram and in the heatmap. Green bars mark the pathology, and black bars mark the intrinsic subtype of human tumors. The magenta bars mark the ILC-subtype calls (Ciriello et al., 2015). The heatmap displays the median centered expression level (log2) of each gene in a given sample; expression levels are depicted by the color bar on the right-hand side. On the right hand side of the heatmap, the color bar marks individual gene annotations for presence in a given signature. (B) Gene set enrichment analysis comparing Cdh1 loxP/loxP;R26-Pik3ca H1047R tumors with all other mouse mammary tumors reveals significant enrichment of the immune-related ILC signature (Ciriello et al., 2015) (normalized enrichment score = 1.83, nominal p value = 0.01, false discovery rate [FDR] q value = 0.01, family-wise error rate [FWER] p value = 0.03). (C) Gene set enrichment analysis comparing immune-related ILC tumors that clustered with mouse Cdh1 loxP/loxP;R26-Pik3ca H1047R tumors with all other luminal A IDC tumors reveals significant enrichment of the genes that were upregulated in mouse Cdh1 loxP/loxP;R26-Pik3ca H1047R tumors (normalized enrichment score = 1.62, nominal p value = 0.01, FDR q value = 0.07, FWER p value = 0.1).
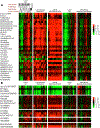
Figure 4.. Shared Elevation of Immune and Pathway Signatures in _Cdh1_loxP/loxP;_R26-Pik3ca_H1047R Tumors and Luminal A ILC Tumors
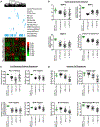
(A) The heatmap displays the expression of published gene expression signatures for immune cell types. Signature expression is displayed as the median expression of all genes within a signature for each sample according to the color bar on the right. (B) The heatmap displays the expression of published pathway signatures for each tumor type. Tumors are grouped according to their tumor classification, with the immune-related group containing those that co-clustered with the murine Cdh1 mutant tumors. Within each class, samples are ordered on the basis of centroid linkage for the signatures shown in both panels. Importantly, sample ordering in (A) is preserved in (B). Signatures were obtained from the Broad Institute’s molecular signature database (Subramanian et al., 2005; Liberzon et al., 2011).
Figure 5.. Comparative Analysis of Mouse Models for ILC
(A) Hierarchical clustering of our domestic dataset with imported data from PRJEB14134 and PRJEB14147 following batch correction. Genes were filtered to include only intrinsic gene sets and the dendrogram assembled by centroid linkage. Beneath the dendrogram, blue bars depict the position of tumors according to row annotations. (B) Plots show expression levels for genes and signatures associated with tumor cell invasion (*p < 0.05). (C) Plots show expression levels for cell signaling pathway signatures (*p < 0.05). (D) Plots show expression levels for immune cell signatures (*p < 0.05). Bars depict the average and the SD in both directions.
Figure 6.. mILC Tumorspheres Are Sensitive to Inhibition of PI3K, Rac1, and Yap Signaling
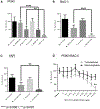
(A) Sensitivity of normal mouse mammospheres (n = 3, in triplicate, where n represents the number of cell lines from independent animals) and mILC tumorspheres (n = 3, in triplicate) to the pan-PI3K inhibitor buparlisib (BKM120) (5 μM) and PI3Kα inhibitor alpelisib (BYL719) (8 μM). (B) Sensitivity of normal mouse mammospheres (n = 3, in triplicate) and mILC tumorspheres (n = 3, in triplicate) to Rac1 inhibitor (NSC23766) (250 μM). (C) Sensitivity of normal mouse mammospheres (n = 3, in triplicate) and mILC tumorspheres (n = 3, in triplicate) to the YAP inhibitor verteporfin (5 μg/mL). (D) Sensitivity of normal mouse mammospheres (n = 3, in triplicate) and mILC tumorspheres (n = 3, in triplicate) to combined treatment with BYL719 and NSC23766. Bars depict the average and the SD above the average (A–C) or in both directions (D).
Figure 7.. Identification of Immune Cell Subsets and Differentiation States in ILC
(A) Left: representative t-SNE plots of CD45+ cells present in enzymatically dissociated mammary gland (MG) from a control (CTRL) (top) versus tumor (bottom) mouse. Maps were colored in the z dimension by Phenograph cluster number (left) or the indicated myeloid markers. Right: bar graphs show the median (percentage) of each CD11b+ cluster among total myeloid cells. Vertical lines extending above each bar showing the range of values observed for each cluster. Arrows point to clusters that showed significantly different relative abundance between genotypes by multiple t testing, using a false discovery framework (FDR) of 5% to yield adjusted p values, referred to as q values. Significant differences are noted as follows: *q < 0.05, **q < 0.005, and ***q < 0.0005. Clusters not marked with asterisks were not differentially abundant between genotypes. (B) Left: representative t-SNE plots of CD3+ T cells in the same MG samples shown in (A), colored in the z dimension by Phenograph cluster number or the indicated T cell markers. Right: box-and-whisker plots show the percentage of PD1+ cells (top) or the median PD1 intensity among PD1+ cells (bottom) identified manually within the CD8b+, CD8b FoxP3 and CD8b FoxP3+ regulatory T subsets (n = 4/group). Means are identified with a horizontal line on each bar, and whiskers show 10th to 90th percentile values. Asterisks denote significant FDR-adjusted q values as described for (A).
Similar articles
- Truncated ASPP2 Drives Initiation and Progression of Invasive Lobular Carcinoma via Distinct Mechanisms.
Schipper K, Drenth AP, van der Burg E, Cornelissen S, Klarenbeek S, Nethe M, Jonkers J. Schipper K, et al. Cancer Res. 2020 Apr 1;80(7):1486-1497. doi: 10.1158/0008-5472.CAN-19-3607. Epub 2020 Feb 14. Cancer Res. 2020. PMID: 32060147 Free PMC article. - Targeted capture massively parallel sequencing analysis of LCIS and invasive lobular cancer: Repertoire of somatic genetic alterations and clonal relationships.
Sakr RA, Schizas M, Carniello JV, Ng CK, Piscuoglio S, Giri D, Andrade VP, De Brot M, Lim RS, Towers R, Weigelt B, Reis-Filho JS, King TA. Sakr RA, et al. Mol Oncol. 2016 Feb;10(2):360-70. doi: 10.1016/j.molonc.2015.11.001. Epub 2015 Nov 14. Mol Oncol. 2016. PMID: 26643573 Free PMC article. - PTEN Loss in E-Cadherin-Deficient Mouse Mammary Epithelial Cells Rescues Apoptosis and Results in Development of Classical Invasive Lobular Carcinoma.
Boelens MC, Nethe M, Klarenbeek S, de Ruiter JR, Schut E, Bonzanni N, Zeeman AL, Wientjens E, van der Burg E, Wessels L, van Amerongen R, Jonkers J. Boelens MC, et al. Cell Rep. 2016 Aug 23;16(8):2087-2101. doi: 10.1016/j.celrep.2016.07.059. Epub 2016 Aug 11. Cell Rep. 2016. PMID: 27524621 Free PMC article. - Malignant phyllodes tumor and invasive lobular breast carcinoma: Morpho-molecular characterization of an uncommon collision tumor and review of the literature.
Schaumann N, Bartels S, Kuehnle E, Kreipe H, Christgen M. Schaumann N, et al. Pathol Res Pract. 2024 Feb;254:155100. doi: 10.1016/j.prp.2024.155100. Epub 2024 Jan 18. Pathol Res Pract. 2024. PMID: 38277744 Review. - Uncommon invasive lobular carcinoma with papillary architecture-clinicopathologic and molecular characterization with review of the literature.
Gessain G, Joyon N, Petit T, Cotteret S, Lacroix-Triki M. Gessain G, et al. Virchows Arch. 2023 Nov;483(5):723-729. doi: 10.1007/s00428-023-03526-5. Epub 2023 Mar 16. Virchows Arch. 2023. PMID: 36928170 Review.
Cited by
- Comprehensive Review of Molecular Mechanisms and Clinical Features of Invasive Lobular Cancer.
Pramod N, Nigam A, Basree M, Mawalkar R, Mehra S, Shinde N, Tozbikian G, Williams N, Majumder S, Ramaswamy B. Pramod N, et al. Oncologist. 2021 Jun;26(6):e943-e953. doi: 10.1002/onco.13734. Epub 2021 Mar 16. Oncologist. 2021. PMID: 33641217 Free PMC article. Review. - Coexistent ARID1A-PIK3CA mutations are associated with immune-related pathways in luminal breast cancer.
Anabel Sinberger L, Zahavi T, Sonnenblick A, Salmon-Divon M. Anabel Sinberger L, et al. Sci Rep. 2023 Nov 27;13(1):20911. doi: 10.1038/s41598-023-48002-x. Sci Rep. 2023. PMID: 38017109 Free PMC article. - Genetic Heterogeneity and Tissue-specific Patterns of Tumors with Multiple PIK3CA Mutations.
Sivakumar S, Jin DX, Rathod R, Ross J, Cantley LC, Scaltriti M, Chen JW, Hutchinson KE, Wilson TR, Sokol ES, Vasan N. Sivakumar S, et al. Clin Cancer Res. 2023 Mar 14;29(6):1125-1136. doi: 10.1158/1078-0432.CCR-22-2270. Clin Cancer Res. 2023. PMID: 36595567 Free PMC article. - Overcoming Xenoantigen Immunity to Enable Cellular Tracking and Gene Regulation with Immune-competent "NoGlow" Mice.
Trotter TN, Wilson A, McBane J, Dagotto CE, Yang XY, Wei JP, Lei G, Thrash H, Snyder JC, Lyerly HK, Hartman ZC. Trotter TN, et al. Cancer Res Commun. 2024 Apr 9;4(4):1050-1062. doi: 10.1158/2767-9764.CRC-24-0062. Cancer Res Commun. 2024. PMID: 38592453 Free PMC article. - Truncated ASPP2 Drives Initiation and Progression of Invasive Lobular Carcinoma via Distinct Mechanisms.
Schipper K, Drenth AP, van der Burg E, Cornelissen S, Klarenbeek S, Nethe M, Jonkers J. Schipper K, et al. Cancer Res. 2020 Apr 1;80(7):1486-1497. doi: 10.1158/0008-5472.CAN-19-3607. Epub 2020 Feb 14. Cancer Res. 2020. PMID: 32060147 Free PMC article.
References
- Adams JR, Xu K, Liu JC, Agamez NM, Loch AJ, Wong RG, Wang W, Wright KL, Lane TF, Zacksenhaus E, and Egan SE (2011). Cooperation between Pik3ca and p53 mutations in mouse mammary tumor formation. Cancer Res 71, 2706–2717. - PubMed
- Bailey JM, Singh PK, and Hollingsworth MA (2007). Cancer metastasis facilitated by developmental pathways: Sonic hedgehog, Notch, and bone morphogenic proteins. J. Cell. Biochem 102, 829–839. - PubMed
Publication types
MeSH terms
Substances
Grants and funding
- P30 ES010126/ES/NIEHS NIH HHS/United States
- R01 CA148761/CA/NCI NIH HHS/United States
- R01 CA195740/CA/NCI NIH HHS/United States
- R01 CA195754/CA/NCI NIH HHS/United States
- F32 CA210427/CA/NCI NIH HHS/United States
LinkOut - more resources
Full Text Sources
Molecular Biology Databases
Research Materials
Miscellaneous
