Alpha-synuclein fibrils recruit TBK1 and OPTN to lysosomal damage sites and induce autophagy in microglial cells - PubMed (original) (raw)
. 2018 Nov 30;131(23):jcs226241.
doi: 10.1242/jcs.226241.
Javier M Peralta Ramos 1, Daniela S Arroyo 1, Jose I Gallea 2, Paolo Ronchi 3, Androniki Kolovou 3, Ji M Wang 4, Oliver Florey 5, Maria S Celej 2, Yannick Schwab 3 6, Nicholas T Ktistakis 5, Pablo Iribarren 7
Affiliations
- PMID: 30404831
- PMCID: PMC6518333
- DOI: 10.1242/jcs.226241
Alpha-synuclein fibrils recruit TBK1 and OPTN to lysosomal damage sites and induce autophagy in microglial cells
Claudio Bussi et al. J Cell Sci. 2018.
Abstract
Autophagic dysfunction and protein aggregation have been linked to several neurodegenerative disorders, but the exact mechanisms and causal connections are not clear and most previous work was done in neurons and not in microglial cells. Here, we report that exogenous fibrillary, but not monomeric, alpha-synuclein (AS, also known as SNCA) induces autophagy in microglial cells. We extensively studied the dynamics of this response using both live-cell imaging and correlative light-electron microscopy (CLEM), and found that it correlates with lysosomal damage and is characterised by the recruitment of the selective autophagy-associated proteins TANK-binding kinase 1 (TBK1) and optineurin (OPTN) to ubiquitylated lysosomes. In addition, we observed that LC3 (MAP1LC3B) recruitment to damaged lysosomes was dependent on TBK1 activity. In these fibrillar AS-treated cells, autophagy inhibition impairs mitochondrial function and leads to microglial cell death. Our results suggest that microglial autophagy is induced in response to lysosomal damage caused by persistent accumulation of AS fibrils. Importantly, triggering of the autophagic response appears to be an attempt at lysosomal quality control and not for engulfment of fibrillar AS.This article has an associated First Person interview with the first author of the paper.
Keywords: Alpha-synuclein; Autophagy; Cell death; Lysosomes; Microglia.
© 2018. Published by The Company of Biologists Ltd.
Conflict of interest statement
Competing interestsThe authors declare no competing or financial interests.
Figures
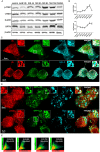
Fig. 1.
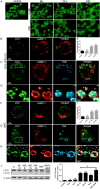
Alpha-synuclein induces autophagy in microglial cells. (A) BV2 microglial cells were left untreated or stimulated at different time points with AS monomers (mAS) or fibrils (fAS) at 1 μM. Cells were then fixed and stained for LC3. (B–H) BV2 GFP–LC3 cells (B,C) or primary microglial cells (F,G) were left untreated or stimulated with Alexa Fluor 647-labelled AS fibrils (1 µM). After 12 h cells were immunostained with anti-LAMP1 (red) antibody and primary microglial cells were also stained for LC3. Images shown are _z_-stack projections. (D,H) 3D surface-rendered magnifications of the selected area above. (E,I) Mean±s.e.m. LC3-positive vesicles in unstimulated or treated BV2 (E) and primary microglial cells (I) were determined using ImageJ particle counting plugin after cell deconvolution (_n_=20). (J) Cell lysates from BV2 cells cultured with AS fibrils or monomers (1 µM) were collected at different time points and LC3 and β-actin protein levels were examined using western immunoblotting. Bafilomycin A1 (BAF) was added for the last 3 h. Graph shows quantification of mean±s.e.m. LC3-II expression relative to β-actin using densitometry. Results from at least three independent experiments were analysed by one-way ANOVA followed by post-hoc Dunnet's test; _n_=3. **P<0.01; ***P<0.001; #P<0.01 when comparing AS at 12 h (AS12) with AS at 12 h in the presence of BAF (AS12+BAF); Nd, no significant difference. pMC, primary microglial cells.
Fig. 2.
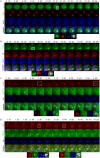
Evaluation of LC3 and ATG13 dynamics in AS-stimulated microglial cells using live-imaging. (A,B) BV2 cells stably expressing GFP–LC3 (green) were stimulated with fAS (red) for 12 h. Imaging was performed at 1 frame per 10 s for 1 h and a selected interval within this sequence for two experiments is shown. LysoTracker Blue was added 30 min previous to image acquisition. Note that autophagosomes form a ring-like structure around LysoTracker+/fAS+ structures. (C,D) BV2 cells stably expressing GFP–ATG13 (green) were transfected with CFP–LC3 (red) and stimulated with fAS (blue) and imaged as described above. Arrowhead indicates the first discernible ATG13 punctum during autophagosome formation (C) and ATG13 forming a puncta pattern similar to LC3 (D). Scale bars: 2 µm.
Fig. 3.
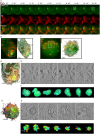
Correlative light-electron microscopy study of LC3-positive vesicles in fAS-stimulated microglial cells. BV2 GFP–LC3 (green) cells were stimulated with fAS (red) for 12 h and incubated in the absence (A–F) or the presence (G–J) of BAF for the last 3 h. Cells were then fixed using high-pressure freezing (HPF) and processed for optical and electron microscopy (EM) acquisition. 300 nm sections were imaged using fluorescence microscopy and EM tomograms were acquired at the regions of interest. (A) Wide-field and low- (200×) and high-magnification (20,000×) electron microscopy images with the overlay result. (B–J) High-magnification slides (20,000×) from tomograms of a selection of representative experiments indicating the CLEM result. Scale bars: 200 nm. Arrowheads indicate double-membrane vesicles.
Fig. 4.
Live-cell CLEM imaging of fAS-stimulated microglial cells . (A) BV2 GFP–LC3 cells (green) were stimulated with fAS (red) for 12 h. Imaging was performed at 1 frame per 20 s. After detecting the event of interest (white box), cells were immediately fixed and processed for EM tomography. Twenty serial tomograms were acquired on 300 nm sections. Scale bar: 5 µm. (B,D) Correlation result from the cell shown in A, indicating the area acquired at high magnification (9400×) in each tomogram. (E) Representative slides of the serial tomogram following identification of the event of interest in panel D are shown. Scale bar: 500 nm. Arrowhead indicates a central double-membrane autophagosome. (C,G) Correlation result of a second live-cell CLEM experiment indicating the area acquired at high-magnification (9400×) in each serial tomogram. BV2 GFP–LC3 cells were stimulated and imaged as described in A. (H) Representative slides of the serial tomogram following identification of the event of interest in panel G are shown. Scale bar: 500 nm. Arrowheads indicate a double-membrane autophagosome surrounded by ER membranes (white arrows). (F,I) 3D reconstructions of the vesicles shown in the serial tomogram slides in panels E and H, respectively.
Fig. 5.
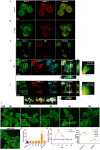
Evaluation of lysosomal damage in fAS-stimulated microglial cells. (A,B) BV2 cells were left untreated (A) or stimulated (B) with LLOME (500 µM) for 2 h. Next, cells were immunostained with anti-GAL-3 (green) and anti-LAMP-1 (red) antibodies. (C–E) BV2 (C) or primary (D,E) microglial cells were treated with fAS for 12 h. Cells were then fixed and stained for GAL-3 and LAMP-1 or LC3, as indicated. Merged images show orthogonal views and co-localisation analysis between the specified labels. Pearson coefficient (R) and overlap coefficient (R[r]) are listed. (F) BV2 microglial cells were stimulated with fibrillary (fAS) or monomeric (mAS) AS at the indicated time points. Scale bars: 5 µm. (G) Next, cells were immunostained for GAL-3 and puncta formation was determined using ImageJ particle counting plugin. (H,I) BV2 cells were stimulated with fAS (5 µM) at different time points or left untreated. Microglial cells were then stained with Magic Red dye for evaluation of cathepsin-B activity (H), MitoSpy Green FM for measuring mitochondrial mass or MitoSpy Orange CMTMRos for assessing mitochondrial membrane potential changes (I). Graphs show quantification of mean fluorescence intensity (Gmean) using flow cytometry. Results were analysed by one-way ANOVA followed by post-hoc Dunnet's test; _n_=3. Error bars represent s.e.m. (*P<0.05; ***P<0.001).
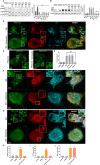
Fig. 6.
TBK1 and OPTN are recruited after fAS stimulation in microglial cells. (A) BV2 cells were stimulated with fibrillar (fAS) or monomeric (mAS) AS at different time points and cell lysates were collected for western blot analysis. Arrowhead indicates shifted (phosphorylated) OPTN band. (B) Mean±s.e.m. band quantification of phosphorylated (p)TBK1 relative to total TBK1 (upper graph) and OPTN relative to β-actin levels (lower graph). Results from at least three independent experiments were analysed by one-way ANOVA followed by post-hoc Dunnet's test; _n_=3. *P<0.05; **P<0.01; ***P<0.001. (C) Primary microglial cells treated with fAS for 12 h were fixed and stained for ubiquitin (red), pTBK1 or OPTN (green) and GAL-3 (cyan). (D) BV2 GFP–LC3 cells (green) treated with fAS (cyan) for 12 h were fixed and stained for pTBK1 or OPTN (red). Image crops shows magnification of the selected areas (white box). (E) Co-localisation analysis between the specified labels in panels C and D. Pearson coefficient (R) and overlap coefficient (R[r]) are listed.
Fig. 7.
Effects of TBK1 inhibition on LC3 and autophagy adaptors recruitment to damaged lysosomes after fAS stimulation. (A) BV2 cells were pre-treated with the TBK1 inhibitors BX795 (BX), Amlexanox (Am) and MRT67307 (mrt) for 1 h or left untreated. Next, microglial cells were stimulated with fAS for 12 h and cells lysates were examined using western immunoblotting. The bar graph shows mean±s.e.m. relative densitometry quantification of phosphorylated (p) and total TBK1 bands. (B) BV2 cells pre-treated with Amlexanox or BX795 for 1 h were stimulated with PP242 (PP2, 1 µM) and fAS (5 µM) for 3 h and 12 h, respectively. Cell lysates were collected and analysed using western immunoblotting. The bar graph shows mean±s.e.m. densitometry quantification of LC3-II relative to β-actin bands. (C–E) BV2 GFP–LC3 cells treated with Amlexanox or left untreated were stimulated with fAS (5 µM, 12 h) (C) or PP242 (1 µM, 3 h) (D). fAS-stimulated microglial cells in C were also stained for GAL-3 to reveal LC3/GAL-3 co-localisation. (E) Quantification of mean±s.e.m. LC3 puncta for the indicated conditions using ImageJ particle counting plugin. (F,G) BV2 GFP–LC3 cells treated and stimulated as described in C were fixed and stained for pTBK1 (F) or OPTN (red) (G) and GAL-3 (cyan). (H–J) Next, mean±s.e.m. pTBK1 (H), OPTN (I) and GAL-3 (J) puncta in F,G were quantified. Image crops show magnification of the selected areas (white box). Results from at least three independent experiments were analysed by one-way ANOVA followed by post-hoc Dunnet's test; _n_=3. ***P<0.001; ##P<0.01; ###P<0.001, fAS in comparison with fAS in the presence of TBK1 inhibitors as indicated; Nd, no significant difference.
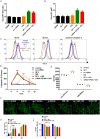
Fig. 8.
Effects of fAS stimulation on cathepsin-B activity, mitochondrial quality and microglial cell survival after autophagy inhibition. (A,B) BV2 (A) or primary (B) microglial cells were left untreated or treated with spautin-1 (10 µM) for 24 h or FIP200 siRNA for 48 h. Cells were then stimulated with fAS (5 μM) for 24 h and cell death was evaluated using propidium iodide (PI) combined with Annexin V–FITC staining and subsequent flow cytometric analysis. Mean±s.e.m. percentages of Annexin V–FITC/IP double-positive dead cells are shown. (C) BV2 microglial cells were treated and stimulated as described in A and BCL-2, BCL-xL and cleaved caspase-3 protein levels were evaluated using flow cytometry. Graphs show representative histograms for each protein. (D,E) BV2 microglial cells were left untreated or treated with spautin-1 (SP-1, 10 µM) for 24 h or FIP200 siRNA for 48 h and stimulated with fAS (5 μM) for 24 h. Untreated (control) and scramble (scr) siRNA as controls also shown. Cathepsin-B activity (D) and mitochondrial mass and membrane potential (E) were measured as described in Fig. 5H and I, respectively. (F–H) BV2 cells were treated with the autophagy inhibitors spautin-1 (SP-1, 10 µM) for 24 h or FIP200 siRNA for 48 h (si) and stimulated with fAS (5 μM) at the indicated time points. (F) GAL-3 immunostaining. (G,H) Mean±s.e.m. quantification of GAL-3 puncta (G) and LysoTracker Red DND-99 staining (H). LysoTracker staining was evaluated using flow cytometry and results are relative to the mean fluorescence intensity (Gmean) of the control condition. Results were analysed by one-way ANOVA followed by post-hoc Dunnet's test; _n_=3. *P<0.05, **P<0.01, ***P<0.001; #P<0.05, ##P<0.01 when comparing fAS with fAS plus SP-1 or FIP200 siRNA treatment.
Similar articles
- Emerging views of OPTN (optineurin) function in the autophagic process associated with disease.
Qiu Y, Wang J, Li H, Yang B, Wang J, He Q, Weng Q. Qiu Y, et al. Autophagy. 2022 Jan;18(1):73-85. doi: 10.1080/15548627.2021.1908722. Epub 2021 Apr 13. Autophagy. 2022. PMID: 33783320 Free PMC article. Review. - A Glaucoma-Associated Variant of Optineurin, M98K, Activates Tbk1 to Enhance Autophagosome Formation and Retinal Cell Death Dependent on Ser177 Phosphorylation of Optineurin.
Sirohi K, Kumari A, Radha V, Swarup G. Sirohi K, et al. PLoS One. 2015 Sep 16;10(9):e0138289. doi: 10.1371/journal.pone.0138289. eCollection 2015. PLoS One. 2015. PMID: 26376340 Free PMC article. - Dynamic recruitment and activation of ALS-associated TBK1 with its target optineurin are required for efficient mitophagy.
Moore AS, Holzbaur EL. Moore AS, et al. Proc Natl Acad Sci U S A. 2016 Jun 14;113(24):E3349-58. doi: 10.1073/pnas.1523810113. Epub 2016 May 31. Proc Natl Acad Sci U S A. 2016. PMID: 27247382 Free PMC article. - Identification of a splice variant of optineurin which is defective in autophagy and phosphorylation.
Moharir SC, Bansal M, Ramachandran G, Ramaswamy R, Rawat S, Raychaudhuri S, Swarup G. Moharir SC, et al. Biochim Biophys Acta Mol Cell Res. 2018 Nov;1865(11 Pt A):1526-1538. doi: 10.1016/j.bbamcr.2018.08.009. Epub 2018 Aug 16. Biochim Biophys Acta Mol Cell Res. 2018. PMID: 30327196 - Defects in autophagy caused by glaucoma-associated mutations in optineurin.
Sirohi K, Swarup G. Sirohi K, et al. Exp Eye Res. 2016 Mar;144:54-63. doi: 10.1016/j.exer.2015.08.020. Epub 2015 Aug 21. Exp Eye Res. 2016. PMID: 26302410 Review.
Cited by
- The Route from the Folded to the Amyloid State: Exploring the Potential Energy Surface of a Drug-Like Miniprotein.
Taricska N, Horváth D, Menyhárd DK, Ákontz-Kiss H, Noji M, So M, Goto Y, Fujiwara T, Perczel A. Taricska N, et al. Chemistry. 2020 Feb 11;26(9):1968-1978. doi: 10.1002/chem.201903826. Epub 2019 Dec 27. Chemistry. 2020. PMID: 31647140 Free PMC article. - Built to last: lysosome remodeling and repair in health and disease.
Zoncu R, Perera RM. Zoncu R, et al. Trends Cell Biol. 2022 Jul;32(7):597-610. doi: 10.1016/j.tcb.2021.12.009. Epub 2022 Feb 2. Trends Cell Biol. 2022. PMID: 35123838 Free PMC article. Review. - Methods to detect mitophagy in neurons during disease.
Carter FE, Moore ME, Pickrell AM. Carter FE, et al. J Neurosci Methods. 2019 Sep 1;325:108351. doi: 10.1016/j.jneumeth.2019.108351. Epub 2019 Jul 9. J Neurosci Methods. 2019. PMID: 31299189 Free PMC article. Review. - Emerging views of OPTN (optineurin) function in the autophagic process associated with disease.
Qiu Y, Wang J, Li H, Yang B, Wang J, He Q, Weng Q. Qiu Y, et al. Autophagy. 2022 Jan;18(1):73-85. doi: 10.1080/15548627.2021.1908722. Epub 2021 Apr 13. Autophagy. 2022. PMID: 33783320 Free PMC article. Review. - Lysosomal Dysfunction at the Centre of Parkinson's Disease and Frontotemporal Dementia/Amyotrophic Lateral Sclerosis.
Wallings RL, Humble SW, Ward ME, Wade-Martins R. Wallings RL, et al. Trends Neurosci. 2019 Dec;42(12):899-912. doi: 10.1016/j.tins.2019.10.002. Epub 2019 Nov 5. Trends Neurosci. 2019. PMID: 31704179 Free PMC article. Review.
References
- Aits S., Kricker J., Liu B., Ellegaard A.-M., Hämälistö S., Tvingsholm S., Corcelle-Termeau E., Høgh S., Farkas T., Holm Jonassen A. et al. (2015). Sensitive detection of lysosomal membrane permeabilization by lysosomal galectin puncta assay. Autophagy 11, 1408-1424. 10.1080/15548627.2015.1063871 - DOI - PMC - PubMed
- Axe E. L., Walker S. A., Manifava M., Chandra P., Roderick H. L., Habermann A., Griffiths G. and Ktistakis N. T. (2008). Autophagosome formation from membrane compartments enriched in phosphatidylinositol 3-phosphate and dynamically connected to the endoplasmic reticulum. J. Cell Biol. 182, 685-701. 10.1083/jcb.200803137 - DOI - PMC - PubMed
Publication types
MeSH terms
Substances
Grants and funding
- 16337/CRUK_/Cancer Research UK/United Kingdom
- BBS/E/B/000C0413/BB_/Biotechnology and Biological Sciences Research Council/United Kingdom
- BBS/E/B/000C0417/BB_/Biotechnology and Biological Sciences Research Council/United Kingdom
LinkOut - more resources
Full Text Sources
Molecular Biology Databases
Research Materials
Miscellaneous
