Predicting protein-protein interactions through sequence-based deep learning - PubMed (original) (raw)
Predicting protein-protein interactions through sequence-based deep learning
Somaye Hashemifar et al. Bioinformatics. 2018.
Abstract
Motivation: High-throughput experimental techniques have produced a large amount of protein-protein interaction (PPI) data, but their coverage is still low and the PPI data is also very noisy. Computational prediction of PPIs can be used to discover new PPIs and identify errors in the experimental PPI data.
Results: We present a novel deep learning framework, DPPI, to model and predict PPIs from sequence information alone. Our model efficiently applies a deep, Siamese-like convolutional neural network combined with random projection and data augmentation to predict PPIs, leveraging existing high-quality experimental PPI data and evolutionary information of a protein pair under prediction. Our experimental results show that DPPI outperforms the state-of-the-art methods on several benchmarks in terms of area under precision-recall curve (auPR), and computationally is more efficient. We also show that DPPI is able to predict homodimeric interactions where other methods fail to work accurately, and the effectiveness of DPPI in specific applications such as predicting cytokine-receptor binding affinities.
Availability and implementation: Predicting protein-protein interactions through sequence-based deep learning): https://github.com/hashemifar/DPPI/.
Supplementary information: Supplementary data are available at Bioinformatics online.
Figures
Fig. 1.
Illustration of the DPPI model for predicting binary protein–protein interactions. (a) DPPI takes as input a pair of protein sequences and learns to predict an interaction score. (b) Each input protein is represented as a probabilistic sequence profile generated by PASI-BLAST. (c) The convolutional module consists of several convolutional layers that learn a set of filters, each of which is responsible for detecting various patterns in a sequence. (d) The random projection module maps each sequence to a representation useful for modelling paired sequences
Fig. 2.
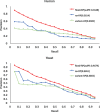
DPPI accurately and efficiently predicts protein–protein interactions. (a) Performance comparison of DPPI with competing sequence-based methods on human and yeast benchmark data. Values were adopted from Hamp and Rost (2015) and show the average precision and recall rate of 10-fold cross-validation. The numbers in parenthesis indicate the area under precision-recall curve (auPR). (b) The mean auPR of DPPI and Profppikernel with respect to different training sizes. We discontinued training Profppikernel with 10k examples after 17 days before it finished. The trend line using the first 3 training sizes is plotted for each method and extended over the last 3 sizes with the 95% interval illustrated. (c) The wall time for training DPPI and Profppikernel. We trained Profppikernel using 96 threads by running it on 32 AMD Opteron(TM) Processor 6272 CPUs
Fig. 3.
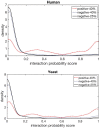
DPPI performance on test sets generated by more stringent criteria. Probability values of negative interactions on both the new test sets and original test sets is consistent with each other. Black and blue lines show the density of negative interactions for new (25% sequence identity) and original (40% sequence identity) test sets respectively. Red line shows the density of positive interactions for original test set. The top and bottom pictures are for human and yeast, respectively
Fig. 4.
Performance comparison of DPPI model (i.e. model with fixed-weight RP) with two alternative architectures—one without RP module (no-RP model) and the other with a variant RP module
Fig. 5.
Performance of DPPI software regarding 25% sequence similarity
Fig. 6.
Scatter plot between the ranking percentile calculated from DPPI’s prediction scores versus log dissociation constant (Kd) of IL-2 and IL-13 engineered variants. Trend line emphasizing linear correlation is depicted. IL-2: Pearson correlation = 0.98, _P_-value < 0.018. IL-13: Pearson correlation = 0.69, _P_-value < 0.001
Similar articles
- Anti-symmetric framework for balanced learning of protein-protein interactions.
Tang T, Li T, Li W, Cao X, Liu Y, Zeng X. Tang T, et al. Bioinformatics. 2024 Oct 1;40(10):btae603. doi: 10.1093/bioinformatics/btae603. Bioinformatics. 2024. PMID: 39404784 Free PMC article. - DDMut-PPI: predicting effects of mutations on protein-protein interactions using graph-based deep learning.
Zhou Y, Myung Y, Rodrigues CHM, Ascher DB. Zhou Y, et al. Nucleic Acids Res. 2024 Jul 5;52(W1):W207-W214. doi: 10.1093/nar/gkae412. Nucleic Acids Res. 2024. PMID: 38783112 Free PMC article. - Hierarchical graph learning for protein-protein interaction.
Gao Z, Jiang C, Zhang J, Jiang X, Li L, Zhao P, Yang H, Huang Y, Li J. Gao Z, et al. Nat Commun. 2023 Feb 25;14(1):1093. doi: 10.1038/s41467-023-36736-1. Nat Commun. 2023. PMID: 36841846 Free PMC article. - Revolutionizing protein-protein interaction prediction with deep learning.
Zhang J, Durham J, Qian Cong. Zhang J, et al. Curr Opin Struct Biol. 2024 Apr;85:102775. doi: 10.1016/j.sbi.2024.102775. Epub 2024 Feb 7. Curr Opin Struct Biol. 2024. PMID: 38330793 Review. - Machine learning on protein-protein interaction prediction: models, challenges and trends.
Tang T, Zhang X, Liu Y, Peng H, Zheng B, Yin Y, Zeng X. Tang T, et al. Brief Bioinform. 2023 Mar 19;24(2):bbad076. doi: 10.1093/bib/bbad076. Brief Bioinform. 2023. PMID: 36880207 Review.
Cited by
- Struct2Graph: a graph attention network for structure based predictions of protein-protein interactions.
Baranwal M, Magner A, Saldinger J, Turali-Emre ES, Elvati P, Kozarekar S, VanEpps JS, Kotov NA, Violi A, Hero AO. Baranwal M, et al. BMC Bioinformatics. 2022 Sep 10;23(1):370. doi: 10.1186/s12859-022-04910-9. BMC Bioinformatics. 2022. PMID: 36088285 Free PMC article. - Improved prediction of protein-protein interactions using AlphaFold2.
Bryant P, Pozzati G, Elofsson A. Bryant P, et al. Nat Commun. 2022 Mar 10;13(1):1265. doi: 10.1038/s41467-022-28865-w. Nat Commun. 2022. PMID: 35273146 Free PMC article. - ProteinPrompt: a webserver for predicting protein-protein interactions.
Canzler S, Fischer M, Ulbricht D, Ristic N, Hildebrand PW, Staritzbichler R. Canzler S, et al. Bioinform Adv. 2022 Aug 17;2(1):vbac059. doi: 10.1093/bioadv/vbac059. eCollection 2022. Bioinform Adv. 2022. PMID: 36699419 Free PMC article. - Assessment of community efforts to advance network-based prediction of protein-protein interactions.
Wang XW, Madeddu L, Spirohn K, Martini L, Fazzone A, Becchetti L, Wytock TP, Kovács IA, Balogh OM, Benczik B, Pétervári M, Ágg B, Ferdinandy P, Vulliard L, Menche J, Colonnese S, Petti M, Scarano G, Cuomo F, Hao T, Laval F, Willems L, Twizere JC, Vidal M, Calderwood MA, Petrillo E, Barabási AL, Silverman EK, Loscalzo J, Velardi P, Liu YY. Wang XW, et al. Nat Commun. 2023 Mar 22;14(1):1582. doi: 10.1038/s41467-023-37079-7. Nat Commun. 2023. PMID: 36949045 Free PMC article. - A Novel Ensemble Learning-Based Computational Method to Predict Protein-Protein Interactions from Protein Primary Sequences.
Pan J, Wang S, Yu C, Li L, You Z, Sun Y. Pan J, et al. Biology (Basel). 2022 May 19;11(5):775. doi: 10.3390/biology11050775. Biology (Basel). 2022. PMID: 35625503 Free PMC article.
References
- Ben-Hur A., Noble W.S. (2005) Kernel methods for predicting protein–protein interactions. Bioinformatics ,21, i38–i46. - PubMed
- Bengio Y. (2012) Neural Networks: Tricks of the Trade. Springer-Verlag, Berlin, Heidelberg, pp. 437–478.
- Bromley J., et al. (1993) Signature Verification Using A “Siamese” Time Delay Neural network. IJPRAI, 07, 669–688.
- Cooijmans T., et al. (2016) Recurrent batch normalization. arXiv Preprint arXiv: 1603.09025.
Publication types
MeSH terms
Substances
LinkOut - more resources
Full Text Sources
Other Literature Sources


