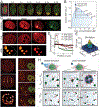
Mapping Local and Global Liquid Phase Behavior in Living Cells Using Photo-Oligomerizable Seeds - PubMed (original) (raw)
Mapping Local and Global Liquid Phase Behavior in Living Cells Using Photo-Oligomerizable Seeds
Dan Bracha et al. Cell. 2018.
Erratum in
- Mapping Local and Global Liquid Phase Behavior in Living Cells Using Photo-Oligomerizable Seeds.
Bracha D, Walls MT, Wei MT, Zhu L, Kurian M, Avalos JL, Toettcher JE, Brangwynne CP. Bracha D, et al. Cell. 2019 Jan 10;176(1-2):407. doi: 10.1016/j.cell.2018.12.026. Cell. 2019. PMID: 30633909 No abstract available.
Abstract
Liquid-liquid phase separation plays a key role in the assembly of diverse intracellular structures. However, the biophysical principles by which phase separation can be precisely localized within subregions of the cell are still largely unclear, particularly for low-abundance proteins. Here, we introduce an oligomerizing biomimetic system, "Corelets," and utilize its rapid and quantitative light-controlled tunability to map full intracellular phase diagrams, which dictate the concentrations at which phase separation occurs and the transition mechanism, in a protein sequence dependent manner. Surprisingly, both experiments and simulations show that while intracellular concentrations may be insufficient for global phase separation, sequestering protein ligands to slowly diffusing nucleation centers can move the cell into a different region of the phase diagram, resulting in localized phase separation. This diffusive capture mechanism liberates the cell from the constraints of global protein abundance and is likely exploited to pattern condensates associated with diverse biological processes. VIDEO ABSTRACT.
Keywords: binodal; condensation; liquid-liquid phase separation; membraneless organelles; multivalent interactions; oligomerization; optogenetics; phase diagram; protein disorder; spinodal decomposition.
Copyright © 2018 Elsevier Inc. All rights reserved.
Conflict of interest statement
Declaration of Interests
The authors declare no competing interests.
Figures
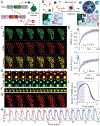
Figure 1.. Corelets enable light-activated liquid droplet condensation.
(A) Schematic diagram of the Corelet system. Corelets consists of two modules: first, a nuclear targeted, GFP-tagged ferritin core functionalized by 24 photo-activatable iLID domains; and second, iLID’s cognate partner, SspB, mCherry-tagged and conjugated to a self-interacting protein domain, such as the N-terminal IDR of FUS. Dashed line designate photo-inducible heterodimerizing units. (B) Schematic of Corelet phase separation. Upon blue-light illumination, up to 24 IDR domains are captured by the Cores, which may subsequently phase separate in a reversible manner. (C) Time lapse confocal imaging of photo-activated FUSN Corelet-expressing HEK293 cells. Images show phase separation with colocalization of Cores (green) and FUSN IDRs (red). See also Figure S1 and S2 and Video S1. (D) FUSN Corelet condensates exhibit liquid-like properties as inferred by rapid fluorescence recovery after photo-bleaching of both FUSN IDR (top) and Core components (bottom), shown as heat colormaps of the florescence. FRAP ROI labelled with dashed circles. (E) Quantified FRAP curves from (D). Mean and standard deviation of fluorescence in quantified ROI are shown scaled by the pre-photobleached intensity. Red curves are exponential fits used to determine time constant of recovery, τ, as given in each panel. (F) Corelet condensates rapidly fuse and coarsen (4.4 s between frames). (G) Condensates completely disassemble within ~0.5–2 minutes after blue-light removal. (H) Change in standard deviation of nuclear IDR fluorescence indicates full reversibility during 15 on-and off cycles. See also Figure S3. (I) Overlay of data from G, showing little change in condensation and dissociation dynamics over multiple cycles (see also Figure S3D, STAR Methods). The curves corresponding to each cycle are colored to match (H). Scale bars are 5 μm for C and G and 2 μm for F.
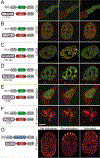
Figure 2.. Corelets drive phase separation with various IDRs and in various living systems.
(A-E) Fluorescence images of representative stable Corelet-expressing mammalian cultured cells utilizing various IDR/IDPs with nuclear or cytoplasmic Cores, resulting in light-sensitive, reversible condensates in all cases. Schematic of utilized constructs shown in the left panel corresponding to adjacent images. (A) Cytoplasmic FUSN IDR Corelets (no NLS). (B) Full-length FUS Corelets. (C) HNRNPA1C Corelets. (D) TDP-43C Corelets. (E) DDX4N Corelets. (A-D) are U2OS cells, E is HEK293. Images are taken before and after 2–10 minutes activation as indicated in each panel and 5 minutes after deactivation. All images show overlay of GFP Cores and mCherry IDR/IDP. (F) S. cerevisiae expressing cytoplasmic FUSN Corelets. Images as in (A-G), except GFP overlay is not shown for deactivation. (G) Local and global activation of cytoplasmic PGL-1 IDP Corelets in C. elegans one-cell embryo during the first cleavage. Images shown as heat colormap of mCherry signal. With no light activation, PGL-1-SspB components are recruited to native P granules, which are initially distributed uniformly throughout the embryo (t=0), and then segregate to the embryo posterior (P) (t=20min). Instead, under global activation, PGL-1 Corelet puncta appear throughout the embryo. Scale bars are 5 μm.
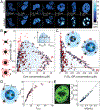
Figure 3.. Mapping global FUSN Corelet phase diagrams.
(A) Confocal images of Cores in FUSN Corelets expressing HEK293 cells with increasing average nuclear IDR-to-core ratio, f¯, prior to activation (top) and after 10 minute blue-light activation (bottom). Phase separation requires high enough Core concentration, and valency f¯. Uniform fluorescence levels are observed throughout the dilute phase and within the various dense phases (see also Figure S4B–E). Color bar represents FCS-based fluorescence-to-concentration conversion (see Figure S4H, STAR Methods). (B) Phase diagram of FUSN Corelets, with respect to Core concentration and Core-to-IDR ratio,_f_−1. Solid red circles indicate average nuclear concentrations for which phase separation is observed, while empty circles are concentrations where no phase separation is observed. Blue triangles and diamonds indicate concentrations of dilute phase and dense phase, respectively. Shaded two-phase region is bounded by approximated binodal curves drawn to align with measured dilute and dense phases and circumscribe phase separating average nuclear concentrations. Dashed horizontal line corresponds to fully-coated Corelets with 24 IDRs per Core. Vertical axis on a log2 base. Inset shows definition of lever rule parameters for measurement in (E). Note that a and b are defined with respect the location of the measured dilute and dense phase points per cell, not the drawn binodal curve. (C) Phase diagram of FUSN Corelets, with respect to IDR concentration. Y-axis and symbol definitions as in (B). Inset, schematic picture for species in the phase separated droplets for f < 24 (I) and _f_ > 24 (II, saturated), showing recruitment of unbound IDRs into condensates of saturated Cores, which leads to an increase in IDR concentration in the dense phase but a decrease in Core concentration as a result of increased Core-to-Core spacing. These regions are similarly labelled with respect to dashed line in (B) and (C). (D) Despite major concentration differences, IDR-to-Core concentration ratios in dilute, f Dilute, and dense, f Dense, phases are similar (compared to gray line of slope 1) as long as cores are not saturated (dashed line). (E) Volume fractions predicted by lever-rule are consistent with volume fraction segmentation of dense (VDense, bright green) and dilute phases (VNu-VNo-VDense, dark green), where VNu, VNo, and VDense represent the relative confocal volume of the nucleus (within full line), nucleoli (within dashed line), and dense phase (bright green), respectively. a and b are defined in inset of (B). Equality shown via comparison to gray line of slope 1. Scale bars are 5 μm. Error bars, standard deviation of measurement within segmented pixels for dense phase (see Figure S4I for error bars for dilute phases and pre-activated cells).
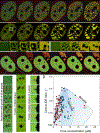
Figure 4.. Distinct modes of FUSN Corelet phase separation.
(A) Phase separation via nucleation and growth occurs at low Core concentration. See Video S2 . (B) At intermediate Core concentration phase separation initiates with the rapid formation of elongated interconnected domains, as in spinodal decomposition. Insets show repeated activation of the same cellular region at higher time resolution, showing differing morphology evolution. See Video S3. (C) At very high Core concentration nucleation and growth of dilute phases within a dense phase was observed. Insets show enlarged nucleation (left) and subsequent fusion of dilute phases (center), as well as dilute phase fusion with a nucleolus (right). See Video S4. (D) Positioning phase separating cells according to their valence and core concentration at the time of activation and labeling them accordingly to the observed condensation mode delineate the binodal and minimal spinodal regions of the phase diagram. Red circles indicate average nuclear concentrations for which phase separation follows nucleation and growth of dense phases (left) or dilute phases (right), and blue circles are concentrations where spinodal decomposition is observed. Unlike the diagram in Figure 2D, points represent mean nuclear fluorescence upon activation, 2 sec after light activation. Purple symbols represent cells in which the exact condensation mode could not be conclusively determined (see Figure S5B). Binodal curves from Figure 2B. Approximate spinodal curve (dashed line) drawn to encapsulate average nuclear concentrations showing spinodal decomposition morphologies. Cells depicted in (A-C) are indicated. Scale bars are 2 μm for enlarged insets and 5 μm elsewhere.
Figure 5.. Phase diagrams show strong dependence on chemical attributes of protein sequence.
(A) Phase diagram of FUSN-5Y Corelets, with respect to Core concentration and Core-to-IDR ratio, _f_−1. Symbols as in Fig. 3B. Full valency line shown as dashed horizontal and FUSN-WT Corelets binodal line from Figure 3B is shown in gray for comparison. Inset schematic shows mutations removing a subset of FUSN tyrosine residues (Y->S) (B) Phase diagram of phosphomimic FUSN+6E Corelets. Inset shows schematic of how S/T mutations to glutamic acid (E) introduce negative charge, as would phosphorylation of these sites. Axes, lines and symbol definitions as in (A).
Figure 6.. Concentration amplification of IDRs occurs through diffusive capture by slowly diffusing cores.
(A) Example image showing how activating a fraction of the cell nucleus leads to non-uniform droplet size-distribution. (B) Time-lapse imaging of U2OS cell nuclei partially activated by low (14 μW/ μm2, top panel) or high (84 μW/μm2, bottom panel) activation power. Low power yields uniform nucleation within activated zone, while high power yields preferential nucleation at the boundary between activated and non-activated zones for both HNRNPA1N and (C) FUSN based Corelets in cell with f¯ and [Core]=4.1 μM. For (B) and (C), red panels are IDR channel, and green panels are Core channel, which was imaged in the last frame. (D) Time-dependent FUSN concentration profiles across cell nucleus from (C) with the onset of high power half-cell photo-activation. FUSN molecules progressively accumulate at the activated zone boundary, and are depleted within the non-activated zone. (E) Simulation demonstrating that diffusive capture of IDR particles by multivalent cores is sufficient for local enrichment at the activation interface, but only if the Cores diffuse more slowly than IDRs. See video S5. Inset showing snapshot of a simulation with D IDR/D core ≅ 10. IDR particles, red; Multivalent core, green. (F) FCS normalized autocorrelation plots measured for core (blue) and IDR (FUSN, red) components in the nucleoplasm. Bars are 5 μm.
Figure 7.. Amplified phase separation by local diffusive capture.
(A) Performing multiple onoff cycles on subfractions of a near-critical U2OS cell expressing FUSN Corelets gives rise to a gradually enhanced phase separation with increasingly concentrated condensates as size of activated nuclear region decreases. See Video S6. (B) The smaller the activated zone, the deeper the cell locally plunges into the two-phase region, as compared to the average nuclear concentration (red circle). When mapped according to local valency and core concentration (diamonds), resulting condensates follow the binodal phase boundary shown in Figure 3B. Triangles correspond to non-activated regions of the nucleus. (C) Photo-activating a 0.5 μm spot (arrow) in globally non-activatable cells, expressing either HNRNPA1N Corelets (Top), FUSN Corelets (Middle), or NPM1 Corelets (Bottom). In each case, local activation drives local phase separation. Top and Middle, U2OS cell, and Bottom, HeLa cell. (D) Concentration profiles across HNRNPA1N Corelets expressed in U2OS cell (as marked in GFP channel of C) before and immediately after 2 min of local activation, showing local enhancement in f¯, and depletion in the non-activated zone (values of f¯ labelled for measurements after activation). (E) Simulations of locally activated spot of IDR-binding Core particles with D IDR/D core ≅ 10 shows strong IDR enrichment, as observed in experiment. (F) Patterned activation examples with FUSN Corelets in NIH 3T3 cells. See video S7. (G) Global activation causes droplets to condense in both cell nuclei (second panel). However, after local activation of two spots within the bottom cell (third panel), global activation of the entire cell does not initiate new nucleation events in that cell (fourth panel). (H) Schematic illustration of physical model of how local activation can drive a diffusive flux of IDR towards slowly diffusing cores scaffolds at the activation zone (dashed blue line), causing high local valency, f loc, that exceeds the saturation threshold, f sat, for phase separation, and locally entering into the binodal phase space. In the case where Core and IDR diffusivities are similar however, partially coated cores diffuse away from the activated region at the same rate as unbound IDRs and uncoated cores diffuse in, preventing f loc from surpassing f sat, yielding no phase separation. Bars are 5 μm.
Comment in
- Mechanobiology of Protein Droplets: Force Arises from Disorder.
Welsh TJ, Shen Y, Levin A, Knowles TPJ. Welsh TJ, et al. Cell. 2018 Nov 29;175(6):1457-1459. doi: 10.1016/j.cell.2018.11.020. Cell. 2018. PMID: 30500530
Similar articles
- Liquid Nuclear Condensates Mechanically Sense and Restructure the Genome.
Shin Y, Chang YC, Lee DSW, Berry J, Sanders DW, Ronceray P, Wingreen NS, Haataja M, Brangwynne CP. Shin Y, et al. Cell. 2018 Nov 29;175(6):1481-1491.e13. doi: 10.1016/j.cell.2018.10.057. Cell. 2018. PMID: 30500535 Free PMC article. - An Optogenetic Toolkit for the Control of Phase Separation in Living Cells.
Kim C, Shin Y. Kim C, et al. Methods Mol Biol. 2023;2563:383-394. doi: 10.1007/978-1-0716-2663-4_19. Methods Mol Biol. 2023. PMID: 36227484 - Assessing the Phase Separation Propensity of Proteins in Living Cells Through Optodroplet Formation.
Rademacher A, Erdel F, Weinmann R, Rippe K. Rademacher A, et al. Methods Mol Biol. 2023;2563:395-411. doi: 10.1007/978-1-0716-2663-4_20. Methods Mol Biol. 2023. PMID: 36227485 - Cellular sensing by phase separation: Using the process, not just the products.
Yoo H, Triandafillou C, Drummond DA. Yoo H, et al. J Biol Chem. 2019 May 3;294(18):7151-7159. doi: 10.1074/jbc.TM118.001191. Epub 2019 Mar 15. J Biol Chem. 2019. PMID: 30877200 Free PMC article. Review. - Role of Liquid-Liquid Phase Separation in Assembly of Elastin and Other Extracellular Matrix Proteins.
Muiznieks LD, Sharpe S, Pomès R, Keeley FW. Muiznieks LD, et al. J Mol Biol. 2018 Nov 2;430(23):4741-4753. doi: 10.1016/j.jmb.2018.06.010. Epub 2018 Jun 8. J Mol Biol. 2018. PMID: 29886015 Review.
Cited by
- Optogenetic Tools for Manipulating Protein Subcellular Localization and Intracellular Signaling at Organelle Contact Sites.
Benedetti L. Benedetti L. Curr Protoc. 2021 Mar;1(3):e71. doi: 10.1002/cpz1.71. Curr Protoc. 2021. PMID: 33657274 Free PMC article. - Molecular mechanisms of stress granule assembly and disassembly.
Hofmann S, Kedersha N, Anderson P, Ivanov P. Hofmann S, et al. Biochim Biophys Acta Mol Cell Res. 2021 Jan;1868(1):118876. doi: 10.1016/j.bbamcr.2020.118876. Epub 2020 Sep 29. Biochim Biophys Acta Mol Cell Res. 2021. PMID: 33007331 Free PMC article. Review. - Rapid and reversible dissolution of biomolecular condensates using light-controlled recruitment of a solubility tag.
Brumbaugh-Reed EH, Aoki K, Toettcher JE. Brumbaugh-Reed EH, et al. bioRxiv [Preprint]. 2024 Jan 17:2024.01.16.575860. doi: 10.1101/2024.01.16.575860. bioRxiv. 2024. PMID: 38293146 Free PMC article. Updated. Preprint. - LASSI: A lattice model for simulating phase transitions of multivalent proteins.
Choi JM, Dar F, Pappu RV. Choi JM, et al. PLoS Comput Biol. 2019 Oct 21;15(10):e1007028. doi: 10.1371/journal.pcbi.1007028. eCollection 2019 Oct. PLoS Comput Biol. 2019. PMID: 31634364 Free PMC article. - RNA at the surface of phase-separated condensates impacts their size and number.
Cochard A, Garcia-Jove Navarro M, Piroska L, Kashida S, Kress M, Weil D, Gueroui Z. Cochard A, et al. Biophys J. 2022 May 3;121(9):1675-1690. doi: 10.1016/j.bpj.2022.03.032. Epub 2022 Mar 29. Biophys J. 2022. PMID: 35364105 Free PMC article.
References
- Aoki ST, Crittenden SL, Lynch TR, Bingman CA, Wickens M, and Kimble J (2018). Nematode germ granule assembly is linked to mRNA repression. BioRxiv.
- Asherie N (2004). Protein crystallization and phase diagrams. Methods 34, 266–272. - PubMed
- Bellapadrona G, and Elbaum M (2014). Supramolecular protein assemblies in the nucleus of human cells. Angew. Chemie - Int. Ed 53, 1534–1537. - PubMed
Publication types
MeSH terms
LinkOut - more resources
Full Text Sources
Other Literature Sources
Research Materials
