Low-Fidelity Assembly of Influenza A Virus Promotes Escape from Host Cells - PubMed (original) (raw)
Low-Fidelity Assembly of Influenza A Virus Promotes Escape from Host Cells
Michael D Vahey et al. Cell. 2019.
Erratum in
- Low-Fidelity Assembly of Influenza A Virus Promotes Escape from Host Cells.
Vahey MD, Fletcher DA. Vahey MD, et al. Cell. 2019 Jan 24;176(3):678. doi: 10.1016/j.cell.2019.01.009. Cell. 2019. PMID: 30682375 Free PMC article. No abstract available. - Low-Fidelity Assembly of Influenza A Virus Promotes Escape from Host Cells.
Vahey MD, Fletcher DA. Vahey MD, et al. Cell. 2020 Jan 9;180(1):205. doi: 10.1016/j.cell.2019.12.028. Cell. 2020. PMID: 31923395 Free PMC article. No abstract available.
Abstract
Influenza viruses inhabit a wide range of host environments using a limited repertoire of protein components. Unlike viruses with stereotyped shapes, influenza produces virions with significant morphological variability even within clonal populations. Whether this tendency to form pleiomorphic virions is coupled to compositional heterogeneity and whether it affects replicative fitness remains unclear. Here, we address these questions by developing a strain of influenza A virus amenable to rapid compositional characterization through quantitative, site-specific labeling of viral proteins. Using this strain, we find that influenza A produces virions with broad variations in size and composition from even single infected cells. This phenotypic variability contributes to virus survival during environmental challenges, including exposure to antivirals. Complementing genetic adaptations that act over larger populations and longer times, this "low-fidelity" assembly of influenza A virus allows small populations to survive environments that fluctuate over individual replication cycles.
Copyright © 2018 Elsevier Inc. All rights reserved.
Conflict of interest statement
Declaration of Interests
The authors declare no competing interests.
Figures
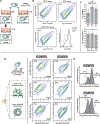
Figure 1:. Multi-spectral strains of influenza A virus permit fluorescence-based quantification of virus composition and morphology.
(A) Schematic of the virus labeling strategy. Inserting small (~5–10aa) tags into the structural proteins of influenza A virus renders the virus amenable to labeling via the site-specific attachment of fluorophores. (B) Work flow for collecting and labeling IAV proteins on intact and infectious virions. (C) Viruses labeled and immobilized on a coverslip exhibit diverse morphology and composition. (D) Length distribution of virions containing M1 from A/Udorn/1972 showing significant size variation. Viruses >1µm in length comprise a minority of ~10% of the population, but represent ~34% of the viral material shed during infection (estimated as the product of measured particle size and frequency within the population). Plot shows mean and standard deviation from six biological replicates with N > 44000 viruses in each. (E) Viruses with up to four orthogonal tags show replication kinetics similar to (HA/NP/M2/NA + M1Ud) or modestly slower than (HA/M1/M2) the parental strain in MDCK cells (error bars represent S.D.). (F) Labeling HA and NA on the surface of the virus preserves ~85% infectivity relative to unlabeled tagged strains, while labeling HA, NA, and NP preserves ~75% infectivity. Quantification shows the mean +/− S.D. of labeled virus titers relative to unlabeled samples for three biological replicates. See also Figures S1–S4 and Supplemental Data 1.
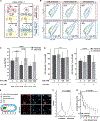
Figure 2.. Influenza A virus composition and morphology vary broadly at the single-virion level.
(A) Distributions of HA, NA, and M2 labeled via SFP synthase (NA and M2) and SrtA (HA). The relative means of abundance are in general agreement with prior measurements, but individual viruses vary considerably. (B) This variation diminishes by ~30% when M1WSN is used to produce viruses of more homogeneous size. (C) Similar distributions as in (A), but with NP and M1, quantified after labeling with FlAsH-EDT2. (D) Segmenting images of immobilized viruses and integrating the intensities of labeled HA and NA allows us to measure distributions of these proteins across a virus population, represented as a two-dimensional histogram showing the log-abundance of HA (horizontal axis) and NA (vertical axis) measured for 187309 viruses compiled from three independent experiments. Data from individual replicates is plotted in Figure S5B and tabulated in Supplemental Data 2. Contrast in the image to the left is enhanced to increase visibility of viruses over a wide range of intensities. (E) Smaller viruses (<~300nm) exhibit more variability in HA:NA ratio, which is bimodally distribution in viruses shorter than ~300nm in length (population labeled i) but has an increasingly narrow distribution as virus size increases (populations from ii and iii). (F) Distribution of infectious potential across the particle population. “NP+”: particles that label positive for NP; “semi-infectious”: particles that deliver at least one vRNA segment to an infected cell; “PFU”: particles capable of initiating multiple rounds of replication. Data is normalized within each condition either to the total particle count (grey bars) or to the number of NP+ particles (percentages above bars); all values are mean +/− S.D. Un-normalized data for the three individual replicates is given in Table S1.
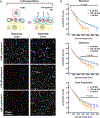
Figure 3.. Phenotypic variability is encoded in the influenza A virus assembly process.
(A) Characterizing virus shed from individual infected cells by positioning the apical surface of an epithelial monolayer tens of microns from a functionalized coverslip and infecting at low (~0.01) MOI. (B) Measurements of virus density as a function of radial distance from the center of virus clusters. Clusters captured at low MOI decay to ~10% of their maximum value at a radial distance of ~50µm. Uniform densities of virus are collected when the same experiment is performed at high MOI. (C) Distributions of HA-NA content in virus shed from 12 separate cells (solid contours; average of 723 viruses per cluster) across two biological replicates, overlaid with the population-wide distribution (dashed contours). See also Supplemental Data 2. (D) Overlaid length distributions from the same 12 single-cell virus populations whose composition is plotted in C (gray lines), with the population-wide distribution plotted in black.
Figure 4.. Compositional variability in individual viruses responds reversibly to changes in growth conditions.
(A) Compositional variability in viruses raised under different environmental conditions was investigated by infecting cells at 37°C for one hour and allowing infection to proceed at either 33°C or 37°C. Viruses grown at 33°C for one generation are then returned to 37°C to evaluate reversibility of observed viral phenotypes. (B) Virus phenotype is malleable to environmental conditions, shifting to higher NA when the temperature is decreased from 37°C to 33°C. These shifts are reversible from one generation to the next, suggesting that they originate from phenotypic variability rather than changes in genotype. Plots show combined data from three biological replicates, with N > 30000 viruses per condition in each replicate. Individual replicates are displayed in Figure S6A and tabulated in Supplemental Data 2. (C) In contrast to the relative abundance of HA and NA (top), the fraction of particles labeling positive for NP is not significantly affected by temperature shifts between 33°C and 37°C. Quantification in all cases shows the mean and standard deviation of population medians from three biological replicates, with N > 30000 viruses per condition in each replicate. Significance evaluated using a paired-sample T-test. (D) Comparing the total distribution of HA and NA in virus populations (as measured by immobilizing virus on coverslips using an HA-specific antibody, top row) to the distribution of HA and NA in viruses competent for binding to cells (middle row) and becoming internalized (bottom row). Under both 33°C and 37°C growth conditions, viruses capable of binding to cells and becoming internalized closely match the population as a whole, indicating that adhesion can occur for a broad range of HA and NA abundance. Regions marked by dashed lines indicate “higher NA” and “higher HA” subpopulations, with the percentage of particles in the “higher NA” group indicated in the upper left. Intensity values differ from those in (B) due to differences in the acquisition settings used for these three-dimensional samples (STAR Methods). Data is from four biological replicates, with individual replicates plotted in Figure S6B and tabulated in Supplemental Data 2. (E) Histograms of antibody binding discriminate between peripherally-bound particles (high labeling) and internalized particles (low labeling). Virus raised at 33°C show slightly higher tendency towards internalization than viruses raised at 37°C (data from individual replicates plotted in Figure S6B).
Figure 5:. A compositional and morphological subpopulation of viruses challenged by neuraminidase inhibitors succeed in escaping from host cells.
(A) Comparing the heterogeneity of populations of virus exposed to NAIs that are able to detach from infected cells (red dotted circle) to those that cannot (blue dotted circle). (B) Treatment with physiological doses of the NAI oseltamivir shifts the phenotype of released viruses towards lower HA and higher NA abundance (top row). Viruses that remain bound under these conditions have predominantly high-HA phenotypes (“+exo. NA”, bottom row). Percentages give the number of particles within the gated region defined by dashed lines. Data from individual replicates are plotted in Figure S7A and tabulated in Supplemental Data 2. (C) Comparison of HA-NA ratio in viruses released under different challenge (“NAI”) or permissive (“exo. NA”) conditions. Viruses that release from NAI-treated cells have significantly lower HA/NA ratios than those that release in the absence of inhibitor or in the presence of both inhibitor and exogenous NA. Bars represent mean +/− S.D. for population medians, with the number of replicates (n) given below each condition (_p_-values determined using a two-sample T-test). (D) Composition of filamentous viruses (L > 1µm) released under challenge and/or permissive conditions. While the density of HA on filamentous particles (total HA intensity divided by particle length) does not change, filamentous viruses shed from cells challenged with NAI show a slight but significant increase in NA density. Bars represent mean +/− S.D. for population medians measured in four independent experiments with between 499 and 2067 filamentous viruses each (_p_-values determined using a two-sample T-test). (E) Measuring the propensity of viruses to detach from sialic acid coated coverslips as a function of their shape and composition. (F) Viruses that detach within a 1 hr observation period have significantly lower HA/NA ratios and significantly shorter lengths, as shown in (G). Quantification is based on three independent experiments with N > 366 released viruses and N > 991 attached viruses recorded in each. Data from individual experiments are plotted in Figure S7B. P-values calculated using a two-sample K-S test (F) and a two-sample T-test (G).
Figure 6:. Morphological variability of influenza A virus is reduced by neuraminidase inhibitors challenge.
(A) Treatment with NAI at approximate physiological concentrations shortens the typical length of released viral filaments (“Released” column), while longer filaments are preferentially sequestered on the cell surface (“Attached” column). (B) Frequency plots showing the distribution of particle lengths within released, attached, and total populations of viruses. Plots show the mean +/− S.D. for length distributions determined from four biological replicates. For released viruses, differences are significant for all lengths (P < 0.01; two-sample t-test); for attached viruses as well as the total population, differences are significant for lengths above ~2.5µm (P < 0.05; two-sample t-test).
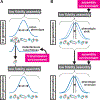
Figure 7:. Low fidelity assembly in IAV contributes to survival in fluctuating environments by creating broad and malleable phenotypic variability.
(A) Environmental inputs during transmission can restrict viral fitness, selecting phenotypic subsets (illustrated here by a single surviving virus) within the broader virus population (schematized by a distribution with variance σ). The low-fidelity assembly of IAV allows surviving subpopulations to reestablish phenotypic variability in the subsequent generation. (B) Environmental inputs also act during assembly, influencing virus phenotype through non-genetic shifts in virus composition and morphology that are reversible from one generation to the next.
Comment in
- Flu Shows the Power of Diversity.
Martin BE, Brooke CB. Martin BE, et al. Cell. 2019 Jan 10;176(1-2):9-10. doi: 10.1016/j.cell.2018.12.017. Cell. 2019. PMID: 30633911
Similar articles
- Moving On Out: Transport and Packaging of Influenza Viral RNA into Virions.
Lakdawala SS, Fodor E, Subbarao K. Lakdawala SS, et al. Annu Rev Virol. 2016 Sep 29;3(1):411-427. doi: 10.1146/annurev-virology-110615-042345. Annu Rev Virol. 2016. PMID: 27741407 Review. - Infection of Mouse Macrophages by Seasonal Influenza Viruses Can Be Restricted at the Level of Virus Entry and at a Late Stage in the Virus Life Cycle.
Londrigan SL, Short KR, Ma J, Gillespie L, Rockman SP, Brooks AG, Reading PC. Londrigan SL, et al. J Virol. 2015 Dec;89(24):12319-29. doi: 10.1128/JVI.01455-15. Epub 2015 Sep 30. J Virol. 2015. PMID: 26423941 Free PMC article. - Intracellular Colocalization of Influenza Viral RNA and Rab11A Is Dependent upon Microtubule Filaments.
Nturibi E, Bhagwat AR, Coburn S, Myerburg MM, Lakdawala SS. Nturibi E, et al. J Virol. 2017 Sep 12;91(19):e01179-17. doi: 10.1128/JVI.01179-17. Print 2017 Oct 1. J Virol. 2017. PMID: 28724771 Free PMC article. - A Defect in Influenza A Virus Particle Assembly Specific to Primary Human Macrophages.
Bedi S, Noda T, Kawaoka Y, Ono A. Bedi S, et al. mBio. 2018 Oct 23;9(5):e01916-18. doi: 10.1128/mBio.01916-18. mBio. 2018. PMID: 30352935 Free PMC article. - Role of lipid rafts in virus assembly and budding.
Nayak DP, Barman S. Nayak DP, et al. Adv Virus Res. 2002;58:1-28. doi: 10.1016/s0065-3527(02)58001-5. Adv Virus Res. 2002. PMID: 12205777 Review. No abstract available.
Cited by
- The pathogenesis of influenza in intact alveoli: virion endocytosis and its effects on the lung's air-blood barrier.
Hook JL, Bhattacharya J. Hook JL, et al. Front Immunol. 2024 Jan 26;15:1328453. doi: 10.3389/fimmu.2024.1328453. eCollection 2024. Front Immunol. 2024. PMID: 38343548 Free PMC article. Review. - Cholesterol and M2 Rendezvous in Budding and Scission of Influenza A Virus.
Madsen JJ, Rossman JS. Madsen JJ, et al. Subcell Biochem. 2023;106:441-459. doi: 10.1007/978-3-031-40086-5_16. Subcell Biochem. 2023. PMID: 38159237 - Can iron chelators ameliorate viral infections?
Pereira TA, Espósito BP. Pereira TA, et al. Biometals. 2024 Apr;37(2):289-304. doi: 10.1007/s10534-023-00558-x. Epub 2023 Nov 29. Biometals. 2024. PMID: 38019378 Review. - Machine learning for cross-scale microscopy of viruses.
Petkidis A, Andriasyan V, Greber UF. Petkidis A, et al. Cell Rep Methods. 2023 Sep 25;3(9):100557. doi: 10.1016/j.crmeth.2023.100557. Epub 2023 Aug 17. Cell Rep Methods. 2023. PMID: 37751685 Free PMC article. Review. - High-throughput super-resolution analysis of influenza virus pleomorphism reveals insights into viral spatial organization.
McMahon A, Andrews R, Groves D, Ghani SV, Cordes T, Kapanidis AN, Robb NC. McMahon A, et al. PLoS Pathog. 2023 Jun 30;19(6):e1011484. doi: 10.1371/journal.ppat.1011484. eCollection 2023 Jun. PLoS Pathog. 2023. PMID: 37390113 Free PMC article.
References
- Balaban NQ (2004). Bacterial Persistence as a Phenotypic Switch. Science 305, 1622–1625. - PubMed
- Baldwin JM (1896). A New Factor in Evolution. Am. Nat 30, 441–451.
Publication types
MeSH terms
Substances
LinkOut - more resources
Full Text Sources
Other Literature Sources
Miscellaneous


