Decline of coastal apex shark populations over the past half century - PubMed (original) (raw)
Decline of coastal apex shark populations over the past half century
George Roff et al. Commun Biol. 2018.
Abstract
Overexploitation of large apex marine predators is widespread in the world's oceans, yet the timing and extent of declines are poorly understood. Here we reconstruct a unique fisheries-independent dataset from a shark control programme spanning 1760 km of the Australian coastline over the past 55 years. We report substantial declines (74-92%) of catch per unit effort of hammerhead (Sphyrnidae), whaler (Carcharhinidae), tiger shark (Galeocerdo cuvier) and white sharks (Carcharodon carcharias). Following onset of the program in the 1960s, catch rates in new installations in subsequent decades occurred at a substantially lower rate, indicating regional depletion of shark populations over the past half a century. Concurrent declines in body size and the probability of encountering mature individuals suggests that apex shark populations are more vulnerable to exploitation than previously thought. Ongoing declines and lack of recovery of vulnerable and protected shark species are a cause for concern.
Conflict of interest statement
The authors declare no competing interests.
Figures
Fig. 1
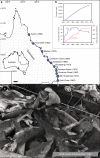
Regional setting and historical changes in catch and effort for the Queensland Shark Control Program. a Timing of the establishment of shark control programmes across the Queensland coastline (map created under Creative Commons Attribution 4.0 International from Geoscience Australia). b Cumulative effort for nets and drumlines and catch between 1962 and 2017. c Historical photograph of contractors measuring sharks removed from QSCP nets on the Gold Coast in the early years of the programme (3 November 1963), reprinted from Paterson (1990) Biological Conservation, 52(2), 147–159 (ref. ) with permission from Elsevier
Fig. 2
Catch per unit effort (CPUE) in nets and drumlines with fits from Bayesian negative binomial generalised additive mixed effects models (± 95% credibility intervals), and the annual zero-catch probability (± 95% credibility intervals). Percentages represent the % decline over the 1962–2017 dataset. Photographs courtesy of Juan Oliphant (
)
Fig. 3
Initial catch per unit effort (defined as the average CPUE of the first five years of operation) for each beach within regions, and model fits from Bayesian generalised additive mixed effects models (± 95% credibility intervals) for nets and drumlines. Symbols courtesy of the Integration and Application Network (
ian.umces.edu/symbols/
)
Fig. 4
Long-term changes in size structure and sexual maturity. Linear regressions (± 95% confidence intervals) for change in size for a hammerheads (1962–2017, shading indicates period in which species specific data are available), great and scalloped hammerheads (Sphyrna mokarran and Sphyrna lewini, 1997–2017), b whaler sharks (Carcharhinidae, 1962–2015), c tiger sharks (Galeocerdo cuvier, 1962–2017), and binomial probability models for sexual maturity in male and female, d great and scalloped hammerheads (S. mokarran and S. lewini, 1997–2017) and e tiger sharks (G. cuvier, 1962–2017). ns not significant. ***p < 0.001, **p < 0.01, *p < 0.05. Symbols courtesy of the Integration and Application Network (
ian.umces.edu/symbols/
)
Fig. 5
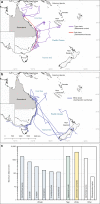
Regional movement patterns among coastal and oceanic ecosystems. Representative movement tracks derived from satellite and acoustic tracking studies of sharks adjacent to the eastern Australian coastline for a tiger sharks (Galeocerdo cuvier, n = 10) and bull sharks (Carcharhinus leucas, n = 17), b white sharks (Carcharodon carcharias, n = 6), and c maximum distance derived from movement studies for whaler sharks (Carcharhinidae), tiger sharks (G. cuvier), and white sharks (C. carcharias) caught in the QSCP program
Similar articles
- Thirty-five years of tiger shark Galeocerdo cuvier relative abundance near Bimini, The Bahamas, and the Southeastern United States with a comparison across jurisdictional bounds.
Smukall MJ, Carlson J, Kessel ST, Guttridge TL, Dhellemmes F, Seitz AC, Gruber S. Smukall MJ, et al. J Fish Biol. 2022 Jul;101(1):13-25. doi: 10.1111/jfb.15067. Epub 2022 May 24. J Fish Biol. 2022. PMID: 35446438 - Relative abundance and size of coastal sharks derived from commercial shark longline catch and effort data.
Carlson JK, Hale LF, Morgan A, Burgess G. Carlson JK, et al. J Fish Biol. 2012 Apr;80(5):1749-64. doi: 10.1111/j.1095-8649.2011.03193.x. Epub 2012 Jan 18. J Fish Biol. 2012. PMID: 22497406 - Ocean warming alters the distributional range, migratory timing, and spatial protections of an apex predator, the tiger shark (Galeocerdo cuvier).
Hammerschlag N, McDonnell LH, Rider MJ, Street GM, Hazen EL, Natanson LJ, McCandless CT, Boudreau MR, Gallagher AJ, Pinsky ML, Kirtman B. Hammerschlag N, et al. Glob Chang Biol. 2022 Mar;28(6):1990-2005. doi: 10.1111/gcb.16045. Epub 2022 Jan 13. Glob Chang Biol. 2022. PMID: 35023247 Free PMC article. - Patterns and ecosystem consequences of shark declines in the ocean.
Ferretti F, Worm B, Britten GL, Heithaus MR, Lotze HK. Ferretti F, et al. Ecol Lett. 2010 Aug 1;13(8):1055-71. doi: 10.1111/j.1461-0248.2010.01489.x. Epub 2010 May 26. Ecol Lett. 2010. PMID: 20528897 Review. - [Shark attacks in New Caledonia from 1958 to 2020: a review of cases].
Maillaud C, Tirard P, Borsa P, Guittonneau AL, Fournier J, Nour M. Maillaud C, et al. Med Trop Sante Int. 2022 Feb 10;2(1):mtsi.v2i1.2022.209. doi: 10.48327/mtsi.v2i1.2022.209. eCollection 2022 Mar 31. Med Trop Sante Int. 2022. PMID: 35685842 Free PMC article. Review. French.
Cited by
- Half a century of rising extinction risk of coral reef sharks and rays.
Sherman CS, Simpfendorfer CA, Pacoureau N, Matsushiba JH, Yan HF, Walls RHL, Rigby CL, VanderWright WJ, Jabado RW, Pollom RA, Carlson JK, Charvet P, Bin Ali A, Fahmi, Cheok J, Derrick DH, Herman KB, Finucci B, Eddy TD, Palomares MLD, Avalos-Castillo CG, Kinattumkara B, Blanco-Parra MD, Dharmadi, Espinoza M, Fernando D, Haque AB, Mejía-Falla PA, Navia AF, Pérez-Jiménez JC, Utzurrum J, Yuneni RR, Dulvy NK. Sherman CS, et al. Nat Commun. 2023 Jan 17;14(1):15. doi: 10.1038/s41467-022-35091-x. Nat Commun. 2023. PMID: 36650137 Free PMC article. - Remote reefs and seamounts are the last refuges for marine predators across the Indo-Pacific.
Letessier TB, Mouillot D, Bouchet PJ, Vigliola L, Fernandes MC, Thompson C, Boussarie G, Turner J, Juhel JB, Maire E, Caley MJ, Koldewey HJ, Friedlander A, Sala E, Meeuwig JJ. Letessier TB, et al. PLoS Biol. 2019 Aug 6;17(8):e3000366. doi: 10.1371/journal.pbio.3000366. eCollection 2019 Aug. PLoS Biol. 2019. PMID: 31386657 Free PMC article. - Almost nothing is known about the tiger shark in South Atlantic waters.
Balanin S, Hauser-Davis RA, Giareta E, Charvet P, Wosnick N. Balanin S, et al. PeerJ. 2023 Jan 20;11:e14750. doi: 10.7717/peerj.14750. eCollection 2023. PeerJ. 2023. PMID: 36700003 Free PMC article. - Half a century of global decline in oceanic sharks and rays.
Pacoureau N, Rigby CL, Kyne PM, Sherley RB, Winker H, Carlson JK, Fordham SV, Barreto R, Fernando D, Francis MP, Jabado RW, Herman KB, Liu KM, Marshall AD, Pollom RA, Romanov EV, Simpfendorfer CA, Yin JS, Kindsvater HK, Dulvy NK. Pacoureau N, et al. Nature. 2021 Jan;589(7843):567-571. doi: 10.1038/s41586-020-03173-9. Epub 2021 Jan 27. Nature. 2021. PMID: 33505035 - Long term declines in the functional diversity of sharks in the coastal oceans of eastern Australia.
Henderson CJ, Gilby BL, Turschwell MP, Goodridge Gaines LA, Mosman JD, Schlacher TA, Borland HP, Olds AD. Henderson CJ, et al. Commun Biol. 2024 May 21;7(1):611. doi: 10.1038/s42003-024-06308-0. Commun Biol. 2024. PMID: 38773323 Free PMC article.
References
- Ferretti F, Worm B, Britten GL, Heithaus MR, Lotze HK. Patterns and ecosystem consequences of shark declines in the ocean. Ecol. Lett. 2010;13:1055–1071. - PubMed
LinkOut - more resources
Full Text Sources
Miscellaneous


