Latin Americans show wide-spread Converso ancestry and imprint of local Native ancestry on physical appearance - PubMed (original) (raw)
doi: 10.1038/s41467-018-07748-z.
Kaustubh Adhikari 1, Macarena Fuentes-Guajardo 1 2, Javier Mendoza-Revilla 1 3, Victor Acuña-Alonzo 1 4, Rodrigo Barquera 4 5, Mirsha Quinto-Sánchez 6, Jorge Gómez-Valdés 7, Paola Everardo Martínez 8, Hugo Villamil-Ramírez 9, Tábita Hünemeier 10, Virginia Ramallo 11 12, Caio C Silva de Cerqueira 12, Malena Hurtado 3, Valeria Villegas 3, Vanessa Granja 3, Mercedes Villena 13, René Vásquez 14, Elena Llop 15, José R Sandoval 16, Alberto A Salazar-Granara 16, Maria-Laura Parolin 17, Karla Sandoval 18, Rosenda I Peñaloza-Espinosa 19, Hector Rangel-Villalobos 20, Cheryl A Winkler 21, William Klitz 22, Claudio Bravi 23, Julio Molina 24, Daniel Corach 25, Ramiro Barrantes 26, Verónica Gomes 27 28, Carlos Resende 27 28, Leonor Gusmão 27 28 29, Antonio Amorim 27 28 30, Yali Xue 31, Jean-Michel Dugoujon 32, Pedro Moral 33, Rolando González-José 11, Lavinia Schuler-Faccini 12, Francisco M Salzano 12, Maria-Cátira Bortolini 12, Samuel Canizales-Quinteros 9, Giovanni Poletti 3, Carla Gallo 3, Gabriel Bedoya 34, Francisco Rothhammer 15 35, David Balding 1 36, Garrett Hellenthal 37, Andrés Ruiz-Linares 38 39
Affiliations
- PMID: 30568240
- PMCID: PMC6300600
- DOI: 10.1038/s41467-018-07748-z
Latin Americans show wide-spread Converso ancestry and imprint of local Native ancestry on physical appearance
Juan-Camilo Chacón-Duque et al. Nat Commun. 2018.
Abstract
Historical records and genetic analyses indicate that Latin Americans trace their ancestry mainly to the intermixing (admixture) of Native Americans, Europeans and Sub-Saharan Africans. Using novel haplotype-based methods, here we infer sub-continental ancestry in over 6,500 Latin Americans and evaluate the impact of regional ancestry variation on physical appearance. We find that Native American ancestry components in Latin Americans correspond geographically to the present-day genetic structure of Native groups, and that sources of non-Native ancestry, and admixture timings, match documented migratory flows. We also detect South/East Mediterranean ancestry across Latin America, probably stemming mostly from the clandestine colonial migration of Christian converts of non-European origin (Conversos). Furthermore, we find that ancestry related to highland (Central Andean) versus lowland (Mapuche) Natives is associated with variation in facial features, particularly nose morphology, and detect significant differences in allele frequencies between these groups at loci previously associated with nose morphology in this sample.
Conflict of interest statement
The authors declare no competing interests. G.H. is a founding member of GenSci. J.C.C.D was employed by Living DNA from October 2017 to November 2018.
Figures
Fig. 1
Reference population samples and SOURCEFIND ancestry estimates for the five Latin American countries examined. a Colored pies and grey dots indicate the approximate geographic location of the 117 reference population samples studied. These samples have been subdivided on the world map into five major bio-geographic regions: Native Americans (38 populations), Europeans (42 populations), East/South Mediterraneans (15 populations), Sub-Saharan Africans (15 populations) and East Asians (7 populations). The coloring of pies represents the proportion of individuals from that population included in one of the 35 reference groups defined using fineSTRUCTURE (these groups are listed in the color-coded insets for each region; Supplementary Fig. 2). The small dark grey dots indicate reference populations not inferred to contribute ancestry to the CANDELA sample. b–d refer to the CANDELA dataset. b, c show, respectively, the average estimated proportion of sub-continental Native American and European ancestry components in individuals with >5% total Native American or European ancestry in each country sampled; the stacked bars are color-coded as for the reference population groups shown in the insets of (a). d shows boxplots of the estimated sub-continental ancestry components for individuals with >5% total Sephardic/East/South Mediterranean ancestry. In this panel colors refer to countries as for the colored country labels shown in (a). Following standard convention for boxplots, the center line denotes the median, the box boundaries represent the first and the third quartiles, and the whiskers range to 1.5 times the inter-quartile range on either side. Outlying points are plotted individually
Fig. 2
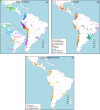
Geographic variation of ancestry sub-components in Latin American individuals. a Native American, b European, and c East/South Mediterranean. Each pie represents an individual, with pie location corresponding to birthplace. Since many individuals share birthplace, jittering has been performed based on pie size and how crowded an area is. Pie size is proportional to total ancestry from all sources depicted in that specific figure, and only individuals with >5% of such total ancestry are shown. Coloring of pies represents the proportion of each sub-continental component estimated for each individual (color-coded as in Fig. 1; Chaco2 does not contribute >5% to any individual and was excluded). Pies in (c) have been enlarged to facilitate visualization
Fig. 3
Times since admixture estimated using GLOBETROTTER. a Top: frequency distribution of admixture times for individuals in which a single admixture event between Native and European sources was inferred (dashed line indicates the mean). Bottom: mean continental ancestry (%) as a function of time since admixture among these individuals. Only time bins including >20 individuals are shown. (NAM Native American, EUR European, ESM East/South Mediterranean, SSA Sub-Saharan African, EAS East Asian). b–e show contrasts of the distribution of admixture times involving Iberian versus other sources: b North-West Europe and Italy, c East Mediterranean and Sephardic, d Sub-Saharan Africa and e East Asia. _p_-values for comparing the mean date of Iberian versus each other ancestry source are from a one-sided Mann–Whitney U test, and numbers of inferred admixture events are given in parenthesis
Fig. 4
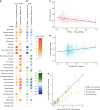
Effect of sub-continental genetic ancestry on physical appearance. a Regression –log _p_-values for 28 traits (Supplementary Note 4) against the contrast between two sub-continental ancestry components estimated by SOURCEFIND. The left column shows results for the Portugal/West-Spain versus North-West Europe contrast in the Brazilian sample (Br). The right column presents the contrast between Central Andes versus Mapuche ancestry in the full CANDELA sample. b Regression coefficients (Betas) in units of SD for the contrasts in (a). In a, b color intensity reflects variation in -Log-p values or beta coefficients, as indicated on the scale. Bonferroni-corrected significant values are highlighted with a dot (–log _p_-value threshold of 3.05 for alpha = 0.05). c, d Display scatterplots and regression lines (with 95% confidence intervals) for two traits showing significant association with variation in sub-continental ancestry: skin melanin index in Brazilians (c) and nose bridge breadth in Chileans and Peruvians (d; _Y_-axis is in Procrustes units). e Scatterplot of -log _p_-values from follow-up analyses of the regression of physical traits on the Central Andes versus Mapuche ancestry contrast. The X-axis refers to -log _p_-values from the primary analyses (using SOURCEFIND (SF) estimates and data for all individuals, as shown in the second column of (a)). The Y-axis refers to -log-p values from four other regression analyses: using SOURCEFIND (SF) estimates restricted to Peruvian and Chilean individuals, or only to Chileans; using related ancestry components defined by: ADMIXTURE (ADMIX., at K = 7) in all the CANDELA data, or by PCA (PC 7), in an analysis limited to Chileans (Supplementary Note 5, Supplementary Figures 8 and 9). Sample sizes: all data N = 5,794, Peruvians and Chileans N = 2,594, Chileans N = 1,542
Similar articles
- Genomic Insights into the Ancestry and Demographic History of South America.
Homburger JR, Moreno-Estrada A, Gignoux CR, Nelson D, Sanchez E, Ortiz-Tello P, Pons-Estel BA, Acevedo-Vasquez E, Miranda P, Langefeld CD, Gravel S, Alarcón-Riquelme ME, Bustamante CD. Homburger JR, et al. PLoS Genet. 2015 Dec 4;11(12):e1005602. doi: 10.1371/journal.pgen.1005602. eCollection 2015 Dec. PLoS Genet. 2015. PMID: 26636962 Free PMC article. - Dissecting the Pre-Columbian Genomic Ancestry of Native Americans along the Andes-Amazonia Divide.
Gnecchi-Ruscone GA, Sarno S, De Fanti S, Gianvincenzo L, Giuliani C, Boattini A, Bortolini E, Di Corcia T, Sanchez Mellado C, Dàvila Francia TJ, Gentilini D, Di Blasio AM, Di Cosimo P, Cilli E, Gonzalez-Martin A, Franceschi C, Franceschi ZA, Rickards O, Sazzini M, Luiselli D, Pettener D. Gnecchi-Ruscone GA, et al. Mol Biol Evol. 2019 Jun 1;36(6):1254-1269. doi: 10.1093/molbev/msz066. Mol Biol Evol. 2019. PMID: 30895292 Free PMC article. - Outlining the Ancestry Landscape of Colombian Admixed Populations.
Ossa H, Aquino J, Pereira R, Ibarra A, Ossa RH, Pérez LA, Granda JD, Lattig MC, Groot H, Fagundes de Carvalho E, Gusmão L. Ossa H, et al. PLoS One. 2016 Oct 13;11(10):e0164414. doi: 10.1371/journal.pone.0164414. eCollection 2016. PLoS One. 2016. PMID: 27736937 Free PMC article. - Gm haplotype distribution in Amerindians: relationship with geography and language.
Callegari-Jacques SM, Salzano FM, Constans J, Maurieres P. Callegari-Jacques SM, et al. Am J Phys Anthropol. 1993 Apr;90(4):427-44. doi: 10.1002/ajpa.1330900404. Am J Phys Anthropol. 1993. PMID: 7682769 Review. - Genetic variation in the New World: ancient teeth, bone, and tissue as sources of DNA.
Merriwether DA, Rothhammer F, Ferrell RE. Merriwether DA, et al. Experientia. 1994 Jun 15;50(6):592-601. doi: 10.1007/BF01921730. Experientia. 1994. PMID: 8020620 Review.
Cited by
- Treating the Latin American Aesthetic Patient: A Review.
Trindade de Almeida AR, Garcia PE, Banegas R, Zimbres S, Martinez C, Frolik J, Cazerta de Paula Eduardo C. Trindade de Almeida AR, et al. Clin Cosmet Investig Dermatol. 2024 Oct 16;17:2311-2321. doi: 10.2147/CCID.S482551. eCollection 2024. Clin Cosmet Investig Dermatol. 2024. PMID: 39430647 Free PMC article. Review. - Genetic associations with disease in populations with Indigenous American ancestries.
Vicuña L. Vicuña L. Genet Mol Biol. 2024 Sep 9;47Suppl 1(Suppl 1):e20230024. doi: 10.1590/1678-4685-GMB-2023-0024. eCollection 2024. Genet Mol Biol. 2024. PMID: 39254840 Free PMC article. - Global DNA hypermethylation pattern and unique gene expression signature in liver cancer from patients with Indigenous American ancestry.
Cerapio JP, Marchio A, Cano L, López I, Fournié JJ, Régnault B, Casavilca-Zambrano S, Ruiz E, Dejean A, Bertani S, Pineau P. Cerapio JP, et al. Oncotarget. 2021 Mar 2;12(5):475-492. doi: 10.18632/oncotarget.27890. eCollection 2021 Mar 2. Oncotarget. 2021. PMID: 33747361 Free PMC article. - Ancestry effects on type 2 diabetes genetic risk inference in Hispanic/Latino populations.
Chande AT, Rishishwar L, Conley AB, Valderrama-Aguirre A, Medina-Rivas MA, Jordan IK. Chande AT, et al. BMC Med Genet. 2020 Jun 25;21(Suppl 2):132. doi: 10.1186/s12881-020-01068-0. BMC Med Genet. 2020. PMID: 32580712 Free PMC article. - Neanderthal introgression in SCN9A impacts mechanical pain sensitivity.
Faux P, Ding L, Ramirez-Aristeguieta LM, Chacón-Duque JC, Comini M, Mendoza-Revilla J, Fuentes-Guajardo M, Jaramillo C, Arias W, Hurtado M, Villegas V, Granja V, Barquera R, Everardo-Martínez P, Quinto-Sánchez M, Gómez-Valdés J, Villamil-Ramírez H, Silva de Cerqueira CC, Hünemeier T, Ramallo V, Gonzalez-José R, Schüler-Faccini L, Bortolini MC, Acuña-Alonzo V, Canizales-Quinteros S, Poletti G, Gallo C, Rothhammer F, Rojas W, Schmid AB, Adhikari K, Bennett DL, Ruiz-Linares A. Faux P, et al. Commun Biol. 2023 Oct 10;6(1):958. doi: 10.1038/s42003-023-05286-z. Commun Biol. 2023. PMID: 37816865 Free PMC article.
References
- Salzano FM, Bortolini MC. The Evolution and Genetics of Latin American Populations. Cambridge: Cambridge University Press; 2001.
Publication types
MeSH terms
LinkOut - more resources
Full Text Sources


