Molecular and functional heterogeneity of IL-10-producing CD4+ T cells - PubMed (original) (raw)
doi: 10.1038/s41467-018-07581-4.
Shiwa Soukou 1, Babett Steglich 1 2, Paulo Czarnewski 3, Lilan Zhao 2, Sandra Wende 1, Tanja Bedke 1, Can Ergen 1, Carolin Manthey 1, Theodora Agalioti 2, Maria Geffken 4, Oliver Seiz 1, Sara M Parigi 3, Chiara Sorini 3, Jens Geginat [ 5](#full-view-affiliation-5 "INGM-National Institute of Molecular Genetics "Romeo ed Enrica Invernizzi", 20122, Milan, Italy."), Keishi Fujio 6, Thomas Jacobs 7, Thomas Roesch 8, Jacob R Izbicki 2, Ansgar W Lohse 1, Richard A Flavell 9 10, Christian Krebs 11, Jan-Ake Gustafsson 12, Per Antonson 12, Maria Grazia Roncarolo 13, Eduardo J Villablanca 3, Nicola Gagliani 14 15 16, Samuel Huber 17
Affiliations
- PMID: 30575716
- PMCID: PMC6303294
- DOI: 10.1038/s41467-018-07581-4
Molecular and functional heterogeneity of IL-10-producing CD4+ T cells
Leonie Brockmann et al. Nat Commun. 2018.
Abstract
IL-10 is a prototypical anti-inflammatory cytokine, which is fundamental to the maintenance of immune homeostasis, especially in the intestine. There is an assumption that cells producing IL-10 have an immunoregulatory function. However, here we report that IL-10-producing CD4+ T cells are phenotypically and functionally heterogeneous. By combining single cell transcriptome and functional analyses, we identified a subpopulation of IL-10-producing Foxp3neg CD4+ T cells that displays regulatory activity unlike other IL-10-producing CD4+ T cells, which are unexpectedly pro-inflammatory. The combinatorial expression of co-inhibitory receptors is sufficient to discriminate IL-10-producing CD4+ T cells with regulatory function from others and to identify them across different tissues and disease models in mice and humans. These regulatory IL-10-producing Foxp3neg CD4+ T cells have a unique transcriptional program, which goes beyond the regulation of IL-10 expression. Finally, we found that patients with Inflammatory Bowel Disease demonstrate a deficiency in this specific regulatory T-cell subpopulation.
Conflict of interest statement
The authors declare no competing interests.
Figures
Fig. 1
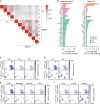
Mouse IL-10-producing CD4+ T cells are heterogeneous. a–c IL-10-producing Foxp3neg CD4+ T cells (IL-10pos) were isolated from small intestine or spleen of aCD3-treated IL-10eGFP Foxp3mRFP double reporter mice. Cells were transferred into lymphopenic hosts and colitis development was assessed by weight loss (c) and endoscopic colitis score (b) 5 weeks upon transfer (IL-10pos cells small intestine n = 12; IL-10pos cells Spleen n = 11; lines indicate mean ±SEM). Results are cumulative of three independent experiments. A Mann–Whitney U test was used to calculate significance. d _t-_SNE analysis of single cell RNA sequencing of IL-10pos cells (including Foxp3+ cells) isolated from small intestine or spleen of aCD3-treated IL-10eGFP Foxp3mRFP double reporter mice. e Bootstrap analysis of HVGs in single cell RNA sequencing data of IL-10pos cells from small intestine and spleen. f Expression of indicated genes in _t-_SNE analysis
Fig. 2
Splenic IL-10-producing CD4+ T cells contain a regulatory cluster. a Spearman correlation coefficient between each cluster from small intestine and spleen. b Fold change analysis of genes enriched in indicated clusters compared to other clusters that were amongst the 100 most enriched genes. c Expression of indicated genes encoding cytokines and chemokines. d Expression of indicated genes encoding transcription factors. e Expression of indicated genes encoding other factors. f Expression of indicated genes encoding surface receptors
Fig. 3
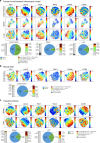
CIR identify regulatory IL-10-producing CD4+ T cells. _vi_SNE analysis of IL-10pos Foxp3neg CD4+ T cells. Clustering is based on MFI of PD-1, LAG-3, TIGIT, TIM-3, CD49b, and CCR5. Blue circle indicates co-inhibitory receptor rich (CIR rich) region. a Analysis of cells from small intestine, spleen, and lung of aCD3-treated IL-10eGFP Foxp3mRFP double reporter mice (n = 4). Data are representative of two independent experiments. b Analysis of untreated IL-10eGFP Foxp3mRFP double reporter mice (n = 3). Data are representative of three independent experiments. c Analysis of P. berghei infected IL-10eGFP Foxp3mRFP double reporter mice (n = 3). Data are representative of two independent experiments
Fig. 4
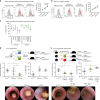
CIR rich CD4+ T cells have a high suppressive capacity. a In vitro suppression of co-inhibitory receptor rich (CIR rich) and co-inhibitory receptor poor (CIR poor) IL-10pos Foxp3neg CD4+ T cells isolated from spleen of aCD3-treated IL-10eGFP Foxp3mRFP double reporter mice. Representative histograms of five independent experiments, a paired _T-_test was used to calculate significance. b In vitro suppression of CIR rich and CIR poor IL-10pos Foxp3neg CD4+ T cells isolated from spleen of P. berghei infected IL-10eGFP Foxp3mRFP double reporter mice. Representative histograms of four independent experiments. c In vitro suppression of CIR rich and CIR poor IL-10pos Foxp3neg CD4+ T cells isolated from spleen of aCD3-treated IL-10eGFP Foxp3mRFP reporter mice. TIM-3 and LAG-3 were blocked using blocking antibodies. To block IL-10 receptor signaling responder T cells were isolated from IL-10R dominant negative mice (DN IL-10R Responder). Results are cumulative of three independent experiments. d CIR rich and CIR poor IL-10pos Foxp3neg CD4+ T cells and IL-10neg CD4+ T cells were isolated from spleen of aCD3-treated IL-10eGFP Foxp3mRFP double reporter mice. Cells were transferred into lymphopenic hosts and colitis development was assessed by weight loss and endoscopic colitis score 5 weeks upon transfer (IL-10neg n = 6; CIR poor n = 9; CIR rich n = 6; lines indicate mean±SEM). Results are cumulative of three independent experiments. One-way ANOVA (post-test Tukey) was used to calculate significance (*p < 0.05). e CIR rich IL-10-producing Foxp3neg CD4+ T cells, IL-10neg CD4+ T cells and Foxp3+ Treg cells were isolated from spleen of aCD3-treated IL-10eGFP Foxp3mRFP double reporter mice. IL-10pos CIR rich or Foxp3+ Treg cells were co-transferred with IL-10neg CD4+ T cells and colitis development was assessed by weight loss and endoscopic colitis score 5 weeks upon transfer (IL-10neg n = 7; IL-10neg + CIR rich n = 6; IL-10neg + Foxp3+ Treg n = 6; lines indicate mean±SEM). Results are cumulative of three independent experiments. One-way ANOVA (post-test Tukey) was used to calculate significance (*p < 0.05)
Fig. 5
CIR rich CD4+ T cells have a distinct transcriptional program. a Volcano plots of bulk RNA sequencing data of indicated populations (IL-10pos CIR rich n = 2; IL-10pos CIR poor n = 2; IL-10neg n = 2). b Expression of known TR1 signature genes comparing IL-10pos CIR rich with IL-10neg and IL-10pos CIR rich with IL-10pos CIR poor. c Differentially expressed transcription factors between IL-10pos CIR rich and IL-10pos CIR poor. mRNA expression of indicated genes normalized to Hprt from at least three independent experiments (separated low-high, line represents median). d CD4+ T cells isolated from _Lxrα_-/- CD45.2 and wildtype CD45.2 mice were co-transferred with wildtype CD4+ T cells (CD45.1/2) into lymphopenic hosts. Animals (WT:KO n = 7; WT:WT n = 6) were treated with aCD3 antibodies 5 weeks upon transfer and cells were isolated from small intestine. Results are cumulative of two independent experiments. A Wilcoxon test was used to calculate significance. e Correlation between genes significantly higher expressed in IL-10pos CIR rich versus IL-10pos CIR poor cells and expression pattern of scRNA-seq data
Fig. 6
Human IL-10-producing CD4+ T cells are heterogeneous. a RNA single cell sequencing data of IL-10pos cells (including Foxp3+ T cells) isolated from PBMCs of healthy donors (n = 3), stimulated with SEB overnight. b _vi_SNE analysis of IL-10pos CD25low CD4+ T cells from PBMCs of healthy donors (n = 8) and healthy colon biopsies (n = 4), stimulated with SEB overnight. Clustering is based on MFI of PD-1, LAG-3, TIGIT, TIM-3, CD49b, and CCR5. Blue circle indicates co-inhibitory receptor rich (CIR rich) region. c In vitro suppression of CIR rich and CIR poor IL-10pos CD25low CD4+ T cells isolated from PBMCs of healthy donors, stimulated with SEB overnight. Representative histograms of five independent experiments, a paired _T-_test was used to calculate significance. d, e Analysis of IL-10pos CD25low CD4+ T cells (d) and expression of CD49b/LAG-3 within those (e) of colon biopsies from IBD patients: UC active n = 22 (inflamed n = 20, blue dots; non-inflamed n = 17, black dots); UC Remission n = 2, violet dots; CD active n = 9 (inflamed n = 5, blue dots; non-inflamed n = 6, black dots); CD remission n = 5, violet dots and healthy controls (n = 18). Cells were stimulated with SEB overnight, One-way ANOVA (multiple comparisons) was used to calculate significance (**p < 0.005)
Similar articles
- A comparative study between T regulatory type 1 and CD4+CD25+ T cells in the control of inflammation.
Foussat A, Cottrez F, Brun V, Fournier N, Breittmayer JP, Groux H. Foussat A, et al. J Immunol. 2003 Nov 15;171(10):5018-26. doi: 10.4049/jimmunol.171.10.5018. J Immunol. 2003. PMID: 14607898 - An imbalance in interleukin-17-producing T and Foxp3⁺ regulatory T cells in women with idiopathic recurrent pregnancy loss.
Lee SK, Kim JY, Hur SE, Kim CJ, Na BJ, Lee M, Gilman-Sachs A, Kwak-Kim J. Lee SK, et al. Hum Reprod. 2011 Nov;26(11):2964-71. doi: 10.1093/humrep/der301. Epub 2011 Sep 15. Hum Reprod. 2011. PMID: 21926059 - Homeostatic (IL-7) and effector (IL-17) cytokines as distinct but complementary target for an optimal therapeutic strategy in inflammatory bowel disease.
Kanai T, Nemoto Y, Kamada N, Totsuka T, Hisamatsu T, Watanabe M, Hibi T. Kanai T, et al. Curr Opin Gastroenterol. 2009 Jul;25(4):306-13. doi: 10.1097/MOG.0b013e32832bc627. Curr Opin Gastroenterol. 2009. PMID: 19448533 Review. - IL-10 producing regulatory B cells in mice and humans: state of the art.
Bouaziz JD, Le Buanec H, Saussine A, Bensussan A, Bagot M. Bouaziz JD, et al. Curr Mol Med. 2012 Jun;12(5):519-27. doi: 10.2174/156652412800620057. Curr Mol Med. 2012. PMID: 22292445 Review.
Cited by
- Erratum: Type 1 regulatory T cell-mediated tolerance in health and disease.
Frontiers Production Office. Frontiers Production Office. Front Immunol. 2023 Jan 24;13:1125497. doi: 10.3389/fimmu.2022.1125497. eCollection 2022. Front Immunol. 2023. PMID: 36761160 Free PMC article. - Immune cell identifier and classifier (ImmunIC) for single cell transcriptomic readouts.
Park SY, Ter-Saakyan S, Faraci G, Lee HY. Park SY, et al. Sci Rep. 2023 Jul 26;13(1):12093. doi: 10.1038/s41598-023-39282-4. Sci Rep. 2023. PMID: 37495649 Free PMC article. - Unraveling the Role of Immune Checkpoints in Leishmaniasis.
de Freitas E Silva R, von Stebut E. de Freitas E Silva R, et al. Front Immunol. 2021 Mar 11;12:620144. doi: 10.3389/fimmu.2021.620144. eCollection 2021. Front Immunol. 2021. PMID: 33776999 Free PMC article. Review. - CD4+ teff cell heterogeneity: the perspective from single-cell transcriptomics.
Zemmour D, Kiner E, Benoist C. Zemmour D, et al. Curr Opin Immunol. 2020 Apr;63:61-67. doi: 10.1016/j.coi.2020.02.004. Epub 2020 Apr 4. Curr Opin Immunol. 2020. PMID: 32259715 Free PMC article. Review. - Type 1 regulatory T cell-mediated tolerance in health and disease.
Freeborn RA, Strubbe S, Roncarolo MG. Freeborn RA, et al. Front Immunol. 2022 Oct 28;13:1032575. doi: 10.3389/fimmu.2022.1032575. eCollection 2022. Front Immunol. 2022. PMID: 36389662 Free PMC article. Review.
References
Publication types
MeSH terms
Substances
LinkOut - more resources
Full Text Sources
Molecular Biology Databases
Research Materials


