Comparative transcriptomics identifies patterns of selection in roses - PubMed (original) (raw)
Comparative Study
doi: 10.1186/s12870-018-1585-x.
Micai Zhong 3 4, Xue Dong 3, Xiaodong Jiang 3 4, Yuxing Xu 4, Yibo Sun 3 4, Fang Cheng 3, De-Zhu Li 5, Kaixue Tang 2, Siqing Wang 6, Silan Dai 7, Jin-Yong Hu 8
Affiliations
- PMID: 30579326
- PMCID: PMC6303930
- DOI: 10.1186/s12870-018-1585-x
Comparative Study
Comparative transcriptomics identifies patterns of selection in roses
Shubin Li et al. BMC Plant Biol. 2018.
Abstract
Background: Roses are important plants for human beings with pivotal economical and biological traits like continuous flowering, flower architecture, color and scent. Due to frequent hybridization and high genome heterozygosity, classification of roses and their relatives remains a big challenge.
Results: Here, to identify potential markers for phylogenetic reconstruction and to reveal the patterns of natural selection in roses, we generated sets of high quality and comprehensive reference transcriptomes for Rosa chinensis 'Old Blush' (OB) and R. wichuriana 'Basye's Thornless' (BT), two species exhibiting contrasted traits of high economical importance. The assembled reference transcriptomes showed transcripts N50 above 2000 bp. Two roses shared about 10,073 transcripts (N50 = 2282 bp), in which a set of 5959 transcripts was conserved within genera of Rosa. Further comparison with species in Rosaceae identified 4447 transcripts being common (Rosaceae-common) in Rosa, Malus, Prunus, Rubus, and Fragaria, while a pool of 164 transcripts being specific for roses (Rosa-specific). Among the Rosaceae-common transcripts, 409 transcripts showed a signature of positive selection and a clustered expression in different tissues. Interestingly, nine of these rapidly evolving genes were related to DNA damage repair and responses to environmental stimulus, a potential associated with genome confliction post hybridization. Coincident with this fast evolution pattern in rose genes, 24 F-box and four TMV resistant proteins were significantly enriched in the Rosa-specific genes.
Conclusions: We expect that these Rosaceae-common and Rosa-specific transcripts should facilitate the phylogenetic analysis of Rosaceae plants as well as investigations of Rosa-specific biology. The data reported here could provide fundamental genomic tools and knowledge critical for understanding the biology and domestication of roses and for roses breeding.
Keywords: Comparative transcriptomics; Rosa sp.; Rosa-specific; Rosaceae-common; Selection pattern.
Conflict of interest statement
Ethics approval and consent to participate
Not applicable.
Consent for publication
Not applicable.
Competing interests
The authors declare that they have no competing interests.
Publisher’s Note
Springer Nature remains neutral with regard to jurisdictional claims in published maps and institutional affiliations.
Figures
Fig. 1
Leaf (a) and shoot (b) materials used for RNA-seq in this study. For each panel, left for Rosa wichuriana ‘Basyes’ Thornless’ (BT), and right for R. chinensis ‘Old Blush’ (OB). Bars = 1 cm
Fig. 2
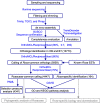
Working flow for assembling of reference trancriptomes and identification of Rosacaeae-common and _Rosa_-specific transcripts. Main steps were shown in boxes with key transcripts numbers given. Major tools used in these analysis were marked in blue. Dashed arrows and boxes indicated the data generated from this study could be explored in these applications
Fig. 3
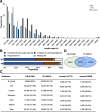
The assembly of high quality transcriptomes for roses. a Length distribution in proportion of assembled unigenes for the two species, Rosa chinensis ‘Old Blush’ (OB, bars filled in grey color), and R. wichuriana ‘Basyes’ Thornless’ (BT, open bars). Bars filled in black color mark the length distribution of shared transcripts between the two species (coreset1; see below and main text). b BUSCO analysis shows the completeness of assemblies and coreset1. c Annotation results of the assembled unigenes and _core-set_s for Rosa. The coreset1 is between the two species, while coreset2 is for the unigenes shared among Rosa (see Fig. 2) based on published and newly collected data from this study. For each category (Nr_plants, GO, Uniprot, Swissprot and COG databases), total unigene counts annotated in different databases besides the proportion (in brackets) are given. Shared and total unigenes annotated by all databases are also given. d Venn diagram shows the results of coreset1 identification. About 10,773 transcripts were identified at the 95% sequence identity level between the two species
Fig. 4
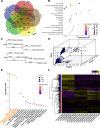
Identification and characterization of Rosaceae-common potential coding gene. a Venn diagram shows the Rosaceae-common and _Rosa_-specific transcripts. Note that, except Rosa, transcripts specific for other genera were not identified (marked with na). For that we are not interested in other share sets. b GO enrichment analysis of the 4447 Rosaceae-common transcripts (
http://bioinfo.cau.edu.cn/agriGO
). X-axis shows the enrichment fold of specific GO terms in comparison with the background. BP, CC and MF mean biological process, cellular component and molecular function separately. The area indicates gene counts. c Representive phylogentic topologies based on 4447 Rosaceae-common genes. Upper panel indicates about 65% topologies (2812) supporting the clustering of Prunus with Malus, while the topology in lower panel is supported by 33% genes (1436). Numbers on branches indicate distance. d Three-dimensional plots for the genetic distances of the 4447 transcripts between Rosa and Fragaria (X-axis) /Malus (Y-axis) /Prunus (Z-axis). Black and blue dots mark the genes supporting the topologies in C (Black for upper panel and blue for lower panel), while gray dots show genes supporting other topologies. e Distribution and GO enrichment analysis of the 409 selected Rosaceae-common transcripts. Y-axis shows the enrichment fold of specific GO terms in comparison with the background. Only four GO items are significantly enriched (marked in orange color). f Clustered heat map comparing scaled expression values for the 409 selected Rosaceae-common transcripts. Yellow indicates higher while purple marks lower expression. Blue and red bars indicate membership in the identified transcription clusters
Fig. 5
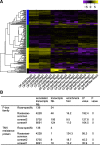
Identification and characterization _Rosa_-specific transcripts. a Heat map comparing scaled expression values for the 164 _Rosa_-specific transcripts. Yellow indicates higher while purple marks lower expression. Blue, green, yellow, and black bars indicate membership in the identified transcription clusters. b F-box and TMV resistance protein were significantly enriched in _Rosa_-specific transcripts. X2 tests were performed online (
http://www.quantpsy.org/chisq/chisq.htm
) by comparing the _Rosa_-specific transcripts number with those from Rosaceae-common, coreset1 and coreset2 genes. P values were corrected with Bonferroni correction
Similar articles
- Small RNA and transcriptome deep sequencing proffers insight into floral gene regulation in Rosa cultivars.
Kim J, Park JH, Lim CJ, Lim JY, Ryu JY, Lee BW, Choi JP, Kim WB, Lee HY, Choi Y, Kim D, Hur CG, Kim S, Noh YS, Shin C, Kwon SY. Kim J, et al. BMC Genomics. 2012 Nov 21;13:657. doi: 10.1186/1471-2164-13-657. BMC Genomics. 2012. PMID: 23171001 Free PMC article. - A high-quality genome sequence of Rosa chinensis to elucidate ornamental traits.
Hibrand Saint-Oyant L, Ruttink T, Hamama L, Kirov I, Lakhwani D, Zhou NN, Bourke PM, Daccord N, Leus L, Schulz D, Van de Geest H, Hesselink T, Van Laere K, Debray K, Balzergue S, Thouroude T, Chastellier A, Jeauffre J, Voisine L, Gaillard S, Borm TJA, Arens P, Voorrips RE, Maliepaard C, Neu E, Linde M, Le Paslier MC, Bérard A, Bounon R, Clotault J, Choisne N, Quesneville H, Kawamura K, Aubourg S, Sakr S, Smulders MJM, Schijlen E, Bucher E, Debener T, De Riek J, Foucher F. Hibrand Saint-Oyant L, et al. Nat Plants. 2018 Jul;4(7):473-484. doi: 10.1038/s41477-018-0166-1. Epub 2018 Jun 11. Nat Plants. 2018. PMID: 29892093 Free PMC article. - The Rosa genome provides new insights into the domestication of modern roses.
Raymond O, Gouzy J, Just J, Badouin H, Verdenaud M, Lemainque A, Vergne P, Moja S, Choisne N, Pont C, Carrère S, Caissard JC, Couloux A, Cottret L, Aury JM, Szécsi J, Latrasse D, Madoui MA, François L, Fu X, Yang SH, Dubois A, Piola F, Larrieu A, Perez M, Labadie K, Perrier L, Govetto B, Labrousse Y, Villand P, Bardoux C, Boltz V, Lopez-Roques C, Heitzler P, Vernoux T, Vandenbussche M, Quesneville H, Boualem A, Bendahmane A, Liu C, Le Bris M, Salse J, Baudino S, Benhamed M, Wincker P, Bendahmane M. Raymond O, et al. Nat Genet. 2018 Jun;50(6):772-777. doi: 10.1038/s41588-018-0110-3. Epub 2018 Apr 30. Nat Genet. 2018. PMID: 29713014 Free PMC article. - Genetics and genomics of flower initiation and development in roses.
Bendahmane M, Dubois A, Raymond O, Bris ML. Bendahmane M, et al. J Exp Bot. 2013 Feb;64(4):847-57. doi: 10.1093/jxb/ers387. Epub 2013 Jan 29. J Exp Bot. 2013. PMID: 23364936 Free PMC article. Review. - Molecular genetics and genomics of the Rosoideae: state of the art and future perspectives.
Longhi S, Giongo L, Buti M, Surbanovski N, Viola R, Velasco R, Ward JA, Sargent DJ. Longhi S, et al. Hortic Res. 2014 Jan 22;1:1. doi: 10.1038/hortres.2014.1. eCollection 2014. Hortic Res. 2014. PMID: 26504527 Free PMC article. Review.
Cited by
- Grape-RNA: A Database for the Collection, Evaluation, Treatment, and Data Sharing of Grape RNA-Seq Datasets.
Wang Y, Zhang R, Liang Z, Li S. Wang Y, et al. Genes (Basel). 2020 Mar 16;11(3):315. doi: 10.3390/genes11030315. Genes (Basel). 2020. PMID: 32188014 Free PMC article. - The complete chloroplast genome sequence of a rambler rose, Rosa wichuraiana (Rosaceae).
Cui WH, Zhong MC, Du XY, Qu XJ, Jiang XD, Sun YB, Wang D, Chen SY, Hu JY. Cui WH, et al. Mitochondrial DNA B Resour. 2019 Dec 12;5(1):252-253. doi: 10.1080/23802359.2019.1700198. Mitochondrial DNA B Resour. 2019. PMID: 33366509 Free PMC article. - Expansion and expression diversity of FAR1/FRS-like genes provides insights into flowering time regulation in roses.
Zhong MC, Jiang XD, Cui WH, Hu JY. Zhong MC, et al. Plant Divers. 2020 Nov 10;43(2):173-179. doi: 10.1016/j.pld.2020.11.002. eCollection 2021 Apr. Plant Divers. 2020. PMID: 33997550 Free PMC article. - Rosoideae-specific duplication and functional diversification of FT-like genes in Rosaceae.
Jiang XD, Zhong MC, Dong X, Li SB, Hu JY. Jiang XD, et al. Hortic Res. 2022 Mar 8;9:uhac059. doi: 10.1093/hr/uhac059. eCollection 2022. Hortic Res. 2022. PMID: 35591929 Free PMC article. No abstract available. - Rose without prickle: genomic insights linked to moisture adaptation.
Zhong MC, Jiang XD, Yang GQ, Cui WH, Suo ZQ, Wang WJ, Sun YB, Wang D, Cheng XC, Li XM, Dong X, Tang KX, Li DZ, Hu JY. Zhong MC, et al. Natl Sci Rev. 2021 May 22;8(12):nwab092. doi: 10.1093/nsr/nwab092. eCollection 2021 Dec. Natl Sci Rev. 2021. PMID: 34987840 Free PMC article.
References
- Li S, Zhou N, Zhou Q, Yan H, Jian H, Wang Q, Chen M, Qiu X, Zhang H, Wang S, et al. Inheritance of perpetual blooming in Rosa chinensis ‘old blush’. Horticult Plant J. 2015;1(2):108–112.
- Randoux M, Daviere JM, Jeauffre J, Thouroude T, Pierre S, Toualbia Y, Perrotte J, Reynoird JP, Jammes MJ, Oyant LHS, et al. RoKSN, a floral repressor, forms protein complexes with RoFD and RoFT to regulate vegetative and reproductive development in rose. New Phytol. 2014;202(1):161–173. - PubMed
- Iwata H, Gaston A, Remay A, Thouroude T, Jeauffre J, Kawamura K, Oyant LH-S, Araki T, Denoyes B, Foucher F. The TFL1 homologue KSN is a regulator of continuous flowering in rose and strawberry. Plant J. 2012;69(1):116–125. - PubMed
Publication types
MeSH terms
Grants and funding
- 31660583/National Natural Science Foundation of China
- 31570311/National Natural Science Foundation of China
- 31501034/National Natural Science Foundation of China
- 292015312D11035/CAS Pioneer Hundred Talents Program
- 000000/Key Laboratory for Plant Diversity and Biogeography of East Asia (CAS)
- 000000/Yunnan Recruitment Program of Experts in Science
LinkOut - more resources
Full Text Sources
Other Literature Sources
Miscellaneous


