The phylum Vertebrata: a case for zoological recognition - PubMed (original) (raw)
Review
The phylum Vertebrata: a case for zoological recognition
Naoki Irie et al. Zoological Lett. 2018.
Abstract
The group Vertebrata is currently placed as a subphylum in the phylum Chordata, together with two other subphyla, Cephalochordata (lancelets) and Urochordata (ascidians). The past three decades, have seen extraordinary advances in zoological taxonomy and the time is now ripe for reassessing whether the subphylum position is truly appropriate for vertebrates, particularly in light of recent advances in molecular phylogeny, comparative genomics, and evolutionary developmental biology. Four lines of current research are discussed here. First, molecular phylogeny has demonstrated that Deuterostomia comprises Ambulacraria (Echinodermata and Hemichordata) and Chordata (Cephalochordata, Urochordata, and Vertebrata), each clade being recognized as a mutually comparable phylum. Second, comparative genomic studies show that vertebrates alone have experienced two rounds of whole-genome duplication, which makes the composition of their gene family unique. Third, comparative gene-expression profiling of vertebrate embryos favors an hourglass pattern of development, the most conserved stage of which is recognized as a phylotypic period characterized by the establishment of a body plan definitively associated with a phylum. This mid-embryonic conservation is supported robustly in vertebrates, but only weakly in chordates. Fourth, certain complex patterns of body plan formation (especially of the head, pharynx, and somites) are recognized throughout the vertebrates, but not in any other animal groups. For these reasons, we suggest that it is more appropriate to recognize vertebrates as an independent phylum, not as a subphylum of the phylum Chordata.
Keywords: Gene expression profile; Gene family; Molecular phylogeny; Organ development; Phylum Vertebrata; Zoological classification.
Conflict of interest statement
Not applicable.Not applicable.The authors declare that they have no competing interests.Springer Nature remains neutral with regard to jurisdictional claims in published maps and institutional affiliations.
Figures
Fig. 1
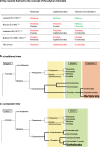
Subphylum Vertebrata of the phylum Chordata. a Key reports that led to the concept of the phylum Chordata. Terms in red are of phylum rank and those in black are of subphylum rank. Those in green were recognized as invertebrates at the times indicated in the first column. b Traditional view (upper) and c our proposed view (lower) of chordate phylogeny with respect to inter-phylum relationships. The proposed phylogeny regards the Cephalochordata, the Urochordata, and the Vertebrata as separate phyla, rather than as subphyla. (m_odified from_ [17])
Fig. 2
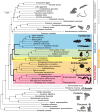
Molecular phylogeny of deuterostome taxa within the metazoan tree. Echinoderms are shown in orange, hemichordates in magenta, cephalochordates in yellow, urochordates in green, and vertebrates in blue. The maximum-likelihood tree was obtained with a supermatrix of 506,428 amino acid residues gathered from 1564 orthologous genes in 56 species (65.1% occupancy), using a Γ + LG model partitioned for each gene. Plain circles at nodes denote maximum bootstrap support. This tree clearly indicates that Deuterostomia comprises two discrete groups, Ambulacraria and Chordata (from [35])
Fig. 3
Hox-cluster gene organization in deuterostomes. Colored ovals indicate Hox genes. Genes of smaller paralogous subgroup numbers are to the left and those of larger numbers are to the right. A putative chordate ancestor may have possessed a single Hox gene cluster with ~ 13 genes. This would have been conserved in hemichordates and cephalochordates, although cephalochordates must have undergone duplication of the posterior-most genes. Echinoderms most likely lost Hox6. In urochordates, the Hox cluster was reorganized; in Ciona intestinalis, Hox genes are mapped on two chromosomes and the putative gene order is shown for Hox2 to 4 and Hox5 and 6. Jawed vertebrates, except teleosts, have four Hox gene clusters (HoxA to HoxD from top to bottom), whereas the sea lamprey contains six Hox gene clusters (Hox-α to Hox-ζ). (References are in the text)
Fig. 4
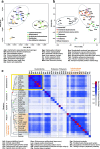
Clustering of metazoan gene family composition. Shown are the results of two independent analyses performed by (a) Simakov et al. [35] and (b, c) Luo et al. [61]. The first two principal components are displayed. a Principal component (PC) analysis of annotated gene functions. At least three clusters are evident, namely a vertebrate cluster (far right; solid-line circle); a non-bilaterian metazoan, invertebrate deuterostome, or spiralian cluster (center, top; dashed-line circle), and an ecdysozoan group (lower left). Drosophila and Tribolium (lower left) are outliers. b PC analysis of PANTHER gene family sizes. Invertebrate deuterostomes (Bfl, Sko, and Spu) cluster with lophotrochozoans (dashed-line circle). Solid-line circle denotes the clustering of vertebrates. In addition to the metazoan species analyzed in (a), the following species were included in the analysis. c Matrix of shared gene families among selected metazoans. The cladogram on the left is based on phylogenetic positions inferred from this study. Dashed lines separate the major clades. Note that tunicates (Cin) and leeches (Hro) share fewer genes with other bilaterians, probably because of their relatively high evolutionary rates and gene loss in each lineage
Fig. 5
The developmental hourglass model and embryos representative of phylotypic periods in vertebrates. In the developmental hourglass model (middle, originally proposed by Duboule [64]), embryogenesis proceeds from the bottom to the top, and evolutionary divergence becomes minimal at the mid-embryonic, organogenesis phase. The conserved mid-embryonic phase has been predicted to define the body plan for each animal phylum [64] and has therefore been named the phylotypic satage [64, 65, 66, 181]. However, further studies are required to fully verify this hypothesis, and a recent study indicated that the hypothesis may be better applied to vertebrates than to chordates [63]. Embryos representative of most conserved vertebrate stages are shown at the left. Curiously, these stages can also be identified as the most conserved stages when comparing groups of species smaller than at the vertebrate level. No consensus has been reached on the mechanism of this mid-embryonic conservation, but two independent studies have implied possible contributions by developmental constraints [63, 74]. In other words, extensive reuse of the same genetic machinery could have imposed limitations on the evolutionary diversification process through pleiotropic constraint (right, modified from Hu et al. [63]). In each developmental stage, grey and black dots represent genetic components that are pleiotropically expressed in other stages and are shared (blue vertical lines) by multiple developmental processes
Fig. 6
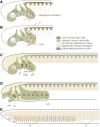
Head–trunk interface. a to c. Schematic representation of the head and trunk in the pharyngula of modern jawed vertebrates, as defined by the migratory/distribution patterns of neural crest cells (NCCs). In the head of the vertebrate pharyngula, NCCs form extensive ectomesenchyme with three major NCC populations, called trigeminal (tc), hyoid (hyc) and circumpharyngeal crest cells (cp), filling the frontonasal region and pharyngeal arches, defining the vertebrate head (yellowish region in C), as opposed to the posterior domain occupied by somites and the lateral plate. In the trunk, NCCs are segmented primarily into somitomeric streams by the presence of somites (dark green). Between the two distinct groups of NCC populations is found an S-shaped interface (red broken line). Circles denote placodes for cranial nerves (oph, ophthalmic placode; mm, maxillomandibular placode; gn, geniculate placode; pet, petrosal placode; nd, nodose placodes). In B, the position of trapezius muscle development (tr) and pathway of the hypobranchial muscle (the hypoglossal cord: hyp) are shown along the head–trunk interface. d. Schematization of an early lamprey larva. Note that the head and trunk can be defined in this animal as a vertebrate-specific feature. e. Comparison with schematized amphioxus. The mesoderm of this animal is entirely segmented into somite-like structures, but there is no overt lateral plate. Because the pharynx is located medial, not ventral, to the body wall, the head–trunk interface cannot be defined in this animal. mn, mandibular arch; mo, mouth; ot, otic vesicle; p, pharyngeal pores in amphioxus; p1 to 8, pharyngeal pouches; PA2 to 4, pharyngeal arches; s, somites
Fig. 7
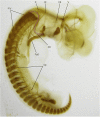
Late pharyngula of the Chinese soft-shelled turtle, Pelodiscus sinensis, immunostained to show peripheral nervous system and muscle primordia. The head–trunk interface is shown by the magenta broken line, delineating the spinal and branchiomeric nerves from each other. Note also that the myotomes are restricted to the trunk region of the embryo. Hyp, hypobranchial muscle anlage; IX, glossopharyngeal nerve; my, myotomes; sp., spinal nerves; V, trigeminal nerve; VII, facial nerve; X, vagus nerve; XII, hypoglossal nerve
Similar articles
- Chordate evolution and the three-phylum system.
Satoh N, Rokhsar D, Nishikawa T. Satoh N, et al. Proc Biol Sci. 2014 Nov 7;281(1794):20141729. doi: 10.1098/rspb.2014.1729. Proc Biol Sci. 2014. PMID: 25232138 Free PMC article. Review. - Deuterostome Ancestors and Chordate Origins.
Swalla BJ. Swalla BJ. Integr Comp Biol. 2024 Nov 21;64(5):1175-1181. doi: 10.1093/icb/icae134. Integr Comp Biol. 2024. PMID: 39104213 Review. - Metaphylogeny of 82 gene families sheds a new light on chordate evolution.
Vienne A, Pontarotti P. Vienne A, et al. Int J Biol Sci. 2006;2(2):32-7. doi: 10.7150/ijbs.2.32. Epub 2006 Apr 10. Int J Biol Sci. 2006. PMID: 16733531 Free PMC article. - Molecular signatures that are distinctive characteristics of the vertebrates and chordates and supporting a grouping of vertebrates with the tunicates.
Gupta RS. Gupta RS. Mol Phylogenet Evol. 2016 Jan;94(Pt A):383-91. doi: 10.1016/j.ympev.2015.09.019. Epub 2015 Sep 28. Mol Phylogenet Evol. 2016. PMID: 26419477 - In Amphioxus Embryos, Some Neural Tube Cells Resemble Differentiating Coronet Cells of Fishes and Tunicates.
Holland ND, Mansfield JH. Holland ND, et al. Biol Bull. 2023 Feb;244(1):1-8. doi: 10.1086/724581. Epub 2023 Mar 8. Biol Bull. 2023. PMID: 37167617
Cited by
- Cellular Biogenetic Law and Its Distortion by Protein Interactions: A Possible Unified Framework for Cancer Biology and Regenerative Medicine.
Vinogradov AE, Anatskaya OV. Vinogradov AE, et al. Int J Mol Sci. 2022 Sep 29;23(19):11486. doi: 10.3390/ijms231911486. Int J Mol Sci. 2022. PMID: 36232785 Free PMC article. - The Orphan Cytokine Receptor CRLF3 Emerged With the Origin of the Nervous System and Is a Neuroprotective Erythropoietin Receptor in Locusts.
Hahn N, Büschgens L, Schwedhelm-Domeyer N, Bank S, Geurten BRH, Neugebauer P, Massih B, Göpfert MC, Heinrich R. Hahn N, et al. Front Mol Neurosci. 2019 Oct 11;12:251. doi: 10.3389/fnmol.2019.00251. eCollection 2019. Front Mol Neurosci. 2019. PMID: 31680856 Free PMC article. - Diversification and Functional Evolution of HOX Proteins.
Singh NP, Krumlauf R. Singh NP, et al. Front Cell Dev Biol. 2022 May 13;10:798812. doi: 10.3389/fcell.2022.798812. eCollection 2022. Front Cell Dev Biol. 2022. PMID: 35646905 Free PMC article. Review. - Measuring potential effects of the developmental burden associated with the vertebrate notochord.
Fujimoto S, Yamanaka K, Tanegashima C, Nishimura O, Kuraku S, Kuratani S, Irie N. Fujimoto S, et al. J Exp Zool B Mol Dev Evol. 2022 Jan;338(1-2):129-136. doi: 10.1002/jez.b.23032. Epub 2021 Mar 10. J Exp Zool B Mol Dev Evol. 2022. PMID: 33689235 Free PMC article. - Derivedness Index for Estimating Degree of Phenotypic Evolution of Embryos: A Study of Comparative Transcriptomic Analyses of Chordates and Echinoderms.
Leong JCK, Li Y, Uesaka M, Uchida Y, Omori A, Hao M, Wan W, Dong Y, Ren Y, Zhang S, Zeng T, Wang F, Chen L, Wessel G, Livingston BT, Bradham C, Wang W, Irie N. Leong JCK, et al. Front Cell Dev Biol. 2021 Nov 26;9:749963. doi: 10.3389/fcell.2021.749963. eCollection 2021. Front Cell Dev Biol. 2021. PMID: 34900995 Free PMC article.
References
- Gee H. Across the bridge: understanding the origin of the vertebrates. Chicago: The University of Chicago Press; 2018.
- Aristotle: ‘Historia Animalium’ . Volume 1, Books I-X: Text (Cambridge Classical Texts and Commentaries) 2011.
- Balfour FM. A treatise on comparative embryology. London: Macmillan; 1880. p. 1881.
- Yarrell WA. History of British fishes. Vol. 1 and Suppl. London: John Van Voorst; 1836.
- Huxley TH. Observations upon the anatomy and physiology of Salpa and Pyrosoma. Philos Trans R Soc. 1851;part ii:567-594.
Publication types
LinkOut - more resources
Full Text Sources
Miscellaneous
