Metabolic rewiring of macrophages by CpG potentiates clearance of cancer cells and overcomes tumor-expressed CD47-mediated 'don't-eat-me' signal - PubMed (original) (raw)
Metabolic rewiring of macrophages by CpG potentiates clearance of cancer cells and overcomes tumor-expressed CD47-mediated 'don't-eat-me' signal
Mingen Liu et al. Nat Immunol. 2019.
Abstract
Macrophages enforce antitumor immunity by engulfing and killing tumor cells. Although these functions are determined by a balance of stimulatory and inhibitory signals, the role of macrophage metabolism is unknown. Here, we study the capacity of macrophages to circumvent inhibitory activity mediated by CD47 on cancer cells. We show that stimulation with a CpG oligodeoxynucleotide, a Toll-like receptor 9 agonist, evokes changes in the central carbon metabolism of macrophages that enable antitumor activity, including engulfment of CD47+ cancer cells. CpG activation engenders a metabolic state that requires fatty acid oxidation and shunting of tricarboxylic acid cycle intermediates for de novo lipid biosynthesis. This integration of metabolic inputs is underpinned by carnitine palmitoyltransferase 1A and adenosine tri-phosphate citrate lyase, which, together, impart macrophages with antitumor potential capable of overcoming inhibitory CD47 on cancer cells. Our findings identify central carbon metabolism to be a novel determinant and potential therapeutic target for stimulating antitumor activity by macrophages.
Conflict of interest statement
Competing interests
The authors declare no competing interests
Figures
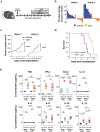
Figure 1. Macrophage activation via TLR agonists, but not disruption of CD47, induces anti-tumor activity in a model of pancreatic cancer.
(a) Syngeneic mice with established PDAC tumors were treated with 50 μg isotype or anti-CD47 Ig on days 10 and 14 after tumor implantation (_n_=8). Arrows indicate intratumoral delivery of antibody; shown is mean ± standard error. (b) Syngeneic mice were challenged with PDAC tumors in which CD47 was knocked out (_Cd47_–/–) versus control (CTRL) using CRISPR-Cas9 gene editing (_n_=5); shown is mean ± s.e.m. (c) In vitro phagocytosis of PDAC cells by BMDMs in the presence of isotype control or anti-CD47 Ig. (d) In vitro phagocytosis of PDAC cells by BMDMs stimulated with indicated TLR agonists for 24 hours. (e) Representative immunofluorescence images showing phagocytosis of PDAC cells (green) by macrophages (BMDM, red) pretreated with vehicle (mock) or CpG for 24 hours. Arrows indicate phagocytic events. Scale bar, 100μm. (f) In vitro phagocytosis of PDAC cells by BMDMs stimulated with CpG for increasing lengths of time (_n_=3), error bars represent standard error. (g) PDAC cell survival following 48-hour co-culture with macrophages pretreated with vehicle (Mock) or CpG for 96 hours (_n_=3), mean ± s.e.m. Boxplots (c, d) represent mean ± s.d. Statistical significance determined using two-tailed Student’s _t_-test with Hochberg correction: ns (not significant). Results are representative of at least two independent experiments (a-g). *, p<0.05; **, p<0.01; ***,p<0.001.
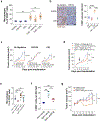
Figure 2. CpG induces anti-tumor activity in vivo.
(a) Schematic showing implantation of PDAC tumor cells (day 0) and subsequent treatment schedule (beginning on day 8) for CpG and methods of macrophage depletion using clodronate encapsulated liposomes (CEL) and a CSF1R-inhibitor (CSF1Ri). (b) Two distinct syngeneic KPC-derived PDAC tumors (PDAC.1 and PDAC.2) were treated with vehicle or CpG beginning on day 10. Waterfall plots show percent change in tumor volume at day 14 relative to baseline prior to treatment (day 10). (c) Longitudinal growth curves shown as mean ± s.e.m. for PDAC tumors treated with vehicle or CpG (_n_=6–8); (d) Kaplan-Meier curve showing survival of tumor bearing mice (_n_=10) treated with vehicle of CpG (_p_=5.3×10⁻⁵). Treatment was initiated beginning on day 10. Significance was determined using log-rank analysis. (e) Syngeneic mice bearing PDAC.1 control (CTRL) or PDAC.1 _Cd47_–/– tumors were treated with vehicle or CpG beginning on day 10 after tumor implantation. Shown are box plots displaying mean ± s.d. of cytokine concentration detected in peripheral blood on day 14. Significance determined using two-tailed Student’s _t_-test with Hochberg correction: ns (not significant). Results are representative of at least two independent experiments (b-e). *, p<0.05; ****, p<0.0001.
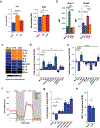
Figure 3. CpG induced anti-tumor activity requires macrophages.
(a) Shown is frequency of CD11b+ F4/80+ macrophages among total CD45+ cells detected by flow cytometry in PDAC tumors at day 18, in mice treated with CpG, CSF1Ri, or CEL. (b) Representative images (left) and quantification (right) of F4/80+ macrophages detected in PDAC tumors by immunohistochemistry after treatment with vehicle or CpG with or without CSF1Ri. (c) Longitudinal growth curves of PDAC.1 tumors treated with CpG and vehicle (no depletion), CSF1Ri, or clodronate encapsulated liposomes (CEL); Arrows indicate the initiation of CpG treatment. (d) Longitudinal growth curves of PDAC.1 tumors in mice treated as indicated. (e) Frequency of F4/80+ CD11b+ macrophages among total CD45+ cells detected by flow cytometry in PDAC tumors at day 18 in mice treated as indicated. (f) Quantification by immunohistochemistry of F4/80+ cells in tumors of mice on day 18 after treatment as indicated. Representative of one experiment. (g) Longitudinal growth curves of PDAC.1 tumors in mice treated with vehicle, CpG, or CpG + anti-Ly6C antibody (Monts1). Boxplots (e, f) represent mean ± s.d. Growth curves (c, d, g) show mean ± s.e.m. Significance determined using two-tailed Student’s _t_-test with Hochberg correction: ns (not significant). Results are representative of at least two independent experiments (a-c, g). *, p<0.05; **, p<0.01; ****, p<0.0001.
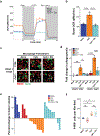
Figure 4. CpG stimulates macrophage anti-tumor activity in vitro and in vivo that is independent of the anti-phagocytic signal CD47 expressed on PDAC cells.
(a) Representative histogram plots of SIRPα expression (top) and normalized SIRPα expression (bottom) detected by flow cytometry on BMDMs after activation with CpG for 24–96 hours (_n_=3). (b) Vehicle (mock) versus CpG stimulated macrophage phagocytosis of PDAC cells in which CD47 was knocked out (_Cd47_–/–) using CRISPR-Cas9 gene editing versus control (CTRL) (_n_=3). (c) In vitro phagocytosis of the indicated syngeneic CD47+ murine tumor cell lines treated with isotype or anti-CD47 antibody, and co-cultured with BMDMs stimulated with vehicle of CpG (_n_=3). (d) Survival of PDAC.1 CTRL and _Cd47_–/–cells following 48-hour co-culture with vehicle (mock) or CpG activated macrophages pretreated for 72 hours, using the indicated effector (macrophage) to target (tumor) ratios (n=3). (e) Coxcomb plots showing distribution and fold change in leukocyte subsets (as a percentage of CD45+ cells on day 18), for CpG treatment relative to vehicle treatment in control (left) and _Cd47_–/– (right) PDAC tumors. Radial axis represents relative fold change in leukocyte subset percentage (n=5–8). (f) Percentage of CD11b+ F4/80+ macrophages in control and _Cd47_–/–tumors following CpG treatment. Boxplot represents mean ± s.d. (g) Tumor volume of control and _Cd47_–/– tumors treated with CpG (_n_=5–8); arrow indicates initiation of CpG; Box plots (f) show mean + s.d. Plots in b-d and g show mean + s.e.m. Two-tailed Student’s _t_-test with Hochberg correction: ns (not significant). Results are representative of at least two independent experiments (a-g). *, p<0.05; **, p<0.01; ***, p<0.001; ****, p<0.0001.
Figure 5. CpG evokes metabolic changes in macrophages without polarization to M1 or M2.
(a) Normalized mean fluorescence intensity of iNOS (left) and Arg1 (right) in mock, M1 or M2 as indicated, and CpG-activated BMDMs (_n_=3). (b) Mean fluorescence intensity for BMDMs pretreated with vehicle (mock) or CpG for 96 hours, compared with M1 and M2 BMDMs (_n_=3). (c) Heatmap of cytokine concentrations produced in vitro by BMDMs treated with vehicle (mock), LPS, or CpG for 48 hours (n=3), scaled to Log10(Concentration in pg/ml). (d) Extracellular acidification rate (ECAR) of BMDMs after 24-hour activation with indicated TLR agonists (_n_=8), relative to mock-treated baseline. (e) Basal oxygen consumption rate (OCR) of BMDMs after 24-hour activation with indicated TLR agonists (_n_=8), relative to mock-treated baseline. (f) Profile of OCR in BMDMs pretreated for 24 hours with vehicle (mock) or CpG, in comparison to M1 and M2 BMDMs (_n_=8). OCR was measured as picomoles of O2 per minute upon sequential administration with oligomycin, FCCP, and Rotenone + Antimycin A. (g) Basal OCR of BMDMs following activation with CpG for increasing durations (_n_=8), relative to mock-treated baseline. (h) Spare respiratory capacity of BMDMs treated with vehicle (mock) or CpG for 96 hours (_n_=8), shown as the difference between basal OCR and maximal OCR (after addition of FCCP). Significance determined using two-tailed Student’s _t-_test with Hochberg correction: ns (not significant). Plots (a-b, d, f-h) show mean ± s.d. Plots (e) show mean ± s.e.m. Results are representative of at least two independent experiments (a-h). *, p<0.05; ****, p<0.0001.
Figure 6. Fatty acid oxidation induced by CpG is essential for macrophage anti-tumor activity.
(a) Profile of oxygen consumption rate (OCR) in BMDMs treated with vehicle (mock), CpG, or CpG + etomoxir for 96 hours (n=8). Shown is OCR measured as picomoles of O2 per minute upon sequential administration with oligomycin, FCCP, and Rotenone + Antimycin A. (b) Basal OCR of BMDMs treated with vehicle (mock), CpG, and CpG + etomoxir for 96 hours (_n_=8). (c) Representative immunofluorescence images showing phagocytosis of PDAC.1 control (CTRL) or _Cd47_–/– cells (green) after co-culture with macrophages (BMDM, red) pretreated with vehicle (mock), CpG, or CpG + etomoxir for 96 hours. Arrows indicate phagocytic events. Scale bar, 100μm. (d) In vitro phagocytosis of PDAC.1 CTRL or _Cd47_–/– cells following co-culture with BMDMs pretreated with vehicle (mock), CpG, or CpG + etomoxir for 96 hours. (e) Treatment of PDAC.1 CTRL tumors with vehicle, etomoxir, CpG, or CpG + etomoxir beginning on day 10 after tumor implantation. Waterfall plot shows percent change in tumor volume at day 14 relative to baseline prior to CpG-treatment (day 10). (f) Quantification by immunohistochemistry of F4/80+ macrophages in PDAC tumors (_n_=4) on day 14, following treatment with vehicle (mock), etomoxir, CpG, or CpG + etomoxir. Two-tailed Student’s _t-_test with Hochberg correction: ns (not significant). Boxplots represent mean ± s.d. Plots (a-b, d) show mean ± s.e.m. Results are representative of at least two independent experiments (a-f). *, p<0.05; **, p<0.01; ****, p<0.0001.
Figure 7. Metabolic rewiring of TCA cycle supports the oxidative phenotype and anti-tumor activity of CpG-activated macrophages.
BMDMs were pretreated with CpG or vehicle for 96 hours, plated, and then labeled (i) with the addition of 100 μM 13C-palmitate for 4 hours (n=3) (a,b) or (ii) in the presence of 25 mM 13C-glucose or 4 mM 13C-glutamine for 2 hours (_n_=3) (c-e). (a) Percent isotopologue enrichment of acetyl-CoA with addition of 13C-palmitate. (b) Percent isotopologue enrichment of succinyl-CoA with addition of 13C-palmitate. (c) Relative total pool size of HMG-CoA, succinyl-CoA, and acetyl-CoA after labeling with tracers (13C-glucose or 13C-glutamine). (d) Percent isotopologue enrichment of acetyl-CoA from 13C-glucose and 13C-glutamine. (e) Percent isotopologue enrichment of succinyl-CoA from 13C-glucose and 13C-glutamine. (f) Basal oxygen consumption of BMDMs pretreated as indicated (_n_=8). (g) In vitro phagocytosis of PDAC.1 CTRL or _Cd47_–/– cells by BMDMs pretreated as indicated (_n_=3). Two-tailed Student’s _t-_test with Hochberg correction: ns (not significant). Plots (a-g) show mean ± s.d. Results are representative of at least two independent experiments (f,g). **, p<0.01; ***, p<0.001; ****, p<0.0001.
Similar articles
- Restoration of miR-340 controls pancreatic cancer cell CD47 expression to promote macrophage phagocytosis and enhance antitumor immunity.
Xi Q, Zhang J, Yang G, Zhang L, Chen Y, Wang C, Zhang Z, Guo X, Zhao J, Xue Z, Li Y, Zhang Q, Da Y, Liu L, Yao Z, Zhang R. Xi Q, et al. J Immunother Cancer. 2020 Jun;8(1):e000253. doi: 10.1136/jitc-2019-000253. J Immunother Cancer. 2020. PMID: 32503944 Free PMC article. - Targeting CD47 in Anaplastic Thyroid Carcinoma Enhances Tumor Phagocytosis by Macrophages and Is a Promising Therapeutic Strategy.
Schürch CM, Roelli MA, Forster S, Wasmer MH, Brühl F, Maire RS, Di Pancrazio S, Ruepp MD, Giger R, Perren A, Schmitt AM, Krebs P, Charles RP, Dettmer MS. Schürch CM, et al. Thyroid. 2019 Jul;29(7):979-992. doi: 10.1089/thy.2018.0555. Epub 2019 May 10. Thyroid. 2019. PMID: 30938231 Free PMC article. - USP2 inhibition unleashes CD47-restrained phagocytosis and enhances anti-tumor immunity.
Dai P, Sun Y, Huang Z, Liu YT, Gao M, Liu HM, Shi J, He C, Xiang B, Yao Y, Yu H, Xu G, Kong L, Xiao X, Wang X, Zhang X, Xiong W, Hu J, Lin D, Zhong B, Chen G, Gong Y, Xie C, Zhang J. Dai P, et al. Nat Commun. 2025 May 16;16(1):4564. doi: 10.1038/s41467-025-59621-5. Nat Commun. 2025. PMID: 40379682 Free PMC article. - Cancer immunotherapy targeting the CD47/SIRPα axis.
Weiskopf K. Weiskopf K. Eur J Cancer. 2017 May;76:100-109. doi: 10.1016/j.ejca.2017.02.013. Epub 2017 Mar 10. Eur J Cancer. 2017. PMID: 28286286 Review. - The CD47-SIRPα signaling axis as an innate immune checkpoint in cancer.
Matlung HL, Szilagyi K, Barclay NA, van den Berg TK. Matlung HL, et al. Immunol Rev. 2017 Mar;276(1):145-164. doi: 10.1111/imr.12527. Immunol Rev. 2017. PMID: 28258703 Review.
Cited by
- Enzalutamide, an Androgen Receptor Antagonist, Enhances Myeloid Cell-Mediated Immune Suppression and Tumor Progression.
Consiglio CR, Udartseva O, Ramsey KD, Bush C, Gollnick SO. Consiglio CR, et al. Cancer Immunol Res. 2020 Sep;8(9):1215-1227. doi: 10.1158/2326-6066.CIR-19-0371. Epub 2020 Jul 13. Cancer Immunol Res. 2020. PMID: 32661092 Free PMC article. - From monocyte-derived macrophages to resident macrophages-how metabolism leads their way in cancer.
Ammarah U, Pereira-Nunes A, Delfini M, Mazzone M. Ammarah U, et al. Mol Oncol. 2024 Jul;18(7):1739-1758. doi: 10.1002/1878-0261.13618. Epub 2024 Feb 27. Mol Oncol. 2024. PMID: 38411356 Free PMC article. Review. - Exploration of the Long Noncoding RNAs Involved in the Crosstalk between M2 Macrophages and Tumor Metabolism in Lung Cancer.
Fang F, Yao Y, Ma Z. Fang F, et al. Genet Res (Camb). 2023 Jan 25;2023:4512820. doi: 10.1155/2023/4512820. eCollection 2023. Genet Res (Camb). 2023. PMID: 36741921 Free PMC article. - Metabolism in tumor-associated macrophages.
Li J, DeNicola GM, Ruffell B. Li J, et al. Int Rev Cell Mol Biol. 2022;367:65-100. doi: 10.1016/bs.ircmb.2022.01.004. Epub 2022 Feb 21. Int Rev Cell Mol Biol. 2022. PMID: 35461660 Free PMC article. - Kupffer cells prevent pancreatic ductal adenocarcinoma metastasis to the liver in mice.
Thomas SK, Wattenberg MM, Choi-Bose S, Uhlik M, Harrison B, Coho H, Cassella CR, Stone ML, Patel D, Markowitz K, Delman D, Chisamore M, Drees J, Bose N, Beatty GL. Thomas SK, et al. Nat Commun. 2023 Oct 10;14(1):6330. doi: 10.1038/s41467-023-41771-z. Nat Commun. 2023. PMID: 37816712 Free PMC article.
References
- Biswas SK & Mantovani A Orchestration of metabolism by macrophages. Cell Metab 15, 432–437 (2012). - PubMed
Publication types
MeSH terms
Substances
Grants and funding
- R01 CA226983/CA/NCI NIH HHS/United States
- F30 CA196124/CA/NCI NIH HHS/United States
- P30 DK050306/DK/NIDDK NIH HHS/United States
- R01 CA197916/CA/NCI NIH HHS/United States
- R03 HD092630/HD/NICHD NIH HHS/United States
- K22 ES026235/ES/NIEHS NIH HHS/United States
LinkOut - more resources
Full Text Sources
Other Literature Sources
Molecular Biology Databases
Research Materials


