Unexpected Receptor Functional Mimicry Elucidates Activation of Coronavirus Fusion - PubMed (original) (raw)
. 2019 Feb 21;176(5):1026-1039.e15.
doi: 10.1016/j.cell.2018.12.028. Epub 2019 Jan 31.
Xiaoli Xiong 1, Young-Jun Park 1, M Alejandra Tortorici 2, Joost Snijder 1, Joel Quispe 1, Elisabetta Cameroni 3, Robin Gopal 4, Mian Dai 5, Antonio Lanzavecchia 6, Maria Zambon 4, Félix A Rey 7, Davide Corti 3, David Veesler 8
Affiliations
- PMID: 30712865
- PMCID: PMC6751136
- DOI: 10.1016/j.cell.2018.12.028
Unexpected Receptor Functional Mimicry Elucidates Activation of Coronavirus Fusion
Alexandra C Walls et al. Cell. 2019.
Erratum in
- Unexpected Receptor Functional Mimicry Elucidates Activation of Coronavirus Fusion.
Walls AC, Xiong X, Park YJ, Tortorici MA, Snijder J, Quispe J, Cameroni E, Gopal R, Dai M, Lanzavecchia A, Zambon M, Rey FA, Corti D, Veesler D. Walls AC, et al. Cell. 2020 Dec 10;183(6):1732. doi: 10.1016/j.cell.2020.11.031. Cell. 2020. PMID: 33306956 Free PMC article. No abstract available.
Abstract
Recent outbreaks of severe acute respiratory syndrome and Middle East respiratory syndrome, along with the threat of a future coronavirus-mediated pandemic, underscore the importance of finding ways to combat these viruses. The trimeric spike transmembrane glycoprotein S mediates entry into host cells and is the major target of neutralizing antibodies. To understand the humoral immune response elicited upon natural infections with coronaviruses, we structurally characterized the SARS-CoV and MERS-CoV S glycoproteins in complex with neutralizing antibodies isolated from human survivors. Although the two antibodies studied blocked attachment to the host cell receptor, only the anti-SARS-CoV S antibody triggered fusogenic conformational changes via receptor functional mimicry. These results provide a structural framework for understanding coronavirus neutralization by human antibodies and shed light on activation of coronavirus membrane fusion, which takes place through a receptor-driven ratcheting mechanism.
Keywords: MERS-CoV; N-linked glycosylation; SARS-CoV; class I fusion protein; coronavirus; glycoproteomics; membrane fusion; neutralizing antibodies; spike glycoprotein.
Copyright © 2018 Elsevier Inc. All rights reserved.
Conflict of interest statement
A.L. is the scientific founder and shareholder of Humabs BioMed. D.C. is currently Chief Scientific Officer of Humabs Biomed. The other authors declare no competing financial interests.
Figures
Graphical abstract
Figure S1
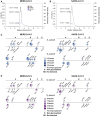
Characterization of the Fine Molecular Structure of the MERS-CoV and SARS-CoV S Glycan Shields, Related to Figure 1 (A-B) Quantification of the molecular weight fraction contributed by the N-linked carbohydrates decorating the MERS-CoV (A) and SARS-CoV (B) S glycoproteins expressed using HEK293F cells. Molecular weight estimates were determined using size-exclusion chromatography coupled with multi-angle light scattering, refractometry and UV spectrophotometry(Veesler et al., 2009). (C-D) LC-MS/MS analysis of the fucosylation (C) and sialylation (D) content of the MERS-CoV S 2P and SARS-CoV S 2P ectodomain glycans (in-solution digests). Each N-linked glycosylation site is represented by a pie chart colored according to the number of fucose or sialic acid moieties detected and for which the diameter is scaled based on the number of unique glycopeptides identified. NeuAc: N-acetyl-neuraminic acid.
Figure 1
Characterization of the S Glycan Shield of MERS-CoV and SARS-CoV S Glycoproteins (A and B) Analysis of the glycans N-linked to MERS-CoV S 2P (A) and SARS-CoV S 2P (B) ectodomain trimers expressed using HEK293F cells. Each site is represented by a pie chart colored according to the processing state detected by LC-MS/MS and for which the diameter is scaled based on the number of unique glycopeptides identified. Glycan assignment was performed as follows: high-mannose, 2 HexNAc; hybrid, 3 HexNAc; complex, ≥4 HexNAc; GlcNAc, N-acetyl glucosamine (detected for endo-H-treated samples). (C and D) Surface representation of the fully glycosylated MERS-CoV S 2P (C) and SARS-CoV S 2P (D) ectodomain trimers (gray) with N-linked glycans rendered as spheres colored according to the processing state (i.e., corresponding to the largest number of unique N-linked glycans identified by LC-MS/MS, as in A and B). Domains A–D are labeled in (A) and (B). (C) and (D) were generated using the MERS-CoV S2P/LCA60 and SARS-CoV S2P/S230 structures for which the Fabs were removed for clarity. See also Figures S1 and S2 and Tables S1, S2, and S3.
Figure S2
Comparison of Glycans N-Linked to Full-Length MERS-CoV S Incorporated in Authentic Virions and to a Purified Ectodomain. Related to Figure 1 (A-B) LC-MS/MS analysis of S oligosaccharides from MERS-CoV England1 and EMC/2012 virions as well as MERS-CoV S 2P ectodomain trimer (in-gel digests). Colored dots represent individual technical replicate values and histograms represent the experimental mean signal of the relative integrated MS1 peak areas for each glycopeptide upon trypsin (A) or chymotrypsin digestion (B). NeuAc: N-acetyl-neuraminic acid, NeuGc: N-glycolyl-neuraminic acid.
Figure 2
CryoEM Structures of the MERS-CoV S Glycoprotein in Complex with the LCA60 Neutralizing Antibody (A and B) Orthogonal views of the state 1 structure with one open and two closed B domains. (C and D) Orthogonal views of the state 2 structure with two open and one closed B domains. The structures are rendered as molecular surfaces with different colors for each S protomer (light blue, plum, and gold) and the LCA60 Fab heavy (purple) and light (pink) chains (only the variable domains are shown). The open B domains/Fabs are only included for visualization and were omitted from the final models. See also Figures S3 and S4 and Tables S4 and S5.
Figure S3
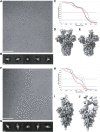
CryoEM Characterization of the MERS-CoV S Glycoprotein in Complex with the LCA60 Fab Fragment (A-E) and the SARS-CoV S Glycoprotein in Complex with the S230 Fab Fragment (F-J), Related to Figures 2, 3, and 4 (A) Representative micrograph. Scale bar is 100 nm. (B) Reference-free 2D class averages. Scale bar is 100 Å. (C) Gold standard (solid lines) and map/model (dotted lines) Fourier shell correlation curves for the state 1 (blue lines) or state 2 (red lines) reconstructions. (D-E) Reconstructions for state 1 (D) and state 2 (E). (F) Representative micrograph. Scale bar is 100 nm. (G) Reference-free 2D class averages. Scale bar is 100 Å. (H) Gold standard (solid lines) and map/model (dotted lines) Fourier shell correlation curves for the state 1 (blue lines) or state 2 (red lines) reconstructions. (I-J) Reconstructions for state 1 (I) and state 2 (J).
Figure 3
LCA60 Interactions with the MERS-CoV S Receptor-Binding Domain (A and B) Quasi-orthogonal views of the LCA60 Fab binding to a closed B domain. The A domain from a neighboring protomer is also shown. (C) Zoomed-in view of the LCA60 CDRH3-mediated contacts. Residues involved in key interactions are shown in ball-and-stick representation colored by atom type (blue: nitrogen, red: oxygen, gray: carbon). (D) LCA60 Fabs bound to closed B domains in the state 1 structure. The glycan N-linked to N487 of one closed B domain interact with the LCA60 Fab bound to the neighboring closed B domain. (E and F) LCA60 (E) and DPP4 (F) would clash upon binding to MERS-CoV S and share partially overlapping epitopes on the B domain. In (A), (B), (D), and (F), S is rendered as molecular surfaces, the Fabs as ribbon diagrams (only the variable domains are shown), and the glycans as blue spheres. In (C), S is rendered as a ribbon diagram. The color scheme is identical to Figure 2. Selected glycans are labeled based on the N-linked glycosylation sequon numbering. See also Figures S3 and S4 and Tables S4 and S5.
Figure S4
LCA60 Interactions with MERS-CoV S Involve N-Linked Glycans, Related to Figures 2 and 3 (A-B) Ribbon diagrams of LCA60 binding to a closed B domain. The A domain from a neighboring protomer is also shown. LCA60 residues interacting or putatively interacting with the glycans at positions N236 and N166 are shown in ball and stick representation (blue: nitrogen, red: oxygen, gray: carbon). LCA60 atoms are colored identically except for carbon atoms that are pink/purple. The color scheme is identical to Figure 2. Selected glycans are labeled based on the N-linked glycosylation sequon numbering. Only the LCA60 variable domains are shown. The cryoEM density corresponding to glycans at positions N166 and N236 is shown as a transparent blue surface.
Figure 4
CryoEM Structure of the SARS-CoV S Glycoprotein in Complex with the S230 Neutralizing Antibody (A and B) Orthogonal views of the state 1 structure with one open, one partially open, and one closed B domain. (C and D) Orthogonal views of the state 2 structure with three open B domains that do not follow 3-fold symmetry. The structures are rendered as molecular surfaces with different colors for each S protomer (light blue, plum, and gold) and the LCA60 Fab heavy (purple) and light (pink) chains (only the variable domains are shown). See also Figure S3 and Tables S4 and S5.
Figure 5
S230 Interactions with the SARS-CoV S Receptor-Binding Domain (A and B) Two views of the S230 Fab binding to an open B domain. The A domain of the same protomer and B domain from a neighboring protomer are also shown. (C and D) S230 (C) and ACE2 (D) would clash upon binding to SARS-CoV S and share partially overlapping epitopes on the B domain. In (A)–(D), S is rendered as molecular surfaces, the Fab as ribbon diagrams (only the variable domains are shown), and the glycans as blue spheres. The color scheme is identical to Figure 4. Selected glycans are labeled based on the N-linked glycosylation sequon numbering. See also Figure S3 and Tables S4 and S5.
Figure S5
SDS-PAGE Analysis of SARS-CoV S Cleavage by Trypsin, under Limited-Proteolysis Conditions, in the Presence and Absence of S230 or ACE2, Related to Figure 6 (A-C) Wild-type SARS-CoV S ectodomain trimer at 7.5 μM (protomer concentration) was cleaved with 1.6 μg/mL of trypsin either directly (A), or after incubation with an equimolar concentration of Fab S230 for 30 min (B) or 30 hr (C). (D-F) Wild-type SARS-CoV S ectodomain trimer at 7.5 μM (protomer concentration) was cleaved with 1.6 μg/mL of trypsin after incubation with an equimolar concentration of the ACE2 ectodomain for 30 min (D) or 30 hr (E) or after incubation with 30 μM of the ACE2 ectodomain for 30 hr (F). Boil indicates that the sample was boiled for one minute in SDS-PAGE loading buffer prior to migration.
Figure 6
S230- or ACE2-Mediated Refolding of SARS-CoV S Visualized by Negative Staining EM (A–J) The effect of Fab S230 (C–F) or of the ACE2 ectodomain (G–J) on the conformational state of the wild-type SARS-CoV S ectodomain trimer was analyzed using single-particle EM of negatively stained samples. Estimates of the fraction of particles corresponding to each state are represented as pie charts based on the number of particle images clustered in each group after reference-free 2D classification. Only pre-fusion and postfusion conformations were included in the calculations, and the results are rendered using bins with a minimal width of 5%. 1.6 μg/mL trypsin was used for (B), (D), (F), (H), and (J). Time points shown at 30 min (C–D and G–H) or 30 h (E, F, I, and J). Representative 2D class averages corresponding to the different states discussed are shown at the bottom. See also Figure S5, Figure S6, Figure S7.
Figure S6
Effect of S230 or ACE2 on Fusogenic Conformational Changes of Pre-cleaved SARS-CoV S, Related to Figure 6 The effect of Fab S230 (A-B) or of the ACE2 ectodomain (C-D) on the conformational state of the wild-type SARS-CoV S ectodomain trimer was analyzed using single-particle electron microscopy of negatively stained samples. (A-D) Estimates of the fraction of particles corresponding to each state are represented as pie charts based on the number of particle images clustered in each group after reference-free 2D classification. Only prefusion and postfusion conformations were included in the calculations and the results are rendered using bins with a minimal width of 5%.
Figure 7
ACE2 or S230-Mediated Refolding of the Full-Length Membrane-Embedded SARS-CoV S Trimer Visualized by Western Blotting (A and B) The effect of 0.5 μM S230 Fab (A) or of 10 μM ACE2 ectodomain (B) on the conformational state of the full-length SARS-CoV S trimer embedded in the membrane of infectious MLV pseudovirus was probed by western blotting using an anti-SARS-CoV S2 polyclonal antibody. Refolding to the postfusion conformation was detected by the appearance of a proteinase-K-resistant band migrating at approximately 55 kDa (Matsuyama and Taguchi, 2009). Trypsin was used at 5 μg/mL and proteinase K at 10μg/mL. Digestion experiments and western blots were performed in triplicates, and a representative result is shown for each of them.
Figure S7
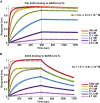
Biolayer Interferometry Analysis of S230 and ACE2 Binding to the SARS-CoV S1 Subunit, Related to Figure 6 The SARS-CoV S1 subunit was immobilized using amine coupling on ARG2 biosensors and binding of the S230 Fab (A) or the ACE2 ectodomain (B) at multiple concentrations were monitored. Equilibrium constants of dissociation and estimated errors using a global fit are indicated. The concentrations of S230 Fab or ACE2 ectodomain injected are indicated on each panel. Global fit curves are shown as black dotted lines. The vertical dashed lines indicate the transition between association and dissociation phases.
Similar articles
- Structural definition of a neutralization epitope on the N-terminal domain of MERS-CoV spike glycoprotein.
Zhou H, Chen Y, Zhang S, Niu P, Qin K, Jia W, Huang B, Zhang S, Lan J, Zhang L, Tan W, Wang X. Zhou H, et al. Nat Commun. 2019 Jul 11;10(1):3068. doi: 10.1038/s41467-019-10897-4. Nat Commun. 2019. PMID: 31296843 Free PMC article. - Cross-neutralization of SARS-CoV-2 by a human monoclonal SARS-CoV antibody.
Pinto D, Park YJ, Beltramello M, Walls AC, Tortorici MA, Bianchi S, Jaconi S, Culap K, Zatta F, De Marco A, Peter A, Guarino B, Spreafico R, Cameroni E, Case JB, Chen RE, Havenar-Daughton C, Snell G, Telenti A, Virgin HW, Lanzavecchia A, Diamond MS, Fink K, Veesler D, Corti D. Pinto D, et al. Nature. 2020 Jul;583(7815):290-295. doi: 10.1038/s41586-020-2349-y. Epub 2020 May 18. Nature. 2020. PMID: 32422645 - Molecular Mechanism for Antibody-Dependent Enhancement of Coronavirus Entry.
Wan Y, Shang J, Sun S, Tai W, Chen J, Geng Q, He L, Chen Y, Wu J, Shi Z, Zhou Y, Du L, Li F. Wan Y, et al. J Virol. 2020 Feb 14;94(5):e02015-19. doi: 10.1128/JVI.02015-19. Print 2020 Feb 14. J Virol. 2020. PMID: 31826992 Free PMC article. - Coronavirus Spike Protein and Tropism Changes.
Hulswit RJ, de Haan CA, Bosch BJ. Hulswit RJ, et al. Adv Virus Res. 2016;96:29-57. doi: 10.1016/bs.aivir.2016.08.004. Epub 2016 Sep 13. Adv Virus Res. 2016. PMID: 27712627 Free PMC article. Review. - MERS-CoV spike protein: Targets for vaccines and therapeutics.
Wang Q, Wong G, Lu G, Yan J, Gao GF. Wang Q, et al. Antiviral Res. 2016 Sep;133:165-77. doi: 10.1016/j.antiviral.2016.07.015. Epub 2016 Jul 26. Antiviral Res. 2016. PMID: 27468951 Free PMC article. Review.
Cited by
- COVID-19 and immunological regulations - from basic and translational aspects to clinical implications.
Schön MP, Berking C, Biedermann T, Buhl T, Erpenbeck L, Eyerich K, Eyerich S, Ghoreschi K, Goebeler M, Ludwig RJ, Schäkel K, Schilling B, Schlapbach C, Stary G, von Stebut E, Steinbrink K. Schön MP, et al. J Dtsch Dermatol Ges. 2020 Aug;18(8):795-807. doi: 10.1111/ddg.14169. Epub 2020 Aug 6. J Dtsch Dermatol Ges. 2020. PMID: 32761894 Free PMC article. Review. - Structural basis for neutralization of SARS-CoV-2 and SARS-CoV by a potent therapeutic antibody.
Lv Z, Deng YQ, Ye Q, Cao L, Sun CY, Fan C, Huang W, Sun S, Sun Y, Zhu L, Chen Q, Wang N, Nie J, Cui Z, Zhu D, Shaw N, Li XF, Li Q, Xie L, Wang Y, Rao Z, Qin CF, Wang X. Lv Z, et al. Science. 2020 Sep 18;369(6510):1505-1509. doi: 10.1126/science.abc5881. Epub 2020 Jul 23. Science. 2020. PMID: 32703908 Free PMC article. - Human coronavirus HKU1 recognition of the TMPRSS2 host receptor.
McCallum M, Park YJ, Stewart C, Sprouse KR, Brown J, Tortorici MA, Gibson C, Wong E, Ieven M, Telenti A, Veesler D. McCallum M, et al. bioRxiv [Preprint]. 2024 Jan 9:2024.01.09.574565. doi: 10.1101/2024.01.09.574565. bioRxiv. 2024. PMID: 38260518 Free PMC article. Updated. Preprint. - Structural and Functional Analysis of the D614G SARS-CoV-2 Spike Protein Variant.
Yurkovetskiy L, Wang X, Pascal KE, Tomkins-Tinch C, Nyalile TP, Wang Y, Baum A, Diehl WE, Dauphin A, Carbone C, Veinotte K, Egri SB, Schaffner SF, Lemieux JE, Munro JB, Rafique A, Barve A, Sabeti PC, Kyratsous CA, Dudkina NV, Shen K, Luban J. Yurkovetskiy L, et al. Cell. 2020 Oct 29;183(3):739-751.e8. doi: 10.1016/j.cell.2020.09.032. Epub 2020 Sep 15. Cell. 2020. PMID: 32991842 Free PMC article. - De novo design and Rosetta-based assessment of high-affinity antibody variable regions (Fv) against the SARS-CoV-2 spike receptor binding domain (RBD).
Boorla VS, Chowdhury R, Ramasubramanian R, Ameglio B, Frick R, Gray JJ, Maranas CD. Boorla VS, et al. Proteins. 2023 Feb;91(2):196-208. doi: 10.1002/prot.26422. Epub 2022 Oct 8. Proteins. 2023. PMID: 36111441 Free PMC article.
References
- Agirre J., Iglesias-Fernández J., Rovira C., Davies C.J., Wilson K.S., Cowtan K.D. Privateer: software for the conformational validation of carbohydrate structures. Nat. Struct. Mol. Biol. 2015;22:833–834. - PubMed
- Blanc E., Roversi P., Vonrhein C., Flensburg C., Lea S.M., Bricogne G. Refinement of severely incomplete structures with maximum likelihood in BUSTER-TNT. Acta Crystallogr. D Biol. Crystallogr. 2004;60:2210–2221. - PubMed
Publication types
MeSH terms
Substances
Grants and funding
- HHSN272201700059C/AI/NIAID NIH HHS/United States
- R01 GM120553/GM/NIGMS NIH HHS/United States
- S10 OD021832/OD/NIH HHS/United States
- T32 GM008268/GM/NIGMS NIH HHS/United States
LinkOut - more resources
Full Text Sources
Other Literature Sources
Miscellaneous


