Neuronal SIRT1 Regulates Metabolic and Reproductive Function and the Response to Caloric Restriction - PubMed (original) (raw)
Neuronal SIRT1 Regulates Metabolic and Reproductive Function and the Response to Caloric Restriction
Emily Rickert et al. J Endocr Soc. 2018.
Abstract
Sirt1 is an NAD-dependent, class III deacetylase that functions as a cellular energy sensor. In addition to its well-characterized effects in peripheral tissues, emerging evidence suggests that neuronal Sirt1 activity plays a role in the central regulation of energy balance and glucose metabolism. In this study, we generated mice expressing an enzymatically inactive form (_N_-MUT) or wild-type (WT) SIRT1 (_N_-OX) in mature neurons. _N_-OX male and female mice had impaired glucose tolerance, and _N_-MUT female, but not male, mice had improved glucose tolerance compared with that of WT littermates. Furthermore, glucose tolerance was improved in all mice with caloric restriction (CR) but was greater in the _N_-OX mice, who had better glucose tolerance than their littermates. At the reproductive level, _N_-OX females had impaired estrous cycles, with increased cycle length and more time in estrus. LH and progesterone surges were absent on the evening of proestrus in the _N_-OX mice, suggesting a defect in spontaneous ovulation, which was confirmed by the ovarian histology revealing fewer corpora lutea. Despite this defect, the mice were still fertile when mated to WT mice on the day of proestrus, indicating that the mice could respond to normal pheromonal or environmental cues. When subjected to CR, the _N_-OX mice went into diestrus arrest earlier than their littermates. Together, these results suggested that the overexpression of SIRT1 rendered the mice more sensitive to the metabolic improvements and suppression of reproductive cycles by CR, which was independent of circadian rhythms.
Keywords: caloric restriction; fertility; glucose intolerance; neurons.
Figures
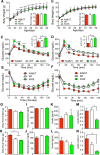
Figure 1.
Neuronal SIRT1 caused glucose intolerance in mice. Data for _N_-MUT mice are shown in red, in white for WT littermates, and green for _N_-OX mice in green. For (A–D), Two-way ANOVA indicated significant genotype and time effects (P < 0.0001) but no interaction. (A) Body weights for male mice from 3 to 13 wk of age (n = 13 for _N_-MUT; n = 48 for WT; n = 24 for _N_-OX). Inset shows final body weight at 8 to 9 mo. (B) Body weights for female mice from 3 to 13 wk of age (n = 10 for _N_-MUT; n = 44 for WT; n = 20 for _N_-OX). Inset shows final body weight at 8 to 9 mo. (C) Glucose tolerance testing in male mice at 3 mo of age (n = 8 for _N_-OX; n = 16 for WT; n = 4 for _N_-MUT). Two-way ANOVA indicated significant interaction effect (P = 0.005). Inset shows AUC data. (D) Glucose tolerance testing in female mice at 3 mo of age (n = 9 for _N_-OX; n = 16 for WT; n = 6 for _N_-MUT). Inset shows AUC data. (E) Insulin tolerance testing in male mice at 3 mo of age (n = 9 for _N_-OX; n = 16 for WT; n = 6 for _N_-MUT). (F) Insulin tolerance testing in female mice at 3 mo of age (n = 10 for _N_-OX; n = 16 for WT; n = 6 for _N_-MUT). (E, F) Two-way ANOVA indicated significant genotype and time effects (P < 0.001 and P < 0.0001, respectively) but no interaction. (G) Daily food intake over 10 wk for male mice (n = 3 for _N_-MUT; n = 12 for WT; n = 4 for _N_-OX). (H) Daily food intake over 10 wk for female mice (n = 6 for _N_-MUT; n = 11 for WT; n = 5 for _N_-OX). (I) Fasting blood glucose data of male mice (n = 17 for _N_-OX; n = 32 for WT; n = 8 for _N_-MUT). (J) Fasting blood glucose data of female mice (n = 20 for _N_-OX; n = 32 for WT; n = 4 for _N_-MUT). (K) Fasting insulin data of male mice (n = 6 for _N_-MUT; n = 14 for WT; n = 6 for _N_-OX). (L) Fasting insulin data of female mice (n = 6 for _N_-MUT; n = 12 for WT; n = 6 for _N_-OX). (M) Fasting leptin data of male mice (n = 6 for _N_-MUT; n = 14 for WT; n = 6 for _N_-OX). (N) Fasting leptin data of female mice (n = 6 for _N_-MUT; n = 12 for WT; n = 6 for _N_-OX). Data are reported as mean ± SEM. *P < 0.05, **P < 0.01, *P < 0.001, and ****P < 0.0001 vs WT or as indicated. AUC, area under the curve.
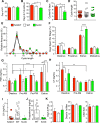
Figure 2.
Neuronal SIRT1 regulated reproduction in female mice. Data for _N_-MUT mice are shown in red, in white for WT littermates, and green for _N_-OX mice in green. (A) Day of vaginal opening (n = 8 for _N_-MUT; n = 40 for WT; n = 18 for _N_-OX). (B) Day of first estrous (n = 8 for _N_-MUT; n = 41 for WT; n = 21 for _N_-OX). (C) Number of estrous cycles by vaginal lavage over 6 wk (n = 6 for _N_-MUT; n = 11 for WT; n = 5 for _N_-OX). (D) Cycle length during the 6 wk (n = 44 for _N_-MUT; n = 74 for WT; n = 19 for _N_-OX). (E) Relative-frequency histogram of cycle lengths. (F) Percentage of d spent in each stage of the estrous cycle during the 6-wk cycling (n = 6 for _N_-MUT; n = 11 for WT; n = 5 for _N_-OX). Two-way ANOVA indicated significant stage effect (P < 0.0001) and significant interaction of stage and genotype (P < 0.0001). (G) FSH levels during diestrus, the morning of proestrus (Pro-AM), the afternoon of proestrus (Pro-PM), and the morning of estrus (n = 8 for _N_-MUT; n = 16 for WT; n = 8 for _N_-OX). Two-way ANOVA indicated significant stage effect (P = 0.015) and significant interaction of stage and genotype (P = 0.013). (H) LH levels during diestrus, the morning of proestrus, and the morning of estrus (n = 8 for _N_-MUT; n = 16 for WT; n = 8 for _N_-OX). Two-way ANOVA indicated significant stage effect (P = 0.013) but no interaction of stage and genotype. (I) LH levels during the afternoon of proestrus (n = 8 for _N_-MUT; n = 16 for WT; n = 8 for _N_-OX). Proestrus LH values did not follow a normal distribution, so _N_-OX mice had significantly lower LH levels than did WT mice by Kruskal-Wallis test (P = 0.033). (J) Progesterone levels during the afternoon of proestrus (n = 7 for WT; n = 7 for _N_-OX). (K) Days to plug, days to first litter, and litter size during fertility test (n = 3 for _N_-MUT; n = 11 for WT; n = 6 for _N_-OX). Data are reported as mean ± SEM. *P < 0.05, **P < 0.01, *P < 0.001, ****P < 0.0001 vs WT or as indicated.
Figure 3.
Overexpression of SIRT1 impaired ovulation. Data for _N_-MUT mice are shown in red, in white for WT littermates, and green for _N_-OX mice in green.. (A) Ovarian morphology. Representative hematoxylin- and eosin-stained sections of ovaries obtained at euthanasia. (B) Quantification of ovarian cross-sectional area for _N_-MUT (n = 12), WT (n = 15), and _N_-OX (n = 8) ovaries. *P < 0.05 vs _N_-MUT. (C) Quantification of follicle stage. Percentage of follicles at each stage for _N_-MUT (n = 6), WT (n = 9), and _N_-OX (n = 4) mice. (D) Quantification of CL for _N_-MUT (n = 6), WT (n = 9), and _N_-OX (n = 4) mice. *P < 0.05 vs WT. Data are reported as mean ± SEM. *Significant difference by post hoc testing.
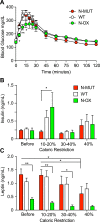
Figure 4.
Overexpression of SIRT1 enhanced the metabolic response to CR. Data for _N_-MUT mice are shown in red, in white for WT littermates, and green for _N_-OX mice in green. (A) Glucose tolerance test conducted after CR (n = 8 for _N_-OX; n = 17 for WT; n = 6 for _N_-MUT; n = 20 males; n = 11 females). Two-way ANOVA indicated a significant time effect (P < 0.0001) and time-genotype interaction (P = 0.0025). (B) Fasting insulin levels during CR (n = 14 for _N_-MUT; n = 26 for WT; n = 12 for _N_-OX; n = 28 males; n = 24 females). (C) Fasting leptin levels during CR (n = 14 for _N_-MUT; n = 26 for WT; n = 12 for _N_-OX; n = 28 males; n = 24 females). Two-way ANOVA indicated a significant genotype effect (P < 0.0001). Data are reported as mean ± SEM. *P < 0.05, **P < 0.01 among _N_-OX and WT and _N_-MUT, or as indicated, from post hoc testing. AF, antral follicle; CL, corpus luteum.
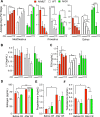
Figure 5.
Overexpression of SIRT1 enhanced the reproductive response to CR. Data for _N_-MUT mice are shown in red, in white for WT littermates, and green for _N_-OX mice in green. Estrous cycles were assessed by vaginal lavage in female mice during the 8 wk of CR. Data are reported as mean ± SEM. (A) Average number of d spent in met/diestrus, proestrus, or estrus during the four 2-wk stages of increasing CR for each genotype of the estrous cycle during the 6-wk cycling (n = 6 for _N_-MUT; n = 14 for WT; n = 5 for _N_-OX). Two-way ANOVA indicated a significant CR effect (P < 0.0001) and significant interaction of CR and genotype (P = 0.003) for met/diestrus, a CR effect (P < 0.0001) for proestrus; and a genotype effect (P = 0.017), a CR effect (P < 0.0001), and a significant interaction of CR and genotype (P = 0.011) for estrus. (B) LH levels during the four stages of CR (n = 6 for _N_-MUT; n = 12 for WT; n = 5 for _N_-OX). No significant differences were observed. (C) FSH levels during the four stages of CR (n = 6 for _N_-MUT; n = 12 for WT; n = 5 for _N_-OX). Two-way ANOVA indicated significant genotype (P = 0.022) and CR (P = 0.002) effects but no significant interaction. (D–F) Estradiol, progesterone, and testosterone levels before and after CR (n = 3 for _N_-MUT; n = 3 for WT; n = 3 for _N_-OX. Each sample was pooled from two animals). Two-way ANOVA indicated significant genotype (P = 0.0004) and CR (P = 0.0033) effects for estradiol, a CR effect (P = 0.0055) for progesterone, and genotype (P = 0.015) and CR (P = 0.019) effects for testosterone. No significant interactions of CR and genotype were observed. *P < 0.05, **P < 0.01, *P < 0.001, ****P < 0.0001 (post hoc testing). Met, metestrus.
Figure 6.
Hypothalamic and pituitary gene expression in _N_-MUT and _N_-OX mice. Data for _N_-MUT mice are shown in red, in white for WT littermates, and green for _N_-OX mice in green. (A) Gene expression in the hypothalami from female mice, determined by qPCR. (B) Gene expression in the pituitaries from female mice, determined by qPCR. Data are reported as mean ± SEM; n = 5 for _N_-MUT; n = 10 for WT, and n = 5 for _N_-OX. *P < 0.05, **P < 0.01. Rel, relative.
Figure 7.
Metabolic cage assessment of _N_-OX mice. Data of WT mice (n = 6) are shown in black and of _N_-OX mice (n = 6) in green. Graphs show diurnal patterns over 24 h measured per 13-min interval for the measures indicated by the _y_-axis labels. Horizontal black bar indicates period of lights off (6:00
pm
to 6:00
am
). (A) Ambulatory activity counts. (B) Rearing activity counts. (C) VO2 consumption. (D) Respiratory exchange ratio. (E) Food intake. (F) Water intake. (G) Heat produced. (H) Cage temperature. Data are reported as mean ± SEM. In all cases, repeated measures ANOVA indicated a significant time effect (P < 0.0001). Ambulatory activity, rearing activity, VO2, RER, and water intake were associated with significant genotype effects (P < 0.0001, P < 0.0001, P < 0.0001, P = 0.0004, and P = 0.04, respectively). *P < 0.05, **P < 0.01, by post hoc testing. RER, respiratory exchange ratio; Temp, temperature; VO2, oxygen consumption.
Similar articles
- SIRT1 in Astrocytes Regulates Glucose Metabolism and Reproductive Function.
Choi I, Rickert E, Fernandez M, Webster NJG. Choi I, et al. Endocrinology. 2019 Jun 1;160(6):1547-1560. doi: 10.1210/en.2019-00223. Endocrinology. 2019. PMID: 31127273 Free PMC article. - SIRT1 knock-in mice preserve ovarian reserve resembling caloric restriction.
Long GY, Yang JY, Xu JJ, Ni YH, Zhou XL, Ma JY, Fu YC, Luo LL. Long GY, et al. Gene. 2019 Feb 20;686:194-202. doi: 10.1016/j.gene.2018.10.040. Epub 2018 Oct 17. Gene. 2019. PMID: 30340050 - Oviductal extracellular vesicles (oviductosomes, OVS) are conserved in humans: murine OVS play a pivotal role in sperm capacitation and fertility.
Bathala P, Fereshteh Z, Li K, Al-Dossary AA, Galileo DS, Martin-DeLeon PA. Bathala P, et al. Mol Hum Reprod. 2018 Mar 1;24(3):143-157. doi: 10.1093/molehr/gay003. Mol Hum Reprod. 2018. PMID: 29370405 Free PMC article. - Cross-talk between SIRT1 and endocrine factors: effects on energy homeostasis.
Quiñones M, Al-Massadi O, Fernø J, Nogueiras R. Quiñones M, et al. Mol Cell Endocrinol. 2014 Nov;397(1-2):42-50. doi: 10.1016/j.mce.2014.08.002. Epub 2014 Aug 7. Mol Cell Endocrinol. 2014. PMID: 25109279 Review. - Sirtuins as possible drug targets in type 2 diabetes.
Kitada M, Kume S, Kanasaki K, Takeda-Watanabe A, Koya D. Kitada M, et al. Curr Drug Targets. 2013 Jun 1;14(6):622-36. doi: 10.2174/1389450111314060002. Curr Drug Targets. 2013. PMID: 23445543 Review.
Cited by
- Metabolic regulation of kisspeptin - the link between energy balance and reproduction.
Navarro VM. Navarro VM. Nat Rev Endocrinol. 2020 Aug;16(8):407-420. doi: 10.1038/s41574-020-0363-7. Epub 2020 May 19. Nat Rev Endocrinol. 2020. PMID: 32427949 Free PMC article. Review. - MiR-29a function as tumor suppressor in cervical cancer by targeting SIRT1 and predict patient prognosis.
Nan P, Niu Y, Wang X, Li Q. Nan P, et al. Onco Targets Ther. 2019 Aug 26;12:6917-6925. doi: 10.2147/OTT.S218043. eCollection 2019. Onco Targets Ther. 2019. PMID: 31692593 Free PMC article. Retracted. - SIRT1 in Astrocytes Regulates Glucose Metabolism and Reproductive Function.
Choi I, Rickert E, Fernandez M, Webster NJG. Choi I, et al. Endocrinology. 2019 Jun 1;160(6):1547-1560. doi: 10.1210/en.2019-00223. Endocrinology. 2019. PMID: 31127273 Free PMC article. - Recent advances of SIRT1 and implications in chemotherapeutics resistance in cancer.
Yousafzai NA, Jin H, Ullah M, Wang X. Yousafzai NA, et al. Am J Cancer Res. 2021 Nov 15;11(11):5233-5248. eCollection 2021. Am J Cancer Res. 2021. PMID: 34873458 Free PMC article. Review. - Sirt1 Activity in the Brain: Simultaneous Effects on Energy Homeostasis and Reproduction.
D'Angelo S, Mele E, Di Filippo F, Viggiano A, Meccariello R. D'Angelo S, et al. Int J Environ Res Public Health. 2021 Jan 30;18(3):1243. doi: 10.3390/ijerph18031243. Int J Environ Res Public Health. 2021. PMID: 33573212 Free PMC article. Review.
References
Grants and funding
- T32 HD007203/HD/NICHD NIH HHS/United States
- I01 BX000130/BX/BLRD VA/United States
- U54 CA155435/CA/NCI NIH HHS/United States
- P30 DK063491/DK/NIDDK NIH HHS/United States
- P30 CA023100/CA/NCI NIH HHS/United States
- P50 HD012303/HD/NICHD NIH HHS/United States
- R01 CA196853/CA/NCI NIH HHS/United States
- U54 HD012303/HD/NICHD NIH HHS/United States
LinkOut - more resources
Full Text Sources
Molecular Biology Databases


