A single-cell molecular map of mouse gastrulation and early organogenesis - PubMed (original) (raw)
. 2019 Feb;566(7745):490-495.
doi: 10.1038/s41586-019-0933-9. Epub 2019 Feb 20.
Jonathan A Griffiths # 3, Carolina Guibentif # 1 2, Tom W Hiscock 3 4, Wajid Jawaid 1 2, Fernando J Calero-Nieto 1 2, Carla Mulas 2, Ximena Ibarra-Soria 3, Richard C V Tyser 5, Debbie Lee Lian Ho 2, Wolf Reik 6 7 8, Shankar Srinivas 5, Benjamin D Simons 2 4 9, Jennifer Nichols 2, John C Marioni 10 11 12, Berthold Göttgens 13 14
Affiliations
- PMID: 30787436
- PMCID: PMC6522369
- DOI: 10.1038/s41586-019-0933-9
A single-cell molecular map of mouse gastrulation and early organogenesis
Blanca Pijuan-Sala et al. Nature. 2019 Feb.
Abstract
Across the animal kingdom, gastrulation represents a key developmental event during which embryonic pluripotent cells diversify into lineage-specific precursors that will generate the adult organism. Here we report the transcriptional profiles of 116,312 single cells from mouse embryos collected at nine sequential time points ranging from 6.5 to 8.5 days post-fertilization. We construct a molecular map of cellular differentiation from pluripotency towards all major embryonic lineages, and explore the complex events involved in the convergence of visceral and primitive streak-derived endoderm. Furthermore, we use single-cell profiling to show that Tal1-/- chimeric embryos display defects in early mesoderm diversification, and we thus demonstrate how combining temporal and transcriptional information can illuminate gene function. Together, this comprehensive delineation of mammalian cell differentiation trajectories in vivo represents a baseline for understanding the effects of gene mutations during development, as well as a roadmap for the optimization of in vitro differentiation protocols for regenerative medicine.
Conflict of interest statement
The authors declare no competing interests.
Figures
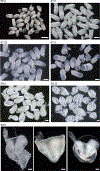
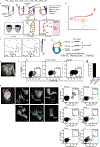
Extended Data Figure 1:. Embryo images.
Representative images of embryos collected at the time-points indicated in the Figure. Scale bars: 0.25mm.
Extended Data Figure 2:. Data quality control.
a, Left: Estimated number of cells present in a single mouse embryo at each time-point. Points are values measured in; line is an Ordinary Least Squares regression fit. Right: Number of cells captured in this study compared to the number of cells estimated in the embryo in (Left). b, Violin plots illustrating the number of detected genes (top) and Unique Molecular Identifiers (UMIs, bottom) per cell per sample. Sample 11 failed quality control and is therefore not shown. Sample details are provided in Supplementary Information Table 1. c, UMAP highlighting additional cells identified considering a reduced UMI threshold of 1,000. Additional cells are shown in black. Cells from the atlas are shown in the colour corresponding to their cell type (Fig. 1c). Note that all additional cells are present alongside cells from the atlas: no new cell types are found. d, UMAP as shown in Fig. 1c with cells coloured by biological replicate, showing consistency between samples collected at the same time-point. e, Mean gene expression of diagnostic markers (y-axis) for each cell type (x-axis) are shown. Genes are row-normalised.
Extended Data Figure 3:. Lineage progression.
a, UMAP as shown in Fig. 1c, coloured by the density of each cell in gene expression space; brighter coloured regions (towards yellow) are more densely sampled, while darker regions (towards blue) are more sparsely sampled relative to other regions in the atlas. b, Boxplots summarising the density per cell type. Values are log-transformed. c, UMAPs as shown in Fig. 1c, highlighting cells from each sampled time-point illustrating the transcriptional progression along developmental time. d, Results of atlas stability testing (see Methods). y-axis: ratio of standard deviation of cell type frequency by the mean cell-type frequency at different degrees of downsampling. Note that when the atlas is downsampled to less than half its full size (50,000 cells), the standard deviation remains less than 10% of the mean for all cell types. e, f, Abstracted graphs, which quantify the degree of similarity between the identified clusters to represent the underlying biological structure of the dataset. Nodes correspond to the annotated cell types, and edges reflect the confidence of adjacency between clusters (thicker edges indicate higher confidence). Node sizes increase as a function of the number of cells within each cluster. Nodes in (e) are coloured and numbered according to the legend shown in Fig. 1c. Nodes in (f) show the frequency of cells from each time-point, excluding two samples of mixed time-point embryos.
Extended Data Figure 4:. Endoderm convergence.
a, Schematic representing the process of definitive endoderm intercalation following gastrulation, and subsequent gut maturation. Adapted from. b-g, Gene expression levels of Ttr (b), Mixl1 (c), Nkx2–5 (d), Pyy (e), Nepn (f), Cdx2 (g) overlaid on the Fig. 2a Force-directed graph. h, Diffusion map of cells selected for transport map construction; cells selected as termini for pulling mass backward through the transport maps are coloured. i, Results of pushing mass forward through the transport maps are shown on the force-directed layout. j, Violin plots showing expression levels of Trap1a and Rhox5 in all cell-types of the full atlas. k, Dorsal view of a whole-mount fluorescence image of a Ttr::Cre; R26R::YFP embryo at E8.5. Green: YFP, Red: Phalloidin. Arrowhead: increased Ttr-YFP staining in the posterior region of the gut. Scale bar: 300 μm.
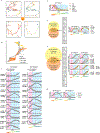
Extended Data Figure 5:. Endoderm trajectories.
a, Top: Graph abstraction of the endoderm landscape after fine sub-clustering as an alternative method to resolve which cells should be part of the VE-Hindgut 1 trajectory or the DE-Hindgut 2 trajectory (supporting transport maps; see Methods). Edges along VE-Hindgut 1 trajectory highlighted in yellow (nodes 1–4; yellow numbers. Edges along DE-Hindgut 2 trajectory highlighted in orange (nodes 1–12; orange numbers). Bottom: Graph abstraction with the subset of nodes related to the DE-Hindgut 2 trajectory to resolve the origin of cluster 4 (between 5 and 6 in top panel). Resulting DE-Hindgut2 trajectory includes clusters 1–4 and 6–9. The right hand panel overlays information about the composition of each cluster by developmental stage. b, Force-directed graph coloured by graph abstraction (PAGA) trajectories. Note that this independent approach for trajectory identification reaches very similar results to those inferred by transport maps in Fig. 2h. c, Gene-normalised dynamics of all clusters found along the VE-Hindgut 1 and the DE-Hindgut 2 trajectory (x-axis: DPT along the trajectory, y-axis: normalized expression levels). The black line is the mean fitted expression level across all genes in each cluster. Grey shading indicates the standard deviation along the trend across all genes in the cluster. Pink area highlights intercalation process; blue area highlights gut maturation steps. Dashed lines correspond to additional stages in the process deduced from the changes in gene expression trends. Points below the plots are the DPT coordinates of cells from each time-point coloured according to time-point as in Fig. 1f (from E6.5 in red to E8.5 in blue). d, Gene-normalised dynamics of VE genes along VE-Hindgut 1 trajectory indicating VE maturation prior to the intercalation stage. Plot design is as in (c); d-g: Below the x-axis, points are as in (c). e, Left: Venn diagram of genes up-regulated during the intercalation process in both VE-Hindgut 1 (in clusters 3, 5, 8, 11) and DE-Hindgut 2 (in clusters 4, 6, 7, 8, 9) trajectories. Listed genes: signature of epithelial remodelling in the overlapping fraction. Right: expression trends of illustrative genes along the trajectories (gene-normalised). f, Left: Venn diagram of genes up-regulated after the intercalation process in both trajectories (VE-Hindgut 1: clusters 1, 2, 5, 10; DE-Hindgut 2: clusters 1, 3, 5, 10); the overlapping fraction was enriched in transcription factors including a large subset of homeodomain proteins (listed). Right: gene-normalised dynamics of Hox and Cdx genes along the trajectories. g, Gene-normalised dynamics of transcription factors up-regulated specifically in the VE-Hingut 1 trajectory during endoderm intercalation.
Extended Data Figure 6:. Blood development.
a, Diagram illustrating embryonic blood emergence from the two first waves. At E6.5, gastrulation begins. Using transplantation assays, it has been shown that the proximo-posterior epiblast cells closest to the primitive streak (PS) at this stage (red) mainly give rise to primitive erythroid cells in the YS, while the epiblast cells located in the middle of the embryo at E6.5 but closer to the PS at a later stage are enriched for endothelial progenitors. At E7.5, blood islands are apparent (zoomed box of primitive blood wave), where primitive erythroid cells are surrounded by endothelium. At around E8.25, some endothelial cells (haemogenic endothelium) undergo an endothelial-to-haematopoietic transition and become Erythroid-Myeloid Progenitors (EMPs), which migrate to the foetal liver (FL) and give rise to definitive erythrocytes. Adapted from. b, Force directed layout of Fig. 3a coloured by original clusters from Fig. 1c. c, Gene expression levels of Cdh5 and Pecam1 overlaid on the graph abstraction visualisation from Fig. 3b. d, Experimental design to isolate FLK1+ cells from yolk sac, allantois and embryo proper for Smart-seq2 scRNA-seq. e, Representative image of an embryo collected for the transcriptional analysis of endothelial cells from the yolk sac (YS), allantois (AL) and Embryo proper (EP). f, Sorting strategy of FLK1+ cells from YS, EP and AL on live cells (DAPI−). x-axis: FLK1 intensity. y-axis: DAPI intensity. g, Evidence to support myeloid annotation of My cluster in Fig. 3. Haemato-endothelial cells from Fig. 3a were mapped to a published dataset that profiled haematopoietic cells collected at E9.5, E10.5 and E11.5 from different organs. Barplots show the fraction of atlas cells in the My cluster mapped to the clusters defined by Dong et al. Figure 8. h, Representative images of the dissected regions collected to study the location of CSF1R+CD16/32+ cells. Scale bar: 0.25mm. i, Flow cytometry plots indicating the frequency of CSF1R+CS16/32+ cells in each embryonic region. Two biological replicates were performed for this experiment: with pools of 12 and 13 embryos respectively. Plots illustrate one biological replicate.
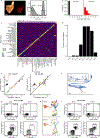
Extended Data Figure 7:. Analysis of Tal1 −/− chimeras.
a, Representative chimera embryo harvested at E8.5 (left: brightfield, right: tdTomato fluorescence; scale bar: 0.25mm), and flow cytometry plot with tdTomato fluorescence distribution and sorting gates. b, Histograms showing the UMI counts for the tdTomato construct in both tdTomato− and tdTomato+ fractions in the Tal1 −/− into WT experiment (see Methods). c-d, Control mapping results of an E8.0 biological replicate that was removed and mapped back to the atlas. c, Heatmap showing the fraction of cells of each labelled cell type that mapped to each cell type in the reference atlas. Numbers above columns indicate the number of cells in each category. 89.4% of these cells correctly mapped to their annotated cell type. d, Histogram showing the fraction of cells from the E8.0 biological replicate that mapped to each time-point in the reference. 29.2% of cells mapped to the correct timepoint, 83.1% of cells mapped within one time-point in either direction. e, Scatter plot comparing the percentage of tdTomato+ cells against tdTomato− for each cell type in both Tal1 −/− into WT (left) and WT into WT (right) experiments. Black arrow: extra-embryonic tissues. White arrow: haematopoietic tissues. f, Force-directed graph of blood-related lineages from the atlas (Fig. 3), coloured by Tal1 expression levels. Darker colouring shows higher expression. g, Flow cytometry analysis of E8.5 Tal1 −/− into WT chimeras showing the complete depletion of the haematopoietic markers CD41, CD45 (upper), as well as of the CD71+ Ter119+ erythroid fraction (lower) in Tal1 −/− tdTomato+ cells (right panels). h, UMAPs of WT into WT experiment showing balanced contribution to all embryonic lineages. i, Flow cytometry analysis of WT into WT chimeras showing balanced contribution to the haematopoietic lineage from both tdTomato+ and tdTomato− cells at E9.5 (representative of 2 individual embryos).
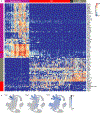
Extended Data Figure 8:. Transcriptional effects of disruption caused by Tal1.
a, Heatmap illustrating the row-normalised expression of genes upregulated in EC3-mapped Tal1 −/− cells when compared to their closest neighbours in the atlas (labelled “EC3”) and EC3-mapped WT chimera cells (labelled “WT”). b, UMAPs as in Fig. 1c, showing the expression of Tdo2, Plagl1 and Pcolce.
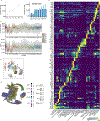
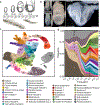
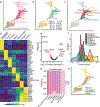
Figure 1:. A single-cell resolution atlas of mouse gastrulation and early organogenesis.
a, Overview of embryonic developmental time-points sampled, alongside corresponding Theiler and Downs and Davies stages. Adapted from. Numbers indicate days post-fertilisation. PrS: Pre-Streak, ES: Early Streak, MS: Mid-Streak, LS: Late Streak, OB: Neural Plate no bud, EB: Neural Plate Early Bud, LB: Neural Plate Late Bud, EHF: Early Headfold, LHF: Late Headfold, 1–7S: 1–7 Somites. b, Representative images of sampled embryos (see Supplementary Information Table 1 for sample collection and size). Scale bars: 0.25 mm. c, UMAP plot showing all cells of the atlas (116,312 cells). Cells are coloured by their cell type annotation and numbered according to the legend below. ExE: Extra-embryonic, NMP: Neuromesodermal progenitors, PGC: Primordial germ cells, prog.: progenitor, Def.: Definitive. d, Change in frequency of cell type per time-point, displaying a progressive increase in cell type complexity throughout our sampling.
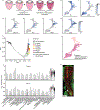
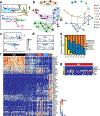
Figure 2:. Molecular conversion and subsequent diversification during early endoderm development.
a-c, Force-directed graph layout of the endoderm cell subset (5,015 cells) coloured by (a) global cell type annotation, (b) embryo collection time-point, (c) mature gut cell types. Each point is a cell, and cells close to each other have similar transcriptional profiles. d, Heatmap illustrating mean expression of marker genes for each mature gut cluster (row-normalised). e, Volcano plot showing differentially-expressed genes between Hindgut 1 (53 cells) and 2 (148 cells). Red: significantly differentially-expressed genes (BH-adjusted p <0.1; Methods). The five most significantly differentially-expressed genes in each direction are labelled. f, Pseudo-spatial ordering of cells along the gut tube. x-axis: pseudo-space coordinate corresponding to DPT values. g, Fraction of cells of each mature gut cluster predicted to derive from visceral endoderm (VE) or definitive endoderm (DE). h, Force-directed graph coloured by putative trajectories for formation of the Hindgut clusters.
Figure 3:. Temporal analysis of blood emergence reveals early myeloid cells.
a, Force-directed graph layout of cells associated with the blood lineage, coloured by subcluster (15,875 cells). Box shows a zoomed section focusing on Myeloid (My), Megakaryocytic (Mk), and haemogenic endothelial cells. b, Graph abstraction summarising the relationships between the subclusters as in (a), coloured by subcluster (left) and collection time-point (right), excluding two samples of mixed-time-point embryos. c, Expression levels of Kdr, overlaid on the force-directed layout, d, Expression levels of Spi1 and Itga2b, overlaid on the inset of the force-directed layout, e, Fraction of EC cells mapped to yolk sac, allantois and embryo proper. f, Heatmap illustrating row-normalised expression of genes upregulated in EC7 (197 cells), Haem4 (102 cells), My (56 cells), BP4 (54 cells) and Mk (32 cells) clusters when comparing all subclusters in (a) (logFC>2.5; BH-adjusted p<0.05). g, Heatmap illustrating the log-count expression (ranging from 0 to 3.5) of previously described microglial (Micr.) and EMP markers.
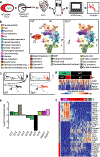
Figure 4:. Mapping Tal1 −/− chimeras to the atlas identifies molecular states associated with defects in haemato-endothelial development.
a, Experimental design for Tal1 −/− chimera generation and sequencing. b, UMAPs of chimera cells (25,078 WT cells; 26,326 Tal1 −/− cells). Points are coloured and numbered according to their computationally assigned cell type, as in Figure 1. Numbers and legend have only been specified for those cell types that are clearly visible in the plot. White arrowhead highlights blood cells, which are depleted in mutant cells. c, Mapping of blood-related cells from the chimera onto the blood-related cells from the atlas. Left: WT (9,336 cells); right: Tal1 −/− (2,911 cells). Arrowheads denote the position at which blood development appears blocked in Tal1 −/− cells. d, Heatmap illustrating the row-normalised expression of blood (Cbfa2t3 and Itga2b) and endothelial (Cdh5 and Pecam1) genes in EC6 WT (43 cells), EC6 Tal1 −/− (28 cells), EC7 WT (117 cells), and EC7 Tal1 −/− (7 cells) cells. e, Log-fold-change abundance of Tal1 −/− cells with respect to WT chimera cells in each of the clusters. Below are the absolute numbers of cells resulting from the injected Tal1 −/− cells (red) and from the host WT (black). f, Heatmap illustrating the row-normalised expression of genes upregulated in EC3-mapped Tal1 −/− cells. From left to right, columns represent a sample of atlas cardiomyocytes (CM) (200 cells), Tal1 −/− EC3 (328 cells), (3) WT EC3 (23 cells) and (4) atlas EC3 cells (107 cells). Illustrative genes have been manually selected from the full heatmap shown in Extended Data Fig. 8a.
Similar articles
- Resolving early mesoderm diversification through single-cell expression profiling.
Scialdone A, Tanaka Y, Jawaid W, Moignard V, Wilson NK, Macaulay IC, Marioni JC, Göttgens B. Scialdone A, et al. Nature. 2016 Jul 14;535(7611):289-293. doi: 10.1038/nature18633. Epub 2016 Jul 6. Nature. 2016. PMID: 27383781 Free PMC article. - Multi-omics profiling of mouse gastrulation at single-cell resolution.
Argelaguet R, Clark SJ, Mohammed H, Stapel LC, Krueger C, Kapourani CA, Imaz-Rosshandler I, Lohoff T, Xiang Y, Hanna CW, Smallwood S, Ibarra-Soria X, Buettner F, Sanguinetti G, Xie W, Krueger F, Göttgens B, Rugg-Gunn PJ, Kelsey G, Dean W, Nichols J, Stegle O, Marioni JC, Reik W. Argelaguet R, et al. Nature. 2019 Dec;576(7787):487-491. doi: 10.1038/s41586-019-1825-8. Epub 2019 Dec 11. Nature. 2019. PMID: 31827285 Free PMC article. - Identification of a conserved cis-acting region driving expression of mouse Eomesodermin to the primitive streak, node, and definitive endoderm.
Wolf XA, Klein T, Garcia R, Hyttel P, Serup P. Wolf XA, et al. Gene Expr Patterns. 2012 Jan-Feb;12(1-2):85-93. doi: 10.1016/j.gep.2011.06.003. Epub 2011 Jul 8. Gene Expr Patterns. 2012. PMID: 21763783 - Differentiation of definitive endoderm from mouse embryonic stem cells.
Kim PT, Ong CJ. Kim PT, et al. Results Probl Cell Differ. 2012;55:303-19. doi: 10.1007/978-3-642-30406-4_17. Results Probl Cell Differ. 2012. PMID: 22918814 Review. - Mouse gastrulation: Coordination of tissue patterning, specification and diversification of cell fate.
Bardot ES, Hadjantonakis AK. Bardot ES, et al. Mech Dev. 2020 Sep;163:103617. doi: 10.1016/j.mod.2020.103617. Epub 2020 May 27. Mech Dev. 2020. PMID: 32473204 Free PMC article. Review.
Cited by
- Single-cell transcriptomics in planaria: new tools allow new insights into cellular and evolutionary features.
García-Castro H, Solana J. García-Castro H, et al. Biochem Soc Trans. 2022 Oct 31;50(5):1237-1246. doi: 10.1042/BST20210825. Biochem Soc Trans. 2022. PMID: 36281987 Free PMC article. Review. - Organogenetic transcriptomes of the Drosophila embryo at single cell resolution.
Peng D, Jackson D, Palicha B, Kernfeld E, Laughner N, Shoemaker A, Celniker SE, Loganathan R, Cahan P, Andrew DJ. Peng D, et al. Development. 2024 Jan 15;151(2):dev202097. doi: 10.1242/dev.202097. Epub 2024 Jan 18. Development. 2024. PMID: 38174902 Free PMC article. - TFvelo: gene regulation inspired RNA velocity estimation.
Li J, Pan X, Yuan Y, Shen HB. Li J, et al. Nat Commun. 2024 Feb 15;15(1):1387. doi: 10.1038/s41467-024-45661-w. Nat Commun. 2024. PMID: 38360714 Free PMC article. - Single cell RNA-sequencing reveals cellular heterogeneity and trajectories of lineage specification during murine embryonic limb development.
Kelly NH, Huynh NPT, Guilak F. Kelly NH, et al. Matrix Biol. 2020 Jul;89:1-10. doi: 10.1016/j.matbio.2019.12.004. Epub 2019 Dec 24. Matrix Biol. 2020. PMID: 31874220 Free PMC article. - Recent advances in mammalian reproductive biology.
Wen L, Liu Q, Xu J, Liu X, Shi C, Yang Z, Zhang Y, Xu H, Liu J, Yang H, Huang H, Qiao J, Tang F, Chen ZJ. Wen L, et al. Sci China Life Sci. 2020 Jan;63(1):18-58. doi: 10.1007/s11427-019-1572-7. Epub 2019 Nov 29. Sci China Life Sci. 2020. PMID: 31813094 Review.
References
- Tam PPL & Behringer RR Mouse gastrulation: the formation of a mammalian body plan. Mech. Dev 68, 3–25 (1997). - PubMed
Additional References
- Nichols J & Jones K Derivation of Mouse Embryonic Stem (ES) Cell Lines Using Small-Molecule Inhibitors of Erk and Gsk3 Signaling (2i). Cold Spring Harbor Protocols 2017, pdb.prot094086 (2017). - PubMed
Publication types
MeSH terms
Substances
Grants and funding
- 109081/WT_/Wellcome Trust/United Kingdom
- 079895/WT_/Wellcome Trust/United Kingdom
- 206328/WT_/Wellcome Trust/United Kingdom
- 206328/Z/17/Z/WT_/Wellcome Trust/United Kingdom
- FS/18/24/33424/BHF_/British Heart Foundation/United Kingdom
- 105031/WT_/Wellcome Trust/United Kingdom
- 21762/CRUK_/Cancer Research UK/United Kingdom
- 097922/WT_/Wellcome Trust/United Kingdom
- R24 DK106766/DK/NIDDK NIH HHS/United States
- MR/M008975/1/MRC_/Medical Research Council/United Kingdom
- 203151/WT_/Wellcome Trust/United Kingdom
- MC_PC_12009/MRC_/Medical Research Council/United Kingdom
- A21762/CRUK_/Cancer Research UK/United Kingdom
LinkOut - more resources
Full Text Sources
Other Literature Sources
Molecular Biology Databases
Research Materials
