Kinesin-6 regulates cell-size-dependent spindle elongation velocity to keep mitosis duration constant in fission yeast - PubMed (original) (raw)
Kinesin-6 regulates cell-size-dependent spindle elongation velocity to keep mitosis duration constant in fission yeast
Lara Katharina Krüger et al. Elife. 2019.
Abstract
The length of the mitotic spindle scales with cell size in a wide range of organisms during embryonic development. Interestingly, in C. elegans embryos, this goes along with temporal regulation: larger cells speed up spindle assembly and elongation. We demonstrate that, similarly in fission yeast, spindle length and spindle dynamics adjust to cell size, which allows to keep mitosis duration constant. Since prolongation of mitosis was shown to affect cell viability, this may resemble a mechanism to regulate mitosis duration. We further reveal how the velocity of spindle elongation is regulated: coupled to cell size, the amount of kinesin-6 Klp9 molecules increases, resulting in an acceleration of spindle elongation in anaphase B. In addition, the number of Klp9 binding sites to microtubules increases overproportionally to Klp9 molecules, suggesting that molecular crowding inversely correlates to cell size and might have an impact on spindle elongation velocity control.
Keywords: Cell division; S. pombe; cell biology; intracellular scaling; microtubules; mitosis duration; mitotic motors; mitotic spindle.
© 2019, Krüger et al.
Conflict of interest statement
LK, JS, AP, PT No competing interests declared
Figures
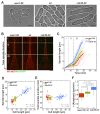
Figure 1.. In S. pombe spindle length scales with cell size but total spindle duration is kept constant.
(A) Brightfield images of S. pombe wild-type cells (central panel) and cell cycle mutants wee1-50 (left panel) and cdc25-22 (right panel). Cells reach their maximum cell length at mitosis/cell division, represented by the septum (asterisk). Scale bar, 5 µm. (B) Time-lapse images of wee1-50, wild-type (wt) and cdc25-22 cells expressing mCherry-Atb2 (tubulin) and Mis12-GFP from spindle assembly to spindle breakdown (asterisk). Dotted line corresponds to transition from phase I to II (prophase to metaphase). Dashed line corresponds to transition from phase II to III (metaphase to anaphase). Arrowheads indicate the last time point of phase II or III, corresponding to spindle length plotted in (D) and Figure 1—figure supplement 1. Each frame corresponds to 1 min interval. Scale bar, 5 µm. (C) Comparative plot of spindle length dynamics of wee1-50 (red curves, n = 20), wild-type (green curves, n = 20) and cdc25-22 cells (blue curves, n = 20). Bold curves correspond to mean spindle dynamics. As in (B) dotted and dashed lines display phase transitions. (D) Final spindle length plotted against cell length (wee1-50: n = 53, wt: n = 61, cdc25-22: n = 60). (E) Total spindle duration plotted against cell length (wee1-50: n = 53, wt: n = 61, cdc25-22: n = 60). Data in (D–E) was fitted by linear regression (dashed lines), showing the regression coefficient R2 and the slope m. (F) Boxplot comparison of anaphase B spindle elongation velocities (v) in wee1-50, wild-type and cdc25-22 cells. Data from n cells was collected from three independent experiments. P values were calculated by Mann-Whitney U test.
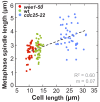
Figure 1—figure supplement 1.. Metaphase spindle length plotted against maximum cell length.
Data was fitted by linear regression (dashed line), showing the regression coefficient R2 and the slope m. Data obtained from n analyzed cells (wee1-50: n = 53, wt: n = 61, cdc25-22: n = 60) was collected from three independent experiments.
Figure 1—figure supplement 2.. Boxplot comparison of spindle elongation velocity in prophase (I), metaphase (II) and anaphase B (III).
P values were calculated by Mann-Whitney U test. Data obtained from n analyzed cells was collected from three independent experiments.
Figure 2.. Spindle length and spindle elongation velocity scales with cell length in multiple conditions.
(A) Brightfield images of S. pombe wild-type cells in starvation (starved wt), wild-type cells in exponential growth phase (wt), cdc2-asM17 cells, wild-type cells treated with hydroxyurea (wt+HU), cdc2-asM17 cells treated with NM-PP1 for 30 min, 2 hr or 2.5 hr. Cells reach their maximum cell length at mitosis/cell division, represented by the septum (asterisk). Scale bar, 5 µm. (B) Final spindle length plotted against cell length. (C) Total spindle duration plotted against cell length. (D) Anaphase spindle elongation velocity plotted against cell length. Data in (B–D) was fitted by linear regression (dashed lines), showing the regression coefficient R2 and the slope m. Data was obtained from n cells (starved wt: n = 27, wt: n = 133, wt +HU: n = 52, cdc2-asM17: n = 49, cdc2-asM17 + NM-PP1: n = 163) was collected from three independent experiments.
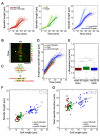
Figure 3.. Kinesin-6 Klp9 deletion abolishes cell-size-dependent spindle elongation velocity and constant mitosis duration.
(A) Comparative plots of spindle length dynamics of wee1-50 (light-red, n = 20) and _wee1-50_klp9Δ (dark-red, n = 20) [left panel], wild-type (light-green, n = 20) and klp9Δ (dark-green, n = 20) [central panel], cdc25-22 (light-blue n = 20) and _cdc25-22_klp9Δ (dark-blue, n = 20) [right panel]. Bold curves correspond to mean spindle dynamics of each cell type. (B) Time-lapse image from mitosis onset until spindle breakdown of a wild-type (wt) cell expressing mCherry-Atb2 (tubulin) and Klp9-GFP. Each frame corresponds to 2 min interval. Arrowhead marks the start of anaphase B. Scale bar, 5 µm. (C) Model for anaphase spindle elongation by Klp9, based on Fu et al., 2009. Microtubules are shown in red, Klp9 in green and Ase1 in orange. (D) Comparative plot of anaphase spindle dynamics of _wee1-50_klp9Δ (dark-red, n = 20), klp9Δ (dark-green, n = 20) and _cdc25-22_klp9Δ (dark-blue, n = 20). Bold curves correspond to mean spindle dynamics. (E) Box plot comparison of anaphase B spindle elongation velocities (v) in _wee1-50_klp9Δ, klp9Δ and _cdc25-22_klp9Δ. P values were calculated by Mann-Whitney U test; data sets are defined as not significantly different (n.s.) if p>0.05. (F) Final spindle length in the klp9Δ background plotted against maximum cell length (_wee1-50_klp9Δ: n = 41, klp9Δ: n = 46, _cdc25-22_klp9Δ: n = 45). (G) Total spindle duration in the klp9Δ background plotted against cell length (_wee1-50_klp9Δ: n = 41, klp9Δ: n = 46, _cdc25-22_klp9Δ: n = 45). Data in (F–G) was fitted by linear regression (dashed lines), showing the regression coefficient R2 and the slope m. Data obtained from n cells was collected from three independent experiments.
Figure 3—figure supplement 1.. Anaphase spindle elongation velocity plotted against cell length of _cdc2-asM17_klp9Δ and _cdc2-asM17_klp9Δ + NM-PP1.
Data was fitted by linear regression (dashed lines), showing the regression coefficient R2 and the slope m. Data obtained from n analyzed cells (_cdc2-asM17_klp9Δ: n = 42, _cdc2-asM17_klp9Δ + NM-PP1: n = 78) was collected from three independent experiments.
Figure 3—figure supplement 2.. Final spindle length plotted against cell length of _cdc2-asM17_klp9Δ and _cdc2-asM17_klp9Δ + NM-PP1.
Data was fitted by linear regression (dashed lines), showing the regression coefficient R2 and the slope m. Data obtained from n analyzed cells (_cdc2-asM17_klp9Δ: n = 42, _cdc2-asM17_klp9Δ + NM-PP1: n = 78) was collected from three independent experiments.
Figure 3—figure supplement 3.. Total spindle duration plotted against cell length of _cdc2-asM17_klp9Δ and _cdc2-asM17_klp9Δ + NM-PP1.
Data was fitted by linear regression (dashed lines), showing the regression coefficient R2 and the slope m. Data obtained from n analyzed cells (_cdc2-asM17_klp9Δ: n = 42, _cdc2-asM17_klp9Δ + NM-PP1: n = 78) was collected from three independent experiment.
Figure 4.. The total number of Klp9 molecules and the number of motors on anaphase spindles increase with cell size.
(A) Time-lapse images of wee1-50, wild-type (wt) and cdc25-22 cells expressing mCherry-Atb2 (tubulin) and Klp9-GFP from anaphase onset (arrowhead) to spindle breakdown (asterisk). Each frame corresponds to 1 min interval. Scale bar, 5 µm. (B) Comparative plot of Klp9-GFP intensity over spindle length. Each line corresponds to the Klp9-GFP intensity values of one cell throughout progressing spindle elongation in anaphase. Bold curves correspond to a representative cell of each cell type. (C) Total Klp9-GFP intensity (●, filled dots) and Klp9-GFP intensity at anaphase spindles (○, unfilled dots) plotted against cell length (wee1-50: n = 48, wt: n = 46, cdc25-22: n = 30). Shown values of Klp9-GFP intensity of anaphase spindles correspond to the mean intensity values of late anaphase. (D) Ratio between Klp9-GFP intensity at the anaphase spindle and the total Klp9-GFP intensity, referred to as Klp9 spindle fraction, plotted against cell length (wee1-50: n = 48, wt: n = 46, cdc25-22: n = 30). (E) Ratio of total Klp9-GFP intensity and cell volume plotted against cell length (wee1-50: n = 30, wt: n = 29, cdc25-22: n = 17). Data in (C–E) was fitted by linear regression (dashed lines), showing the regression coefficient R2 and the slope m. Data obtained from n cells was collected from three independent experiments.
Figure 4—figure supplement 1.. Total Klp9-GFP intensity and Klp9-GFP intensity at anaphase spindles plotted against cell length of cdc2-asM17 and cdc2-asM17 + NM-PP1.
Data was fitted by linear regression (dashed lines), showing the regression coefficient R2 and the slope m. Data obtained from n analyzed cells (wt: n = 17, _cdc2-asM17_Klp9-GFP: n = 22, _cdc2-asM17_Klp9-GFP + NM-PP1: n = 101) was collected from three independent experiments.
Figure 4—figure supplement 2.. Ratio between Klp9-GFP intensity at anaphase spindles and in the nucleus plotted against cell length of cdc2-asM17 and cdc2-asM17 + NM-PP1.
Data was fitted by linear regression (dashed lines), showing the regression coefficient R2 and the slope m. Data obtained from n analyzed cells (wt: n = 17, _cdc2-asM17_Klp9-GFP: n = 22, _cdc2-asM17_Klp9-GFP + NM-PP1: n = 95) was collected from three independent experiments.
Figure 4—figure supplement 3.. Estimation of cell volume of S. pombe cells.
Scheme, illustrating the calculation of cell volume by treating the fission yeast cell as a cylinder: cell length corresponds to hight (h) and half of the cell diameter to the radius (r).
Figure 4—figure supplement 4.. Total mCherry-Atb2 intensity and mCherry-Atb2 intensity of anaphase spindles in wee1-50, wild-type and cdc25-22 cells.
Total mCherry-Atb2 intensity (●, filled dots) or mCherry-Atb2 intensity of anaphase spindles (○, unfilled dots) plotted against cell length. Total mCherry-Atb2 intensity was measured shortly before mitosis onset, by measuring the intensity of the whole cell. Intensity of anaphase spindles corresponds to the mCherry-Atb2 intensity of the anaphase spindle just before spindle disassembly. Data was fitted by linear regression (dashed lines), showing the regression coefficient R2 and the slope m. Data obtained from n analyzed cells (wee1-50: n = 20, wt: n = 18, cdc25-22: n = 17) was collected from three independent experiments.
Figure 4—figure supplement 5.. Ratio of total mCherry-Atb2 intensity and cell volume plotted against cell length.
Data was fitted by linear regression (dashed lines), showing the regression coefficient R2 and the slope m. Data obtained from n analyzed cells (wee1-50: n = 20, wt: n = 18, cdc25-22: n = 17) was collected from three independent experiments.
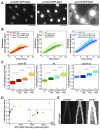
Figure 5.. Overexpression of Klp9 accelerates anaphase B spindle elongation in a dose-dependent manner.
(A) Images of cells expressing GFP-klp9 under the control of thiamine repressible nmt promoters. Scale bar, 5 µm. (B) Comparative plot of spindle length dynamics of wee1-50 (left panel), wild-type (middle panel) and cdc25-22 cells (right panel) with endogenous klp9 expression, pnmt81-klp9, pnmt41-klp9 and pnmt1-klp9 (each strain: n = 20). (C) Box plot comparison of anaphase B spindle elongation velocities (v) in cells with endogenous klp9 expression (Ctrl), pnmt81-klp9, pnmt41-klp9 and pnmt1-klp9. P values were calculated by Mann-Whitney U test. (D) Mean values and corresponding standard deviations of anaphase B velocity plotted against mean values of GFP-klp9 intensity at anaphase spindles. The inset shows the same data on a 0 to 500 AU x-axis and a 0.2 to 1.0 µm/min y-axis. The color code is equal to the one used in (B) and (C). (E) Time-lapse images from metaphase to spindle breakdown in cells expressing GFP-klp9 under the control of nmt promoters. Each frame corresponds to 1 min interval. Scale bar, 5 µm. Data obtained from n cells was collected from three independent experiments.
Figure 5—figure supplement 1.. Linear regression of the function of spindle elongation velocity and Klp9-GFP intensity.
Mean values of anaphase spindle elongation velocity plotted against mean values of GFP-klp9 intensity below intensity values of 500 AU. Data of either control cells (wee1-50, wild-type and cdc25-22) or cells in which klp9 was overexpressed (pnmt-klp9) was plotted by linear regression (dashed lines), showing the regression coefficient R2 and the slope m. Data was collected from three independent experiments.
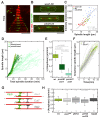
Figure 6.. Ase1, Cut7 and Klp2 do not contribute to the regulation of cell-size-dependent spindle elongation velocity.
(A) Time-lapse image from mitosis onset until spindle breakdown of a wild-type cell expressing mCherry-Atb2 (tubulin) and Ase1-GFP. Arrowhead corresponds to anaphase B onset. Each frame corresponds to 2 min interval. (B) Images of wee1-50, wild-type (wt) and cdc25-22 cells expressing mCherry-Atb2 (tubulin) and Ase1-GFP in late anaphase. Scale bar, 5 µm. (C) Ase1-GFP intensity at anaphase spindles plotted against final spindle length (wee1-50: n = 24, wt: n = 28, cdc25-22: n = 30). Data was fitted by linear regression (dashed lines), showing the regression coefficient R2 and the slope m. (D) Comparative plot of spindle length dynamics of wild-type (n = 27) cells, pnmt81-ase1 (n = 32) and pnmt41-ase1 (n = 29). (E) Box plot comparison of anaphase B spindle elongation velocities (v) in wild-type, pnmt81-ase1 and pnmt41-ase1 cells. (F) Comparative plot of anaphase spindle dynamics of wild-type (n = 28) and ase1Off cells (n = 52). Bold curves correspond to mean spindle dynamics. (G) Model of the role of tested midzone components. (H) Box plot comparison of anaphase B spindle elongation velocities (v) in wild-type cells, ase1-Shut-Off (ase1Off), pkl1Δ, the double-deletion pkl1Δcut7Δ and klp2Δ cells. P values were calculated by Mann-Whitney U test; data sets are defined as not significantly different (n.s.) if p>0.05. Data obtained from n cells was collected from three independent experiments.
Figure 6—figure supplement 1.. Upon reduction of the Ase1 level spindles remain stable until late anaphase.
Time-lapse images of cells, in which ase1 was deleted (ase1Δ) or ase1 expression reduced (ase1Off) expressing mCherry-Atb2 (tubulin) and Mis12-GFP from the onset of anaphase until spindles broke or disassembled. Each frame corresponds to 2 min interval. Scale bars, 5 µm.
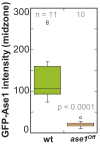
Figure 6—figure supplement 2.. GFP-Ase1 intensity at anapahse spindles in ase1Off and wild-type cells.
Boxplot comparison of GFP-Ase1 intensity in wild-type and Ase1 Shut-Off cells. P values were calculated by Mann-Whitney U test. Data obtained from n analyzed cells was collected from one experiment.
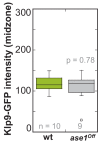
Figure 6—figure supplement 3.. Klp9-GFP intensity at anaphase spindles in ase1Off and wild-type cells.
Boxplot comparison of Klp9-GFP intensity in wild-type and Ase1 Shut-Off cells. P values were calculated by Mann-Whitney U test. Data sets are defined as not significantly different (n.s.) if p>0.5. Data obtained from n analyzed cells was collected from one experiment.
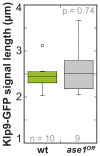
Figure 6—figure supplement 4.. Klp9-GFP signal length at anaphase spindles in ase1Off and wild-type cells.
Boxplot comparison of Klp9-GFP signal length in wild-type and Ase1 Shut-Off cells. P values were calculated by Mann-Whitney U test. Data sets are defined as not significantly different (n.s.) if p>0.5. Data obtained from n analyzed cells was collected from one experiment.
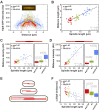
Figure 7.. Longer spindles provide overproportionally more binding sites for Klp9.
(A) Intensities obtained by line scan analysis of Klp9-GFP signals at anaphase spindles of wee1-50 (n = 20), wild-type (n = 20) and cdc25-22 (n = 20) cells. A line was placed over the whole length of the Klp9-GFP signal (red dashed line, inset) and the resulting intensity spectrum is shown. Bold curves correspond to the mean intensity distribution for each cell type. (B) Mean midzone length plotted against spindle length (wee1-50: n = 19, wt: n = 16, cdc25-22: n = 19). (C) mCherry-Atb2 density of the midzone, measured as illustrated by the dashed box within the scheme illustrating the mitotic spindle, plotted against final spindle length (left panel) and box plot comparison of the mCherry-Atb2 density of the midzone (right panel). (D) Total mCherry-Atb2 intensity of the midzone, measured as illustrated by the dashed box within the scheme illustrating the mitotic spindle, plotted against final spindle length (left panel) and box plot comparison of the total mCherry-Atb2 intensity of the midzone (right panel). (E) Model for mitotic spindle structure in fission yeast cells of different sizes. MTs are shown in red and spindle poles in orange. (F) Effective concentration of Klp9 at the midzone plotted against spindle length (left panel) and box plot comparison of the effective concentration of Klp9 at the midzone (right panel). Data in (B–D) and (F) was fitted by linear regression (dashed lines), showing the regression coefficient R2 and the slope m. P values were calculated by Mann-Whitney U test. Data obtained from n analyzed cells was collected from three independent experiments.
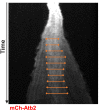
Figure 7—figure supplement 1.. Measurement of midzone length.
Kymograph of a wild-type cell expressing mCherry-Atb2 from early metaphase to the end of anaphase B. Orange lines mark the region of high mCherry-intensity used to measure the length of the region of antiparallel overlapping microtubules. Midzone length was calculated by the average of signal lengths measured throughout anaphase spindle elongation.
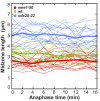
Figure 7—figure supplement 2.. Midzone length throughout progressing spindle elongation in anaphase plotted against time.
Length of the region of high mCherry-Atb2 intensity, corresponding to midzone length, over time in anaphase B (wee1-50: n = 19, wt: n = 16, cdc25-22: n = 19). Bold curves correspond to mean midzone length over time. Data obtained from n analyzed cells was collected from one independent experiments.
Figure 7—figure supplement 3.. Ratio of mCherry-Atb2 intensity of the anaphase spindle and spindle length plotted against cell length.
Data was fitted by linear regression (dashed lines), showing the regression coefficient R2 and the slope m. Data obtained from n analyzed cells (wee1-50: n = 20, wt: n = 18, cdc25-22: n = 17) was collected from three independent experiments.
Figure 7—figure supplement 4.. Ratio of total mCherry-Atb2 intensity and spindle length plotted against cell length.
Data was fitted by linear regression (dashed lines), showing the regression coefficient R2 and the slope m. Data obtained from n analyzed cells (wee1-50: n = 20, wt: n = 18, cdc25-22: n = 17) was collected from three independent experiments.
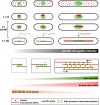
Figure 8.. Limited components model for the regulation of cell-size-dependent spindle elongation and a constant mitosis duration.
Upper panel: The concentration of essential components such as tubulin (red) and Klp9 (green) is constant in cells of different sizes. Thus, total amounts increase proportional to cell size. Due to the presence of more tubulin molecules, longer and more dense spindles can be assembled in larger cells (from t = 0 to t = 30). Likewise, the presence of more Klp9 molecules allows the recruitment of more motors to the anaphase spindle (from t = 0 to t = 30). Lower panel: Since, both the length of antiparallel overlap and the number of microtubules within the midzone increase with cell size, the number of binding sites for Klp9 to the spindle scales overproportionally with spindle and cell length. Thereby, the motor density of Klp9 at the midzone is reduced. With more motors acting in a less crowded environment, spindle elongation can be accelerated and the overall duration of chromosome segregation is kept constant: with increasing cell size, longer spindles are elongated with increasing velocity.
Similar articles
- Kinesin-6 Klp9 orchestrates spindle elongation by regulating microtubule sliding and growth.
Krüger LK, Gélin M, Ji L, Kikuti C, Houdusse A, Théry M, Blanchoin L, Tran PT. Krüger LK, et al. Elife. 2021 Jun 3;10:e67489. doi: 10.7554/eLife.67489. Elife. 2021. PMID: 34080538 Free PMC article. - Kinesin-6 Klp9 plays motor-dependent and -independent roles in collaboration with Kinesin-5 Cut7 and the microtubule crosslinker Ase1 in fission yeast.
Yukawa M, Okazaki M, Teratani Y, Furuta K, Toda T. Yukawa M, et al. Sci Rep. 2019 May 14;9(1):7336. doi: 10.1038/s41598-019-43774-7. Sci Rep. 2019. PMID: 31089172 Free PMC article. - A role for metaphase spindle elongation forces in correction of merotelic kinetochore attachments.
Choi SH, McCollum D. Choi SH, et al. Curr Biol. 2012 Feb 7;22(3):225-30. doi: 10.1016/j.cub.2011.12.022. Epub 2012 Jan 19. Curr Biol. 2012. PMID: 22264609 Free PMC article. - Factors that Control Mitotic Spindle Dynamics.
Fraschini R. Fraschini R. Adv Exp Med Biol. 2017;925:89-101. doi: 10.1007/5584_2016_74. Adv Exp Med Biol. 2017. PMID: 27722958 Review. - Roles and mechanisms of Kinesin-6 KIF20A in spindle organization during cell division.
Wu WD, Yu KW, Zhong N, Xiao Y, She ZY. Wu WD, et al. Eur J Cell Biol. 2019 Jun;98(2-4):74-80. doi: 10.1016/j.ejcb.2018.12.002. Epub 2018 Dec 16. Eur J Cell Biol. 2019. PMID: 30579662 Review.
Cited by
- Kinesin-6 Klp9 orchestrates spindle elongation by regulating microtubule sliding and growth.
Krüger LK, Gélin M, Ji L, Kikuti C, Houdusse A, Théry M, Blanchoin L, Tran PT. Krüger LK, et al. Elife. 2021 Jun 3;10:e67489. doi: 10.7554/eLife.67489. Elife. 2021. PMID: 34080538 Free PMC article. - The phosphatase inhibitor Sds23 promotes symmetric spindle positioning in fission yeast.
Schutt KL, Moseley JB. Schutt KL, et al. Cytoskeleton (Hoboken). 2020 Dec;77(12):544-557. doi: 10.1002/cm.21648. Epub 2020 Dec 14. Cytoskeleton (Hoboken). 2020. PMID: 33280247 Free PMC article. - Prolongation of mitosis is associated with enhanced endogenous DNA damage in fission yeast.
Jain I, Tran PT. Jain I, et al. MicroPubl Biol. 2023 Jul 13;2023:10.17912/micropub.biology.000911. doi: 10.17912/micropub.biology.000911. eCollection 2023. MicroPubl Biol. 2023. PMID: 37521138 Free PMC article. - Kinesin-14 family proteins and microtubule dynamics define S. pombe mitotic and meiotic spindle assembly, and elongation.
Loncar A, Rincon SA, Lera Ramirez M, Paoletti A, Tran PT. Loncar A, et al. J Cell Sci. 2020 Jun 8;133(11):jcs240234. doi: 10.1242/jcs.240234. J Cell Sci. 2020. PMID: 32327557 Free PMC article. - Physical properties of the cytoplasm modulate the rates of microtubule polymerization and depolymerization.
Molines AT, Lemière J, Gazzola M, Steinmark IE, Edrington CH, Hsu CT, Real-Calderon P, Suhling K, Goshima G, Holt LJ, Thery M, Brouhard GJ, Chang F. Molines AT, et al. Dev Cell. 2022 Feb 28;57(4):466-479.e6. doi: 10.1016/j.devcel.2022.02.001. Dev Cell. 2022. PMID: 35231427 Free PMC article.
References
- Bähler J, Wu JQ, Longtine MS, Shah NG, McKenzie A, Steever AB, Wach A, Philippsen P, Pringle JR. Heterologous modules for efficient and versatile PCR-based gene targeting in schizosaccharomyces pombe. Yeast. 1998;14:943–951. doi: 10.1002/(SICI)1097-0061(199807)14:10<943::AID-YEA292>3.0.CO;2-Y. - DOI - PubMed
Publication types
MeSH terms
Substances
LinkOut - more resources
Full Text Sources
Molecular Biology Databases
