Prebiotics from acorn and sago prevent high-fat-diet-induced insulin resistance via microbiome-gut-brain axis modulation - PubMed (original) (raw)
Prebiotics from acorn and sago prevent high-fat-diet-induced insulin resistance via microbiome-gut-brain axis modulation
Shokouh Ahmadi et al. J Nutr Biochem. 2019 May.
Abstract
Role of gut microbiome in obesity and type 2 diabetes (T2D) became apparent from several independent studies indicating that gut microbiome modulators like prebiotics may improve microbiome perturbations (dysbiosis) to ameliorate metabolic derangements. We herein isolate water soluble, nondigestible polysaccharides from five plant-based foods (acorn, quinoa, sunflower, pumpkin seeds and sago) and assess their impact on human fecal microbiome and amelioration of high-fat-diet (HFD)-induced obesity/T2D in mice. During polysaccharide isolation, purification, biochemical and digestion resistance characterization, and fermentation pattern by human fecal microbiome, we select acorn- and sago-derived prebiotics (on the basis of relatively higher purity and yield and lower protein contamination) and examine their effects in comparison to inulin. Prebiotics treatments in human fecal microbiome culture system not only preserve microbial diversity but also appear to foster beneficial bacteria and short-chain fatty acids (SCFAs). Feeding of acorn- and sago-derived prebiotics ameliorates HFD-induced glucose intolerance and insulin resistance in mice, with effects comparatively superior to those seen in inulin-fed mice. Feeding of both of novel prebiotics as well as inulin increases SCFAs levels in the mouse gut. Interestingly, gut hyperpermeability and mucosal inflammatory markers were significantly reduced upon prebiotics feeding in HFD-fed mice. Hypothalamic energy signaling in terms of increased expression of pro-opiomelanocortin was also modulated by prebiotics administration. Results demonstrate that these (and/or such) novel prebiotics can ameliorate HFD-induced defects in glucose metabolism via positive modulation of gut-microbiome-brain axis and hence could be useful in preventing/treating diet-induced obesity/T2D.
Keywords: Diabetes; Fibers; Metabolites; Microbiome; Obesity; Polysaccharides; Prebiotic.
Copyright © 2019 Elsevier Inc. All rights reserved.
Figures
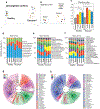
Figure 1.. Effect of inoculation of prebiotics (inulin, acorn and sago) on the microbiome diversity and composition in the feces of healthy versus diseased (heart attack patients) subjects.
(a,b) PCoA analyses (a: unweighted unifrac; b: weighted unifrac) representing the β-diversity of microbiome; (c) Shannon index representing the α-diversity of microbiome; (d-f) relative abundance of major phyla (d), families (e) and genera (f); and (g,h) Linear discrimination analysis (LDA) using LDA effect size (LefSe) algorithm; in the fecal suspension from healthy and diseased subjects after 9h incubation with (treatment) or without (control) prebiotics. Each dot in PCoA analysis represents two replicates of fecal slurry collected from two different replication experiments of same group. CTL: Control, INU: inulin, ACO: acorn, and SAG: sago. Values are presented as mean ± SD/ SEM. *P<0.05; ** P<0.01; ***P<0.001.
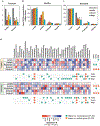
Figure 2.. Effects of inoculation of prebiotics (inulin, acorn and sago) on the metabolic activity of microbiome in the feces of healthy versus diseased subjects.
(a) Fecal pH of the fecal suspension from healthy and diseased subjects after 9h incubation with (treatment) or without (control) prebiotics. (b,c) Production of lactate, acetate, propionate and butyrate in the fecal suspension from healthy (b) and diseased (c) subjects after 9h incubation with (treatment) or without (control) prebiotics. (d) Correlation of microbial groups with pH and SCFAs levels in the fecal suspension from healthy and diseased subjects after 9h incubation with (treatment) or without (control) probiotics. Values are presented as mean ± SD/SEM of n=6 replicates per treatment group. P*<0.05; **P<0.01.
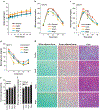
Figure 3.. Prebiotics prevent high-fat diet (HFD)-induced obesity in mice.
(a) Body weight during HFD feeding with and without prebiotics up to 35 days/ 5 weeks. (b-d) Intraperitoneal glucose tolerance test (IPGTT; b), oral glucose tolerance tests (OGTT; c) and intraperitoneal insulin tolerance test (IPITT; d) in prebiotics-fed and control mice after 5 weeks of intervention. (e) Hematoxylin and eosin (H&E) staining of white adipose tissue (gonadal), brown adipose tissue and liver of prebiotics-fed and control mice. Values are presented as mean ± SD/SEM. P*<0.05; **P<0.01; NS: non-significant.
Figure 4.. Prebiotics modulate the diversity and composition of gut microbiome in HFD-fed mice.
a) PCoA analyses presenting β-diversity (weighted unifrac) of the gut microbiome in prebiotics-fed and control mice after 5 weeks of intervention. (b) Shannon index representing the α-diversity of gut microbiome in prebiotics-fed and control mice after 5 weeks of intervention. (c,d) Relative abundances of major phyla (c) and genera (d) in prebiotics-fed and control mice after 5 weeks of intervention. (d) Linear discrimination analysis (LDA) using LDA effect Size (LefSe) algorithm of gut microbial taxa in prebiotics-fed and control mice after 5 weeks of intervention. Values are presented as mean ± SD/SEM. P*<0.05; **P<0.01.
Figure 5.. Prebiotics modulate the metabolic activities of gut microbiome in HFD-fed mice.
(a,b) Fecal pH (a) and levels of lactate, acetate, propionate and butyrate (b) in the feces of prebiotics-fed and control mice after 5 weeks of intervention. (c) Correlation of microbial groups with pH and SCFAs levels in the feces of prebiotics-fed and control mice after 5 weeks of intervention. Values are presented as mean ± SD/SEM. P*<0.05; **P<0.01; ***P<0.001.
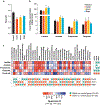
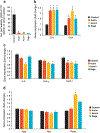
Figure 6.. Prebiotics ameliorate gut permeability, reduce inflammation and modulate gut-brain axis.
(a) Gut permeability (in terms of the diffusion of 4kDa FITC dextran from gut to blood circulation) in prebiotics-fed and control mice after 5 weeks of intervention. (b) Zonulin-1 (ZO-1) and Occludin (Ocln) mRNA expression in prebiotics-fed and control mice after 5 weeks of intervention. (c) Gene (mRNA) expression of inflammatory markers including Interleukine-6 (IL-6), tumor necrosis factor-alpha (TNF-α) and chemokine (C-C motif) ligand 2/ monocyte chemoattractant protein 1 (Ccl2/ MCP1) in prebiotics-fed and control mice after 5 weeks of intervention. (d) Gene (mRNA) expression of Agouti related protein (AgRP), neuropeptide Y (NPY) and Pro-opiomelanocortin (POMC) in the hypothalamus of (mRNA). Values are presented as mean ± SD/SEM. P*<0.05; **P<0.01; ***P<0.001.
Similar articles
- Gut microbiota and short chain fatty acids partially mediate the beneficial effects of inulin on metabolic disorders in obese ob/ob mice.
Guo J, Zhang M, Wang H, Li N, Lu Z, Li L, Hui S, Xu H. Guo J, et al. J Food Biochem. 2022 May;46(5):e14063. doi: 10.1111/jfbc.14063. Epub 2022 Feb 7. J Food Biochem. 2022. PMID: 35128673 - Laminaria japonica polysaccharide prevents high-fat-diet-induced insulin resistance in mice via regulating gut microbiota.
Li QM , Zha XQ , Zhang WN , Liu J , Pan LH , Luo JP . Li QM , et al. Food Funct. 2021 Jun 21;12(12):5260-5273. doi: 10.1039/d0fo02100h. Epub 2021 May 17. Food Funct. 2021. PMID: 33999048 - Sulfated polysaccharides from Undaria pinnatifida improved high fat diet-induced metabolic syndrome, gut microbiota dysbiosis and inflammation in BALB/c mice.
Jiang P, Zheng W, Sun X, Jiang G, Wu S, Xu Y, Song S, Ai C. Jiang P, et al. Int J Biol Macromol. 2021 Jan 15;167:1587-1597. doi: 10.1016/j.ijbiomac.2020.11.116. Epub 2020 Nov 17. Int J Biol Macromol. 2021. PMID: 33217459 - Health Effects and Mechanisms of Inulin Action in Human Metabolism.
Alonso-Allende J, Milagro FI, Aranaz P. Alonso-Allende J, et al. Nutrients. 2024 Sep 2;16(17):2935. doi: 10.3390/nu16172935. Nutrients. 2024. PMID: 39275251 Free PMC article. Review. - From gut microbiota dysfunction to obesity: could short-chain fatty acids stop this dangerous course?
Barrea L, Muscogiuri G, Annunziata G, Laudisio D, Pugliese G, Salzano C, Colao A, Savastano S. Barrea L, et al. Hormones (Athens). 2019 Sep;18(3):245-250. doi: 10.1007/s42000-019-00100-0. Epub 2019 Mar 6. Hormones (Athens). 2019. PMID: 30840230 Review.
Cited by
- Exploring Therapeutic Advances: A Comprehensive Review of Intestinal Microbiota Modulators.
Pires L, González-Paramás AM, Heleno SA, Calhelha RC. Pires L, et al. Antibiotics (Basel). 2024 Aug 1;13(8):720. doi: 10.3390/antibiotics13080720. Antibiotics (Basel). 2024. PMID: 39200020 Free PMC article. Review. - Microbial-Based Bioactive Compounds to Alleviate Inflammation in Obesity.
Apalowo OE, Adegoye GA, Obuotor TM. Apalowo OE, et al. Curr Issues Mol Biol. 2024 Feb 28;46(3):1810-1831. doi: 10.3390/cimb46030119. Curr Issues Mol Biol. 2024. PMID: 38534735 Free PMC article. Review. - Progress in research on the effects of quinoa (Chenopodium quinoa) bioactive compounds and products on intestinal flora.
Huang H, Jia C, Chen X, Zhang L, Jiang Y, Meng X, Liu X. Huang H, et al. Front Nutr. 2024 Feb 28;11:1308384. doi: 10.3389/fnut.2024.1308384. eCollection 2024. Front Nutr. 2024. PMID: 38481972 Free PMC article. Review. - Resistant starches from dietary pulses improve neurocognitive health via gut-microbiome-brain axis in aged mice.
Kadyan S, Park G, Hochuli N, Miller K, Wang B, Nagpal R. Kadyan S, et al. Front Nutr. 2024 Jan 24;11:1322201. doi: 10.3389/fnut.2024.1322201. eCollection 2024. Front Nutr. 2024. PMID: 38352704 Free PMC article. - Abnormalities in microbiota/butyrate/FFAR3 signaling in aging gut impair brain function.
Mishra SP, Jain S, Wang B, Wang S, Miller BC, Lee JY, Borlongan CV, Jiang L, Pollak J, Taraphder S, Layden BT, Rane SG, Yadav H. Mishra SP, et al. JCI Insight. 2024 Feb 8;9(3):e168443. doi: 10.1172/jci.insight.168443. JCI Insight. 2024. PMID: 38329121 Free PMC article.
References
- Lynch SV, Pedersen O. The Human Intestinal Microbiome in Health and Disease. N Engl J Med 2016;375:2369–79. - PubMed
- Kayshap PC, Quigley EM. Therapeutic implications of the gastrointestinal microbiome. Curr Opin Pharmacol 2018;38:90–6. - PubMed
Publication types
MeSH terms
Substances
Grants and funding
- R01 AG018915/AG/NIA NIH HHS/United States
- P30 AG049638/AG/NIA NIH HHS/United States
- KL2 TR001421/TR/NCATS NIH HHS/United States
- UL1 TR001420/TR/NCATS NIH HHS/United States
- P30 AG021332/AG/NIA NIH HHS/United States
LinkOut - more resources
Full Text Sources
Other Literature Sources
