Living on the edge: Exploring the role of coastal refugia in the Alexander Archipelago of Alaska - PubMed (original) (raw)
. 2019 Feb 1;9(4):1777-1797.
doi: 10.1002/ece3.4861. eCollection 2019 Feb.
Affiliations
- PMID: 30847072
- PMCID: PMC6392352
- DOI: 10.1002/ece3.4861
Living on the edge: Exploring the role of coastal refugia in the Alexander Archipelago of Alaska
Yadéeh E Sawyer et al. Ecol Evol. 2019.
Abstract
Although islands are of long-standing interest to biologists, only a handful of studies have investigated the role of climatic history in shaping evolutionary diversification in high-latitude archipelagos. In this study of the Alexander Archipelago (AA) of Southeast Alaska, we address the impact of glacial cycles on geographic genetic structure for three mammals co-distributed along the North Pacific Coast. We examined variation in mitochondrial and nuclear loci for long-tailed voles (Microtus longicaudus), northwestern deermice (Peromyscus keeni), and dusky shrews (Sorex monticola), and then tested hypotheses derived from Species Distribution Models, reconstructions of paleoshorelines, and island area and isolation. In all three species, we identified paleoendemic clades that likely originated in coastal refugia, a finding consistent with other paleoendemic lineages identified in the region such as ermine. Although there is spatial concordance at the regional level for endemism, finer scale spatial and temporal patterns are less clearly defined. Demographic expansion across the region for these distinctive clades is also evident and highlights the dynamic history of Late Quaternary contraction and expansion that characterizes high-latitude species.
Keywords: Coastal Refugia Hypothesis; comparative phylogeography; endemism; islands; small mammals.
Conflict of interest statement
None declared.
Figures
Figure 1
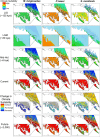
Sampling scheme, range maps, and North American LGM glacial cover. Sampling localities are shown by major cyt_b_ lineage. The thick black lines are the current range for each species, with the addition of P. maniculatus (white line) on the Peromyscus map. The light blue in the bottom right image is LGM glacial ice cover. COP: Colorado Plateau; LGM: Last Glacial Maximum; NPC: North Pacific Coast. Color schemes for species and lineages are held constant across figures
Figure 2
Species distribution models (climate suitability at each time period) for Microtus longicaudus, Peromyscus keeni and Sorex monticola from the Last Inter‐Glacial (LIG), Last Glacial Maximum (LGM; solid blue = glacial ice coverage), Mid‐Holocene (Mid‐Hol.), Current, and Future (approximately the year 2080), including the change in habitat suitability between current and future models
Figure 3
Islands and nearby coastal mainland locations in Alaska, including paleoshorelines (kya = thousands of years ago) and hypothesized island groups (also see Table 2). Red arrows indicate potential colonization across the Alexander Archipelago as a result of change in sea level and glacial cover
Figure 4
Multilocus Bayesian Species Tree. Posterior probabilities of ≥0.95 are represented with open circles on branches of the consensus tree. A priori groupings were designated based on cyt b Bayesian supported (≥0.95 posterior probability) clades. Blue = Island/Peromyscus keeni, bright green = Northern/Peromyscus sp. nov. (Yukon), dark green = North Pacific Coast, light yellow‐green = Colorado Plateau/P. maniculatus Southwest, golden = Central/P. maniculatus West, orange = Southern/P. maniculatus East, black = outgroups. Horizontal gray bars represent divergence date estimates and vertical bars indicate approximate time for the LIG and LGM. LGM: Last Glacial Maximum; LIG: Last Inter‐Glacial
Figure 5
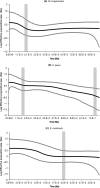
Cyt b Bayesian skyline plots (cyt_b_ data only) for the major cyt_b_ lineage populations: (a) Microtus longicaudus Island, (b) Peromyscus keeni, and (c) Sorex monticola Island. The _x_‐axis right‐to‐left from past (TMRCA) to present and is scaled in millions of years and the _y_‐axis is the log effective population size scaled by generation time. Vertical gray bars indicate the LIG (when applicable, right) and LGM (left) for reference. LGM: Last Glacial Maximum; LIG: Last Inter‐Glacial
Similar articles
- Phylogeography of endemic ermine (Mustela erminea) in southeast Alaska.
Fleming MA, Cook JA. Fleming MA, et al. Mol Ecol. 2002 Apr;11(4):795-807. doi: 10.1046/j.1365-294x.2002.01472.x. Mol Ecol. 2002. PMID: 11972765 - Beringian sub-refugia revealed in blackfish (Dallia): implications for understanding the effects of Pleistocene glaciations on Beringian taxa and other Arctic aquatic fauna.
Campbell MA, Takebayashi N, López JA. Campbell MA, et al. BMC Evol Biol. 2015 Jul 19;15:144. doi: 10.1186/s12862-015-0413-2. BMC Evol Biol. 2015. PMID: 26187279 Free PMC article. - Of glaciers and refugia: a decade of study sheds new light on the phylogeography of northwestern North America.
Shafer AB, Cullingham CI, Côté SD, Coltman DW. Shafer AB, et al. Mol Ecol. 2010 Nov;19(21):4589-621. doi: 10.1111/j.1365-294X.2010.04828.x. Epub 2010 Sep 17. Mol Ecol. 2010. PMID: 20849561 Review. - Evaluating signatures of glacial refugia for North Atlantic benthic marine taxa.
Maggs CA, Castilho R, Foltz D, Henzler C, Jolly MT, Kelly J, Olsen J, Perez KE, Stam W, Väinölä R, Viard F, Wares J. Maggs CA, et al. Ecology. 2008 Nov;89(11 Suppl):S108-22. doi: 10.1890/08-0257.1. Ecology. 2008. PMID: 19097488 Review.
Cited by
- Systematics, biogeography and phylogenomics of northern bog lemmings (Cricetidae), cold-temperate rodents of conservation concern under global change.
Hope AG, Headlee KM, Olson ZH, Wiens BJ. Hope AG, et al. Syst Biodivers. 2023;21(1):2237050. doi: 10.1080/14772000.2023.2237050. Epub 2023 Aug 9. Syst Biodivers. 2023. PMID: 38523662 Free PMC article. - Unraveling the mystery of the glacier bear: Genetic population structure of black bears (Ursus americanus) within the range of a rare pelage type.
Lewis T, Roffler G, Crupi A, Maraj R, Barten N. Lewis T, et al. Ecol Evol. 2020 Jun 27;10(14):7654-7668. doi: 10.1002/ece3.6490. eCollection 2020 Jul. Ecol Evol. 2020. PMID: 32760555 Free PMC article. - Demography and evolutionary history of grey wolf populations around the Bering Strait.
Pacheco C, Stronen AV, Jędrzejewska B, Plis K, Okhlopkov IM, Mamaev NV, Drovetski SV, Godinho R. Pacheco C, et al. Mol Ecol. 2022 Sep;31(18):4851-4865. doi: 10.1111/mec.16613. Epub 2022 Jul 29. Mol Ecol. 2022. PMID: 35822863 Free PMC article. - Patterns of Wolf Dispersal Respond to Harvest Density across an Island Complex.
Roffler GH, Pilgrim KL, Williams BC. Roffler GH, et al. Animals (Basel). 2024 Feb 15;14(4):622. doi: 10.3390/ani14040622. Animals (Basel). 2024. PMID: 38396590 Free PMC article. - Carnivore Contact: A Species Fracture Zone Delineated Amongst Genetically Structured North American Marten Populations (Martes americana and Martes caurina).
Lucid M, Cushman S, Robinson L, Kortello A, Hausleitner D, Mowat G, Ehlers S, Gillespie S, Svancara LK, Sullivan J, Rankin A, Paetkau D. Lucid M, et al. Front Genet. 2020 Jul 13;11:735. doi: 10.3389/fgene.2020.00735. eCollection 2020. Front Genet. 2020. PMID: 32754203 Free PMC article.
References
- Achilli, A. , Olivieri, A. , Semino, O. , & Torroni, A. (2018). Ancient human genomes—keys to understanding our past. Science, 360, 964–965. - PubMed
- Adler, G. H. (1992). Endemism in birds of tropical Pacific Islands. Evolutionary Ecology, 6, 296–306. 10.1007/BF02270966 - DOI
- Baichtal, J. F. , & Carlson, R. J. (2010). Development of a model to predict the location of Early‐Holocene habitation sites along the western coast of Prince of Wales Island and the Outer Islands, Southeast Alaska. Current Research in the Pleistocene, 27, 64–67.
LinkOut - more resources
Full Text Sources
Other Literature Sources
Molecular Biology Databases


