Homeostatic and tumourigenic activity of SOX2+ pituitary stem cells is controlled by the LATS/YAP/TAZ cascade - PubMed (original) (raw)
Homeostatic and tumourigenic activity of SOX2+ pituitary stem cells is controlled by the LATS/YAP/TAZ cascade
Emily J Lodge et al. Elife. 2019.
Abstract
SOX2 positive pituitary stem cells (PSCs) are specified embryonically and persist throughout life, giving rise to all pituitary endocrine lineages. We have previously shown the activation of the STK/LATS/YAP/TAZ signalling cascade in the developing and postnatal mammalian pituitary. Here, we investigate the function of this pathway during pituitary development and in the regulation of the SOX2 cell compartment. Through loss- and gain-of-function genetic approaches, we reveal that restricting YAP/TAZ activation during development is essential for normal organ size and specification from SOX2+ PSCs. Postnatal deletion of LATS kinases and subsequent upregulation of YAP/TAZ leads to uncontrolled clonal expansion of the SOX2+ PSCs and disruption of their differentiation, causing the formation of non-secreting, aggressive pituitary tumours. In contrast, sustained expression of YAP alone results in expansion of SOX2+ PSCs capable of differentiation and devoid of tumourigenic potential. Our findings identify the LATS/YAP/TAZ signalling cascade as an essential component of PSC regulation in normal pituitary physiology and tumourigenesis.
Keywords: Hippo; LATS; SOX2; YAP; mouse; pituitary stem cell; pituitary tumour; regenerative medicine; stem cells.
© 2019, Lodge et al.
Conflict of interest statement
EL, AS, JR, PX, TJ, RJ, ST, SB, CA No competing interests declared
Figures
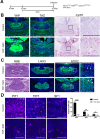
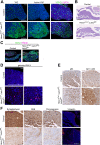
Figure 1.. Regulation of YAP is required for normal morphogenesis and lineage commitment during pituitary development.
(A) Schematic outlining the time course of doxycycline (DOX) treatment administered to pregnant dams from Hesx1Cre/+ x R26rtTA/rtTA;Col1a1tetO-Yap/tetO-Yap crosses for the embryonic induction of YAP(S127A) expression in Hesx1Cre/+;R26rtTA/+;Col1a1tetO-Yap/+ (YAP-TetO) mutant embryos as well as controls that do not express YAP(S127A) (Hesx1+/+;R26rtTA/+;Col1a1tetO-Yap/+ controls shown here). (B) Immunofluorescence staining against YAP and TAZ on frontal pituitary sections at 15.5dpc confirms accumulation of YAP protein in YAP-TetO compared to control sections, but no increase in TAZ levels. RNAscope mRNA in situ hybridisation against the YAP/TAZ target Cyr61 confirms an increase in transcripts in the anterior pituitary as well as the hypothalamus where the Cre is also active (arrows). (C) Haematoxylin and eosin staining of frontal pituitary sections from 15.5dpc control and YAP-TetO embryos showing pituitary dysmorphology in mutants. Immunofluorescence staining for LHX3 to mark anterior pituitary tissue and SOX2 to mark pituitary progenitors shows the persistence of SOX2 protein in lateral regions of the gland in YAP-TetO mutants (arrowheads) when they have lost SOX2 expression in controls (arrows) (magnified boxed region in SOX2, corresponding to dashed box in LHX3). (D) Immunofluorescence staining for lineage-committed progenitor markers PIT1, TPIT and SF1 reveals very few cells expressing commitment markers in YAP-TetO compared to control. Graph showing quantification of committed cells of the three anterior pituitary endocrine lineages, positive for PIT1, TPIT and SF1, as a percentage of total nuclei of Hesx1+/+;R26rtTA/+;Col1a1tetO-Yap/+ control and Hesx1Cre/+;R26rtTA/+;Col1a1tetO-Yap/+ (YAP-TetO) mutant pituitaries at 15.5dpc (Student’s _t_-test; PIT1: p<0.0001 (****), TPIT: p=0.0012 (**), SF1: p=0.0021 (**)). Scale bars 100 µm, 50 µm in magnified boxed regions in C. See also Figure 1—figure supplements 1 and 2.
Figure 1—figure supplement 1.. Regulation of YAP and TAZ during pituitary development.
(A) Hematoxylin and eosin staining on frontal sections through the pituitary from control and YAP-TetO heads after DOX treatment from 5.5dpc until 15.5dpc. (B) Schematic outlining the time course of doxycycline (DOX) treatment administered to Hesx1Cre/+;R26rtTA/+;Col1a1tetO-Yap/+ (YAP-TetO) and Hesx1+/+;R26rtTA/+;Col1a1tetO-Yap/+ controls to drive expression of YAP-S127A in mutant pituitaries during embryonic as well as postnatal development. (C) Hematoxylin and eosin (H and E) staining of control and YAP-TetO pituitaries at P24. Higher magnification images show the presence of cysts in the YAP-TetO mutant. White arrows indicate cells with enlarged nuclei surrounding the cysts and yellow arrowheads indicate ciliated cells. (D) Immunofluorescence staining against total YAP on frontal sections at P24 confirms accumulation of YAP protein in YAP-TetO compared to control sections, especially in the ventral anterior lobe. Immunofluorescence staining against SOX2 shows an expansion of SOX2+ epithelia lining cysts. (E) Immunofluorescence staining for lineage-committed progenitor markers PIT1, SF1 and of ACTH marking cells of the TPIT lineage in control and YAP-TetO sections at P24. The number of SOX2+ and lineage-committed cells is quantified in the graph below. Note there is a significant increase in the proportion of SOX2+ cells in YAP-TetO mutants (Student’s _t_-test, p<0.0001 (****)), decrease in PIT1+ cells (Student’s _t_-test, p<0.0002 (***)), increase in SF1+ cells (Student’s _t_-test, p<0.0066 (**)) and no significant change in ACTH+ cells. (**F**) Immunofluorescence staining against Ki-67 marking cycling cells in control and YAP-TetO sections at P24. Graph showing the percentage of Ki-67+ cells across total anterior pituitary cells. There is a trend towards a reduction in the proportion of cycling cells in YAP-TetO mutants, which is not significant (Student’s _t_-test, p>0.05). (G) Immunohistochemistry using antibodies against p63 and the AE1/AE3 cytokeratin cocktail in YAP-TetO mutants at P24 revealing positive cells lining the cysts (arrowheads). (H) Immunofluorescence staining using antibodies against ARL13B and Acetylated α-Tubulin, staining components of cilia, reveals ciliated cells lining the cysts. Staining for Alcian Blue and Period Acid Schiff (AB/PAS) to differentiate between acidic and neutral mucins reveals royal blue-stained mucous cells lining the cysts. Scale bars 1 mm in A, 500 µm in C and 100 µm in magnified panels in C, 100 µm in D, E, F and 50 µm in G and H.
Figure 1—figure supplement 2.. Regulation of YAP and TAZ during pituitary development.
(A) Hematoxylin and eosin staining on sagittal pituitary sections of 13.5dpc Hesx1Cre/+;Yapfl/fl;Taz-/- (mutant) and Hesx1+/+;Yapfl/+;Taz+/- (control) showing comparable morphology. (B) Immunofluorescence staining using antibodies against SOX2 in Hesx1Cre/+;Yapfl/fl;Taz-/- and control at 13.5dpc (sagittal) and 16.5dpc (frontal) showing the presence of SOX2+ cells in both genotypes. (C) Immunofluorescence staining for SOX2, Endomucin (EMCN) and active YAP in P28 Hesx1Cre/+;Yapfl/fl;Taz-/- and control pituitaries, identifies SOX2+ cells in regions that are negative for active YAP (mice are null for TAZ) and reveals normal vasculature. (D) Graph quantifying the percentage of SOX2+ cells expressing active YAP in control and Hesx1Cre/+;Yapfl/fl;Taz-/- mutant pituitaries at P28. There is a reduction in double-positive cells in the mutant, which did not reach significance. (E) Immunofluorescence staining for lineage committed progenitor markers PIT1 and SF1, as well as ACTH marking corticotrophs (TPIT lineage), reveals the presence and normal localisation of cells from the three lineages in a P28 Hesx1Cre/+;Yapfl/fl;Taz-/- mutant. Scale bars 100 µm.
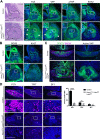
Figure 2.. Pituitary-specific deletion of Lats1 and Lats2 during development leads to pituitary overgrowth and defects in lineage commitment.
(A) Haematoxylin and eosin staining on sagittal sections from Hesx1Cre/+;Lats1fl/fl;Lats2fl/fl (mutant) and Hesx1+/+;Lats1fl/fl;Lats2fl/fl (control) embryos at 13.5dpc reveals anterior pituitary dysmorphology and overgrowth in mutants (dashed outline). Immunofluorescence staining for TAZ, YAP and pYAP reveals accumulation of TAZ and YAP in overgrown mutant tissue (arrowheads, normal epithelial expression indicated by arrows in control) and lack of staining for pYAP (S127). Immunofluorescence for SOX2 shows the presence of SOX2+ progenitors throughout the abnormal tissue in mutants. (B) Immunofluorescence staining for late progenitor marker SOX9 shows localisation in few cells of the pituitary of mutants at 13.5dpc. Immunofluorescence staining for Ki-67 indicates cycling cells throughout the mutant pituitary. (C) Immunofluorescence staining for SOX2 and Endomucin (EMCN) on frontal pituitary sections at 15.5dpc shows expansion of the SOX2+ progenitor compartment compared to controls and a reduction in vasculature marked by Endomucin. Immunofluorescence for non-phosphorylated (Active) YAP shows strong expression throughout the mutant gland compared to the control. Areas of necrosis in mutant tissue indicated by asterisks. Ventral overgrowth extending into the oral cavity between the condensing sphenoid bone indicated by arrows. (D) Immunofluorescence staining for lineage-committed progenitor markers PIT1, TPIT and SF1 reveals only sporadic cells expressing commitment markers in Hesx1Cre/+;Lats1fl/fl;Lats2fl/fl mutants compared to controls. Boxes showing magnified regions. Dashed lines demarcate anterior pituitary tissue. Graph showing quantification of committed cells of the three anterior pituitary endocrine lineages, positive for PIT1, TPIT and SF1, as a percentage of total nuclei of Hesx1+/+;Lats1fl/fl;Lats2fl/fl control and Hesx1Cre/+;Lats1fl/fl;Lats2fl/fl mutant pituitaries at 15.5dpc (Student’s _t_-test; PIT1: p<0.0001 (****), TPIT: p=0.007 (**), SF1: p>0.05). Scale bars 100 µm. See also Figure 2—figure supplement 2.
Figure 2—figure supplement 1.. Pituitary-specific loss of Stk3 and Stk4 does not affect SOX2 cell specification or lineage commitment.
(A) Dorsal view of wholemount Hesx1Cre/+;Stk3fl/fl;Stk4fl/fl (mutant) and Hesx1+/+;Stk3fl/fl;Stk4fl/fl (control) pituitaries at P0 showing comparable morphology and size at birth. (B) Western blot to determine levels of STK3 and STK4 proteins in Hesx1Cre/+;Stk3fl/fl;Stk4fl/fl mutant pituitaries compared to controls at P35, using an antibody against total STK3 and STK4 proteins. Comparison of STK3/4 band intensities confirms a significant reduction in mutants (Student’s _t_-test, p=0.00032 (***)). STK3/4 bands normalised to the housekeeping protein Cyclophilin B. (C) Immunofluorescence staining using antibodies against SOX2, TAZ, Endomucin (EMCN), YAP and pYAP at P0, indicating comparable staining between control and mutant samples. (D) Immunofluorescence staining against lineage commitment markers PIT1, TPIT and SF1 shows normal lineage commitment in a Hesx1Cre/+;Stk3fl/fl;Stk4fl/fl mutant pituitary compared to the control at P10. (E) Hematoxylin and eosin staining through frontal sections of Hesx1Cre/+;Stk3fl/fl;Stk4fl/fl and control pituitaries at P70. AL: anterior lobe, IL: intermediate lobe, PL: posterior lobe. Scale bars 100 µm.
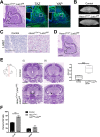
Figure 2—figure supplement 2.. Isolated deletions of Lats1 or Lats2 in the pituitary do not affect development.
(A) Hematoxylin and eosin staining of a sagittal section of Hesx1Cre/+;Lats1fl/fl at 13.5dpc showing normal morphology (see Figure 2A for control). Dashed lines demarcate developing Rathke’s pouch. Immunofluorescence staining for TAZ and YAP reveals a normal expression pattern and no gross protein accumulation (compare to control, Figure 2A). (B) Dorsal view of wholemount Hesx1Cre/+;Lats1fl/fl (mutant) and Hesx1Cre/+ (control) pituitaries at P0 showing comparable morphology and size at birth. (C) RNAscope mRNA in situ hybridisation against Lats2 shows an increase in transcripts in the anterior pituitary following deletion of Lats1 (Hesx1Cre/+;Lats1fl/fl) compared to control (Hesx1Cre/+), where Lats2 expression is barely detectable. (D) Hematoxylin and eosin staining of a sagittal section of Hesx1Cre/+;Lats2fl/fl at 13.5dpc showing normal morphology (see Figure 2A for control). Dashed lines demarcate developing Rathke’s pouch. (E) Hematoxylin and eosin staining on frontal sections through 15.5dpc embryonic heads of Hesx1Cre/+;Lats1fl/fl;Lats2fl/fl (mutant) and control (Hesx1+/+;Lats1fl/fl;Lats2fl/fl) genotypes, at the levels indicated in the cartoon. Note the hyperplastic pituitary at both axial levels, exerting mass effect on the brain. Asterisk indicates necrosis. Graph showing quantification of pituitary size at 15.5dpc as measured by the area occupied by the pituitary in matched histological sections between control and mutant embryos. Hesx1Cre/+;Lats1fl/fl;Lats2fl/fl mutant pituitaries are significantly larger (average 0.7195 mm2) compared to controls (average 0.1994 mm2) (Student’s _t_-test, p=0.0003 (***)). (F) Quantification of Ki-67+ and SOX9+ cells across the whole Rathke’s pouch of Hesx1Cre/+ (control) and Hesx1Cre/+;Lats1fl/fl (mutant) pituitaries at 13.5dpc. There is a significant increase in cycling cells in mutants, marked by Ki-67 (Student’s _t_-test, p=0.0067 (**)). The proportion of SOX9+ cells is comparable between genotypes. Scale bars 100 µm in A-D, 1 mm in E.
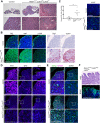
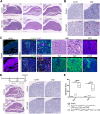
Figure 3.. Pituitary specific loss of Lats1 leads to tumour formation.
(A) Haematoxylin and eosin staining of frontal sections from Hesx1Cre/+;Lats1fl/fl;Lats2fl/+ (mutant) and control pituitaries at P56 demonstrates overgrown tumourigenic regions in mutants. These show focal necrosis, cysts and a squamous morphology (magnified regions) not seen in controls. Asterisk indicates necrosis. (B) Immunofluorescence staining for TAZ, YAP and pYAP(S127) show accumulation of TAZ and YAP but not pYAP in the mutant but not in the control. RNAscope mRNA in situ hybridisation against YAP/TAZ targets Ctgf and Cyr61 reveals an increase in transcripts on mutant tissue compared to control. (C) Graph of the proliferation index in control and mutant samples at P56 shows a significant increase in cycling cells in the Hesx1Cre/+;Lats1fl/fl;Lats2fl/+ mutant pituitaries compared to controls (control percentage Ki-67: 2.967 ± 1.2 SEM, n = 3; mutant: 15.46 ± 2.74 n = 7. p=0.0217 (*), two-tailed _t_-test). Images show representative examples of Ki-67 immunofluorescence staining. (D) Immunofluorescence staining for lineage-committed progenitor markers PIT1, TPIT and SF1 shows the near absence of committed cells in tumours. (E) Immunofluorescence staining for pituitary stem cell markers SOX2 and SOX9 reveal that tumour lesions have abundant positive cells compared to the control, while Endomucin (EMCN) staining shows poor vascularisation. (F) The marginal zone epithelium of Hesx1Cre/+;Lats1fl/fl;Lats2fl/+ mutant pituitaries develops invaginations as seen by haematoxylin and eosin staining. Immunofluorescence staining against SOX2 shows the maintenance of a single-layered epithelium. Scale bars 100 µm. Boxes indicate magnified regions. See also Figure 3—figure supplement 1.
Figure 3—figure supplement 1.. Analysis of tumourigenic lesions in postnatal pituitaries following pituitary-specific deletion of Lats1.
(A) Immunofluorescence staining for TAZ and active YAP reveal lesions of accumulation at P21 in _Hesx1Cre/+;Lats1fl/fl;Lats2fl/+_compared to _Hesx1+/+;Lats1fl/fl;Lats2fl/+_control. Immunofluorescence staining using antibodies against SOX2 and Endomucin (EMCN) show these lesions are composed of SOX2+ stem cells and have reduced vascularisation. (B) Hematoxylin and eosin staining of frontal sections from Hesx1Cre/+;Lats2fl/fl and Hesx1Cre/+ control pituitaries at P56 showing comparable histology. (C) Immunofluorescence staining against SOX2 and Endomucin on an intermediate lobe lesion (asterisk) in a Hesx1Cre/+;Lats1fl/fl;Lats2fl/+ pituitary compared to control. (D) Immunofluorescence staining against DNA damage marker gamma H2A.X showing positive cells in Hesx1Cre/+;Lats1fl/fl;Lats2fl/+ mutants. (E) P56 Immunohistochemistry using antibodies against p63 and the AE1/AE3 cytokeratin cocktail, both positive in pituitary carcinomas, showing abundant staining in Hesx1Cre/+;Lats1fl/fl;Lats2fl/+ compared to control. Note that membrane staining detected in controls is background for both antibodies. (F) Immunohistochemistry using antibodies against synaptophysin, neural-specific enolase (NSE) and chromogranin demonstrate negative immunoreactivity in tumourigenic lesions of Hesx1Cre/+;Lats1fl/fl;Lats2fl/+ pituitaries. Lesions are also negative for vimentin by immunofluorescence staining. Scale bars 100 µm in A, C-F; 500 µm in B. PL: posterior lobe, IL: intermediate lobe, AL: anterior lobe.
Figure 4.. SOX2+ pituitary stem cells are the cell-of-origin of tumours generated in the absence of Lats1.
(A) Schematic outlining the experimental time line of inductions in Sox2CreERT2/+;Lats1fl/fl;Lats2fl/+ (mutant) and Sox2+/+;Lats1fl/fl;Lats2fl/+ (control) animals. Representative images of haematoxylin and eosin staining of frontal sections of control and mutant pituitaries at P35, revealing a hyperplastic anterior pituitary in the mutant with areas of necrosis (asterisks). (B) Immunofluorescence staining reveals tumourigenic lesions in Sox2CreERT2/+;Lats1fl/fl;Lats2fl/+ that display increased levels of TAZ and YAP staining compared to the control. (C) RNAscope mRNA in situ hybridisation against Ctgf and Cyr61 shows elevated transcripts in tumourigenic lesions. Insets (i) and (ii) show invaginations in the epithelium of the mutant. (D) Immunofluorescence staining for lineage-committed progenitor markers PIT1, TPIT and SF1 showing a reduction in staining in tumourigenic lesions compared to control pituitaries. (E) Lineage tracing of SOX2+ cells in Sox2CreERT2/+;Lats1fl/fl;Lats2fl/+R26mTmG/+ reveals that tumour regions accumulating YAP as seen by immunofluorescence, are composed of GFP+ cells at P35. Scale bars 500 µm in A; 100 µm in B, D, E; 250 µm in C. See also Figure 4—figure supplement 1.
Figure 4—figure supplement 1.. Analysis of tumourigenic lesions in postnatal pituitaries following SOX2-specific deletion of Lats1.
(A) Graph of quantification of lineage commitment markers PIT1, TPIT and SF1, as a percentage of all anterior pituitary cells, in Sox2+/+;Lats1fl/fl;Lats2fl/+ (control) and Sox2CreERT2/+;Lats1fl/fl;Lats2fl/+ (mutant) pituitaries. There is a significant reduction in the percentage of committed cells of all three lineages in mutants compared to controls (Student’s t_-test; PIT1: p<0.0001 (****), TPIT: p<0.0001 (****), SF1: p=0.004 (**)). (B) Immunohistochemistry using specific antibodies against p63 and cytokeratin cocktail AE1/AE3 on frontal sections of Sox2CreERT2/+;Lats1fl/fl;Lats2fl/+ (mutant) and Sox2+/+;Lats1fl/fl;Lats2fl/+ (control) pituitaries at P35, revealing positive staining in mutants. Note that the membrane staining in controls is background for both antibodies. (C) Double immunofluorescence staining against total YAP and GFP, as well as SOX2 and GFP in consecutive sections of a tumourigenic lesion from Sox2CreERT2/+;Lats1fl/fl;Lats2fl/+;R26_mTmG/+ pituitaries at P35. Lineage tracing of SOX2+ cells, detected using GFP reveals abundant staining in the tumour lesion, characterised by accumulation of YAP and SOX2+ cells (yellow arrowheads). Scale bars 100 µm.
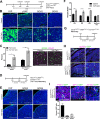
Figure 5.. Postnatal expression of constitutively active YAP increases leads to an activation of SOX2+ pituitary stem cells.
(A) Schematic outlining the time course of doxycycline (DOX) treatment administered to Hesx1Cre/+;R26rtTA/+;Col1a1tetO-Yap/+ (YAP-TetO) and Hesx1+/+;R26rtTA/+;Col1a1tetO-Yap/+ controls to drive expression of YAP-S127A in mutant pituitaries. (B) At P42 (3 weeks of treatment), immunofluorescence staining on frontal anterior pituitary sections detects strong total YAP expression in YAP-TetO mutants compared to the control and no increase in pYAP(S127). Immunofluorescence for SOX2 and SOX9 reveals an expanded population of stem cells in YAP-TetO compared to control (quantification in F). (C) Graph showing the percentage of double Ki-67+;SOX2+ cells as a proportion of the total SOX2+ (p_=_0.027 (*)) or Ki-67+ (p_=_0.006 (**)) populations at P42 (n = 3 pituitaries per genotype). There is an increase in the numbers of cycling SOX2 cells in YAP-TetO mutant compared to controls. The image shows a representative example of double immunofluorescence staining against Ki-67 and SOX2 in a control and YAP-TetO section. (D) Schematic outlining the time course of doxycycline (DOX) treatment administered to Hesx1Cre/+;R26rtTA/+;Col1a1tetO-Yap/+ (YAP-TetO) and Hesx1+/+;R26rtTA/+;Col1a1tetO-Yap/+ controls to drive expression of YAP-S127A in mutant pituitaries for three weeks, followed by a three-week recovery period in the absence of DOX. (E) Immunofluorescence staining against YAP, SOX2 and SOX9 on control and YAP-TetO pituitaries treated as in D, shows comparable expression of YAP, SOX2 and SOX9 between genotypes. (F) Graph of quantification of SOX2+ cells as a percentage of total nuclei in control and YAP-TetO pituitaries at P42 p_=_0.0014 (**); P63 p_=0.0044 (**); P105 p<_0.0001(****) (n = 3 pituitaries per genotype). Following the Recovery treatment scheme in D, there is no significant difference in the numbers of SOX2+ cells between genotypes. (G) Schematic outlining the time course of tamoxifen induction and doxycycline (DOX) treatment administered to Sox2CreERT2/+;R26rtTA/mTmG;Col1a1tetO-Yap/+ (mutant) and Sox2CreERT2/+;R26mTmG/+;Col1a1+/+ (control) animals to drive expression of YAP-S127A in SOX2+ cells of mutants. (H) Lineage tracing of SOX2+ cells and immunofluorescence staining against SOX2 and GFP shows an expansion of GFP+ cells compared to controls at P63, where a proportion of cells are double-labelled. (I) Immunofluorescence staining against commitment markers PIT1, SF1 and terminal differentiation marker ACTH (TPIT lineage) together with antibodies against GFP detects double-labelled cells (arrows) across all three lineages in Sox2CreERT2/+;R26rtTA/mTmG;Col1a1tetO-Yap/+ pituitaries following the recovery period. Graph of quantification of GFP+;PIT1+, GFP+;SF1+ and GFP+;ACTH+ cells as a percentage of total GFP+ cells in Sox2CreERT2/+;R26rtTA/mTmG;Col1a1tetO-Yap/+ pituitaries at P63. Scale bars 100 µm. Data in C. and F. represented as mean ±SEM, analysed with Two-Way ANOVA with Sidak’s multiple comparisons. See also Figure 5—figure supplement 1.
Figure 5—figure supplement 1.. Postnatal expression of constitutively active YAP leads to an activation of SOX2+ pituitary stem cells.
(A) Schematic outlining the time course of doxycycline (DOX) treatment administered to Hesx1Cre/+;R26rtTA/+;Col1a1tetO-Yap/+ (YAP-TetO) and Hesx1+/+;R26rtTA/+;Col1a1tetO-Yap/+ controls to drive expression of YAP-S127A in mutant pituitaries. Hematoxylin and eosin staining of control and YAP-TetO pituitaries at P42 (3 weeks treatment), P63 (6 weeks treatment) and P105 (12 weeks treatment). (B) RNAscope mRNA in situ hybridisation against YAP targets Cyr61 and Ctgf showing increased transcripts in YAP-TetO sections compared to controls at P42. (C) Analysis of YAP-TetO mutants at P105: double immunofluorescence staining against SOX2 and Ki-67 reveals regions of expanded SOX2+;Ki-67- cells compared to the normal expression pattern in the control. This region is SOX9+, does not accumulate TAZ or YAP and expresses pYAP as does normal anterior pituitary epithelium. Immunofluorescence against PIT1 shows the absence of commitment to this lineage, a pattern not seen in the control. Hematoxylin and eosin staining in consecutive sections identifies this region, which does not have neoplastic features. (D) Schematic outlining the time course of doxycycline (DOX) treatment administered to Hesx1Cre/+;R26rtTA/+;Col1a1tetO-Yap/+ (YAP-TetO) and Hesx1+/+;R26rtTA/+;Col1a1tetO-Yap/+ controls to drive expression of YAP-S127A in mutant pituitaries for three weeks, followed by a three-week recovery period in the absence of DOX. Hematoxylin and eosin staining of control and YAP-TetO pituitaries. RNAscope mRNA in situ hybridisation shows comparable levels of expression of targets Cyr61 and Ctgf. E) Graph comparing total fluorescence of Cyr61 and Ctgf by Fast Red RNAscope mRNA in situ hybridisation across sections from control, Hesx1Cre/+;R26rtTA/+;Col1a1tetO-Yap/+ (YAP-TetO) and Sox2CreERT2/+;Lats1fl/fl;Lats2fl/+ anterior pituitaries, normalised for total anterior pituitary area. There is a significant increase in the expression of both targets in Sox2CreERT2/+;Lats1fl/fl;Lats2fl/+ pituitaries compared to other genotypes (one-way ANOVA with Tukey’s post hoc test; Control v Sox2CreERT2/+;Lats1fl/fl;Lats2fl/+: p<0.0001 for Cyr61 (****), p=0.001 for Ctgf (***); YAP-TetO v Sox2CreERT2/+;Lats1fl/fl;Lats2fl/+: p<0.0001 for Cyr61 (****), p=0.0049 for Ctgf (**)). Scale bars 250 µm in A, 100 µm in B-D.
Figure 6.. Model of stem cell activity following regulation by the LATS/YAP/TAZ cascade in the anterior pituitary.
SOX2+ pituitary stem cells express YAP and TAZ (green spheres). During normal developmental and postnatal expansion (normal regulation), pituitary stem cells are maintained as a balanced pool while generating endocrine cells of three committed lineages (red, blue, yellow). Expression of constitutively active YAP-S127A in pituitary stem cells leads to an elevation in target gene expression, an expansion of pituitary stem cell numbers and maintenance of the SOX2+ state, preventing lineage commitment. When YAP-S127A expression ceases, commitment into the endocrine lineages takes place. Genetic deletion of LATS kinases (LATS1 as well as one or two copies of LATS2), results in YAP and TAZ accumulation, major elevation in target gene expression, repression of lineage commitment, continued expansion of SOX2+ cells and tumour formation.
Similar articles
- Non-secreting pituitary tumours characterised by enhanced expression of YAP/TAZ.
Xekouki P, Lodge EJ, Matschke J, Santambrogio A, Apps JR, Sharif A, Jacques TS, Aylwin S, Prevot V, Li R, Flitsch J, Bornstein SR, Theodoropoulou M, Andoniadou CL. Xekouki P, et al. Endocr Relat Cancer. 2019 Jan 1;26(1):215-225. doi: 10.1530/ERC-18-0330. Endocr Relat Cancer. 2019. PMID: 30139767 Free PMC article. - Control of skeletal morphogenesis by the Hippo-YAP/TAZ pathway.
Vanyai HK, Prin F, Guillermin O, Marzook B, Boeing S, Howson A, Saunders RE, Snoeks T, Howell M, Mohun TJ, Thompson B. Vanyai HK, et al. Development. 2020 Nov 12;147(21):dev187187. doi: 10.1242/dev.187187. Development. 2020. PMID: 32994166 Free PMC article. - Heat stress activates YAP/TAZ to induce the heat shock transcriptome.
Luo M, Meng Z, Moroishi T, Lin KC, Shen G, Mo F, Shao B, Wei X, Zhang P, Wei Y, Guan KL. Luo M, et al. Nat Cell Biol. 2020 Dec;22(12):1447-1459. doi: 10.1038/s41556-020-00602-9. Epub 2020 Nov 16. Nat Cell Biol. 2020. PMID: 33199845 Free PMC article. - Reciprocal regulation of YAP/TAZ by the Hippo pathway and the Small GTPase pathway.
Jang JW, Kim MK, Bae SC. Jang JW, et al. Small GTPases. 2020 Jul;11(4):280-288. doi: 10.1080/21541248.2018.1435986. Epub 2018 Apr 20. Small GTPases. 2020. PMID: 29457552 Free PMC article. Review. - Hippo-YAP/TAZ signalling in organ regeneration and regenerative medicine.
Moya IM, Halder G. Moya IM, et al. Nat Rev Mol Cell Biol. 2019 Apr;20(4):211-226. doi: 10.1038/s41580-018-0086-y. Nat Rev Mol Cell Biol. 2019. PMID: 30546055 Review.
Cited by
- Cellular interactions in the pituitary stem cell niche.
Willis TL, Lodge EJ, Andoniadou CL, Yianni V. Willis TL, et al. Cell Mol Life Sci. 2022 Dec 1;79(12):612. doi: 10.1007/s00018-022-04612-8. Cell Mol Life Sci. 2022. PMID: 36451046 Free PMC article. Review. - Requirement of FAT and DCHS protocadherins during hypothalamic-pituitary development.
Lodge EJ, Xekouki P, Silva TS, Kochi C, Longui CA, Faucz FR, Santambrogio A, Mills JL, Pankratz N, Lane J, Sosnowska D, Hodgson T, Patist AL, Francis-West P, Helmbacher F, Stratakis C, Andoniadou CL. Lodge EJ, et al. JCI Insight. 2020 Oct 27;5(23):e134310. doi: 10.1172/jci.insight.134310. JCI Insight. 2020. PMID: 33108146 Free PMC article. - The Hippo Pathway Effectors YAP and TAZ Regulate LH Release by Pituitary Gonadotrope Cells in Mice.
Lalonde-Larue A, Boyer A, Dos Santos EC, Boerboom D, Bernard DJ, Zamberlam G. Lalonde-Larue A, et al. Endocrinology. 2022 Jan 1;163(1):bqab238. doi: 10.1210/endocr/bqab238. Endocrinology. 2022. PMID: 34905605 Free PMC article. - Adamantinomatous craniopharyngioma as a model to understand paracrine and senescence-induced tumourigenesis.
Gonzalez-Meljem JM, Martinez-Barbera JP. Gonzalez-Meljem JM, et al. Cell Mol Life Sci. 2021 May;78(10):4521-4544. doi: 10.1007/s00018-021-03798-7. Epub 2021 Mar 26. Cell Mol Life Sci. 2021. PMID: 34019103 Free PMC article. Review. - Targeting the Hippo pathway in cancer, fibrosis, wound healing and regenerative medicine.
Dey A, Varelas X, Guan KL. Dey A, et al. Nat Rev Drug Discov. 2020 Jul;19(7):480-494. doi: 10.1038/s41573-020-0070-z. Epub 2020 Jun 17. Nat Rev Drug Discov. 2020. PMID: 32555376 Free PMC article. Review.
References
- Andoniadou CL, Gaston-Massuet C, Reddy R, Schneider RP, Blasco MA, Le Tissier P, Jacques TS, Pevny LH, Dattani MT, Martinez-Barbera JP. Identification of novel pathways involved in the pathogenesis of human adamantinomatous craniopharyngioma. Acta Neuropathologica. 2012;124:259–271. doi: 10.1007/s00401-012-0957-9. - DOI - PMC - PubMed
- Andoniadou CL, Matsushima D, Mousavy Gharavy SN, Signore M, Mackintosh AI, Schaeffer M, Gaston-Massuet C, Mollard P, Jacques TS, Le Tissier P, Dattani MT, Pevny LH, Martinez-Barbera JP. Sox2(+) stem/progenitor cells in the adult mouse pituitary support organ homeostasis and have tumor-inducing potential. Cell Stem Cell. 2013;13:433–445. doi: 10.1016/j.stem.2013.07.004. - DOI - PubMed
Publication types
MeSH terms
Substances
Grants and funding
- CRC/Transregio 205/1/Deutsche Forschungsgemeinschaft/International
- MR/L016729/1/MRC_/Medical Research Council/United Kingdom
- Dianna Trebble Endowment Fund Dental Institute Studentship/King's College London/International
- GRK 2251/Deutsche Forschungsgemeinschaft/International
- Prize Fellowship 2016/Lister Institute of Preventive Medicine/International
- Prize PhD Programme/Guy's and St Thomas' Charity/International
LinkOut - more resources
Full Text Sources
Other Literature Sources
Medical
Molecular Biology Databases
Miscellaneous
