Loss of Sirtuin 1 Alters the Secretome of Breast Cancer Cells by Impairing Lysosomal Integrity - PubMed (original) (raw)
Loss of Sirtuin 1 Alters the Secretome of Breast Cancer Cells by Impairing Lysosomal Integrity
Arash Latifkar et al. Dev Cell. 2019.
Abstract
The NAD+-dependent deacetylase Sirtuin 1 (SIRT1) is down-regulated in triple-negative breast cancer. To determine the mechanistic basis by which reduced SIRT1 expression influences processes related to certain aggressive cancers, we examined the consequences of depleting breast cancer cells of SIRT1. We discovered that reducing SIRT1 levels decreased the expression of one particular subunit of the vacuolar-type H+ ATPase (V-ATPase), which is responsible for proper lysosomal acidification and protein degradation. This impairment in lysosomal function caused a reduction in the number of multi-vesicular bodies (MVBs) targeted for lysosomal degradation and resulted in larger MVBs prior to their fusing with the plasma membrane to release their contents. Collectively, these findings help explain how reduced SIRT1 expression, by disrupting lysosomal function and generating a secretome comprising exosomes with unique cargo and soluble hydrolases that degrade the extracellular matrix, can promote processes that increase breast-cancer-cell survival and invasion.
Keywords: cancer; cathepsin; deacetylation; exosomes; extracellular vesicles; lysosome; multi-vesicular body; secretome; sirtuin; vacuolar-type H(+) ATPase.
Copyright © 2019 Elsevier Inc. All rights reserved.
Conflict of interest statement
DECLARATION OF INTEREST
The authors declare no competing interests.
Figures
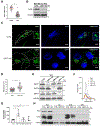
Figure 1.. Decreasing SIRT1 expression levels promotes exosome release
(A) SIRT1 transcript levels were determined in Triple-Negative Breast Cancer (TNBC) tumors, and normal tissues adjacent to the TNBC tumors (NTNBC) using RNA-Seq Nexus (GEO accession: GSE58135). (B) Western blot analysis of SIRT1 and β-Actin levels in whole cell lysates (WCL) of sham shRNA expressing control (CTRL), and SIRT1 knock down (KD), MDA-MB-231 cells. (C) Fluorescence microscopy images of the cells in (B) immunostained for CD63 (green), and stained with DAPI (blue). The periphery of each cell is outlined (dashed lines), and insets are higher magnifications of boxed areas. Scale bar, 4 μm. (D) Quantification of MVB diameter for each condition in (C). (E) Western blot analysis of nuclear sirtuins, and heat shock protein 90 (HSP90), levels in WCL of sham shRNA expressing control (CTRL), SIRT1 KD, SIRT6 KD, and SIRT7 KD MDA-MB-231 cells. The expression level of each sirtuin was quantified relative to HSP90 and included in the blot. (F) Nano-particle tracking analysis (NTA) was performed on the conditioned media collected from an equivalent number of serum starved sham shRNA expressing control (CTRL), SIRT1 KD, SIRT6 KD, and SIRT7 KD cells. (G) Quantification of exosomes generated for each of the conditions in (F). (H) Western blot analysis of IκBα, CD63, and HSP90 levels in WCL, microvesicles (MV), exosomes (EXO), and vesicle free medium (VFM) prepared from sham shRNA expressing control (CTRL), and SIRT1 KD, MDA-MB-231 cells. The data shown in (A), (D) and (G) represent means ± SD; ****p<0.0001, **p<0.01, and not-significant (ns). See also Figure S1.
Figure 2.. Exosomes from SIRT1 knockdown cells contain distinct protein cargo
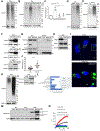
(A) Western blot analysis of ubiquitinated protein and β-Actin levels in WCL of sham shRNA expressing control (CTRL), and SIRT1 KD, cells. The amount of ubiquitinated proteins detected in each lysate was quantified relative to β-Actin and included in the blot. (B) Western blot analysis of ubiquitinated protein and HSP90 levels in exosomes (EXO) from sham shRNA expressing control (CTRL), SIRT1 KD, SIRT6 KD, and SIRT7 KD cells. The amount of ubiquitinated proteins detected in each lysate was quantified relative to HSP90 and included in the blot. (C) Quantification of ubiquitinated protein levels for each condition in (B). (D) Western blot analysis of ubiquitinated protein levels in exosomes (EXO) from cells treated with DMSO, or EX-527 (50 μM), for 16 hours. (E) Western blot analysis of ubiquitinated protein and Flotillin-2 levels in exosomes (EXO) from wildtype MDA-MB-231 cells (SIRT1 +/+), or cells in which both copies of the SIRT1 gene were genetically deleted (SIRT1 −/−). The amount of ubiquitinated protein detected in each lysate was quantified relative to Flotiliin-2 and included in the blot. (F) Western blot analysis of ubiquitinated Histone 2A (UB-H2A), ubiquitinated Histone H2B (UB-H2B), and Survivin levels in exosomes (EXO) from sham shRNA expressing control (CTRL), and SIRT1 KD, cells. (G) Western blot analysis of RAB27A levels in endolysosomal fractions immunoprecipitated from sham shRNA expressing control (CTRL), and SIRT1 KD, cells ectopically expressing Flag-tagged TMEM192. (H) Western blot analysis of RAB7, SIRT1, and β-Actin levels in the WCL of sham shRNA expressing control (CTRL), and RAB7 KD MDA-MB-231, cells. (I) Fluorescence microscopy images of the cells in (H), immunostained for CD63 (green), and stained with DAPI (blue). Insets are higher magnifications of boxed areas. Scale bar, 4 μm. (J) Quantification of MVB diameter for each condition in (I). (K) Western blot analysis of ubiquitinated protein (left) and Survivin (right) levels in exosomes (EXO) from control (CTRL), and RAB7 KD, cells. (L) DAVID GO-Cellular Component analysis of proteins enriched in vesicle free medium (VFM) collected from SIRT1 KD cells, compared to control cells. (M) Western blot analysis of Cathepsin B and HSP90 levels in microvesicles (MV), exosomes (EXO), and vesicle free media (VFM) fractions from sham shRNA expressing control (CTRL), and SIRT1 KD, cells. The unprocessed and processed forms of Cathepsin B are indicated. (N) Levels of Cathepsin B activity in the conditioned medium (CM) from control (CTRL), and SIRT1 KD, MDA-MB-231 cells treated without or with CA-074 (10 μM) for 30 minutes. The data shown in (C) and (J) represent means ± SD; ****p<0.0001, **p<0.01, and ns. See also Figure S2.
Figure 3.. SIRT1 depletion resembles lysosomal impairment
(A) Fluorescence microscopy images of sham shRNA expressing control (CTRL), and SIRT1 KD, cells immunostained for LAMP1 (red), and stained with DAPI (blue). Insets are higher magnifications of boxed areas. Scale bar, 4 μm. (B) Quantification of lysosome diameter for each condition in (A). (C) Quantification of lysosome diameter, and (D) Quantification of MVB diameter, for cells treated with DMSO, Chloroquine (CQ, 50 μM), or Bafilomycin-A (Baf-A, 200 nM) as described in Figures S3A and S3B. (E) Western blot analysis of ubiquitinated protein and Flotillin-2 levels in exosomes (EXO) from cells treated with DMSO, Bafilomycin-A (Baf-A, 200 nM), or Chloroquine (CQ, 50 μM), for 16 hours. The amount of ubiquitinated protein detected in each lysate was quantified relative to Flotillin-2 and included in the blot. (F) Quantification of exosomes generated by cells treated with DMSO, or Bafilomycin-A (Baf-A, 200 nM), for 16 hours. (G) Fluorescence microscopy images of sham shRNA expressing control (CTRL), and SIRT1 KD, cells immunostained for Cathepsin B (red) and LAMP1 (green). The cells were also stained with DAPI (blue). Scale bar, 8 μm. The images of the SIRT1 KD cells are a composite of two separate pictures. Insets are higher magnifications of boxed areas. The data shown in (B), (C), (D) and (F) represent means ± SD; ****p<0.0001. See also Figures S3 and S4.
Figure 4.. SIRT1 loss disrupts lysosomal acidification
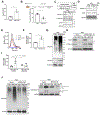
(A) Lysosomal pH measurements were determined for sham shRNA expressing control (CTRL), and SIRT1 KD, MDA-MB-231 cells. (B) Scheme of the lysosome re-acidification assay (top), and the percent of lysosomal re-acidification determined using LysoTracker Green DND-26® in sham shRNA expressing control (CTRL), and SIRT1 KD, cells. (C) SILAC results showing the ratio of ATP6V1A protein levels in SIRT1 KD cells, compared to control cells (top). Western blot analysis of ATP6V1A, ATP6V0D1, SIRT1, and HDAC6 protein levels in control (CTRL) and SIRT1 KD cells (bottom). The expression levels of ATP6V1A in each lysate was quantified relative to HDAC6 and included in the blot. (D) Western blot analysis of ATP6V1A, SIRT1, and HSP90 levels in control (CTRL), and ATP6V1A KD, cells. The expression levels of ATP6V1A was quantified relative to HSP90 and included in the blot. (E) NTA was performed on the conditioned media from an equal number of serum starved sham shRNA expressing control (CTRL), and ATP6V1A KD, cells. (F) Quantification of exosomes generated for each condition in (E). (G) Western blot analysis of ubiquitinated protein, Survivin, and Flotillin-2 levels in exosomes (EXO) generated by the cells in (D). The amount of ubiquitinated proteins detected in each lysate was quantified relative to Flotillin-2 and included in the blot. (H) Western blot analysis of SIRT1, ATP6V1A, and β-Actin levels in sham shRNA expressing control (CTRL), and SIRT1 KD, cells ectopically expressing either the vector alone (Vector) or ATP6V1A (ATP6V1A OE). (I) Quantification of exosomes generated for each condition in (H). (J) Western blot analysis of ubiquitinated protein, Cathepsin B, and HSP90 levels in exosomes (EXO; left panel) and vesicle free media (VFM; right panel) collected from these cells. The amounts of ubiquitinated protein and Cathepsin B detected in each lysate were quantified relative to HSP90 and included in the blots. The unprocessed and processed forms of Cathepsin B are also indicated. The data shown in (A), (B), (F) and (I) represent means ± SD; ***p<0.001, **p<0.01, and ns. See also Figure S5.
Figure 5.. SIRT1 Regulates ATP6V1A mRNA Stability
(A) RT-qPCR was performed using two primer sets to determine ATP6V1A transcript levels (relative to actin) in sham shRNA expressing control (CTRL), and SIRT1 KD, cells. The transcript levels of SIRT1 were also determined as a control. (B) Dual-Reporter Luciferase assays were performed on the promoter region of the ATP6V1A gene. Top panel: a schematic of the luciferase reporter used. Bottom panel: the ratio of luciferase luminescence to renilla luminescence in sham shRNA expressing control (CTRL), and SIRT1 KD, MDA-MB-231 cells expressing the reporter construct. (C) ATP6V1A mRNA stability assays were performed on Actinomycin-A treated MDA-MB-231 cells treated with DMSO, or EX-527 (20 μM), or ectopically expressing SIRT1 (SIRT1 OE), for the indicated times. (D) ATP6V1A mRNA stability assays were performed on cells ectopically expressing ATP6V1A mRNA containing (UTR), or lacking (CDS), its 3′UTR sequence and treated with either DMSO, or EX-527 (20 μM), for the indicated times. (E) ATP6V1A transcript levels were determined in TNBC tumors, and normal tissues adjacent to the TNBC tumors (NTNBC) using RNA-Seq Nexus (GEO accession: GSE58135). (F) Correlation of ATP6V1A and SIRT1 mRNA levels in the tumor samples in (E), as well as in (G) the GDC TCGA Breast Cancer dataset. The data shown in (A), (B), (C), (D) and (E) represent means ± SD; ****p<0.0001, ***p<0.001, **p<0.01, and ns. See also Figure S6.
Figure 6.. The secretome of SIRT1 depleted breast cancer cells promote invasion
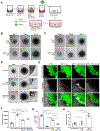
(A) Diagram of the invasion assay. Spheroids of MCF10AT1cells were prepared, embedded in collagen matrix, cultured under different conditions, and the extent to which they migrated was determined. (B-D) Images of invasion assays performed on MCF10AT1 cells treated with equivalent amounts of (B) exosomes (EXO), (C) vesicle-free media (VFM), or (D) EXO and VFM from either sham shRNA expressing control (CTRL), or SIRT1 KD, MDA-MB-231 cells (SIRT1 KD). Images show the extent of cell outgrowths on days 0,2, and 4 of the experiment. Arrows highlight areas of invasion and the insets are higher magnifications of boxed areas. Scale bar, 0.3 mm. (E) Fluorescent microscopy and second-harmonic generation (SHG) images of invasion assays performed on GFP-expressing MCF10AT1 cells treated with an equivalent amount of exosomes (EXO) and vesicle free media (VFM) collected from sham shRNA expressing control (CTRL), and SIRT1 KD, MDA-MB-231 cells, or from SIRT1 KD MDA-MB-231 cells ectopically expressing ATP6V1A (SIRT1 KD/V1A OE). Some of the cells were also treated with CA-074 (10 μM). Arrow heads indicate areas where cells have invaded into the collagen. Scale bar, 100 μm. (F) Quantification of invasion area for each condition in (E). (G) Cell death assays were performed on MCF10AT1 cells that were left untreated (Serum Starved), or were treated with exosomes isolated from either sham shRNA expressing control (EXO-CTRL), or SIRT1 KD, cells (EXO-SIRT1 KD). As a control, cells were cultured with media containing 2% fetal bovine serum (FBS). (H) Quantification of wound healing (migration) assays performed in Figure S7F, where MCF10AT1 cells were left untreated, or were treated with exosomes from either control (CTRL), or SIRT1 KD, MDA-MB-231 cells. The data shown in (F), (G), and (H) represent means ± SD; ****p<0.0001, ***p<0.001, **p<0.01, and ns. See also Figure S7.
Figure 7.. SIRT1 downregulation alters the secretome of breast cancer cells by impairing lysosomal function
Model describing the role of SIRT1 in regulating exosome biogenesis and hydrolase secretion. Decreasing SIRT1 levels in breast cancer cells reduces the stability of the ATP6V1A transcript and causes a corresponding loss in the expression of the ATP6V1A protein. This impairs lysosomal function and results in MVBs that would normally be degraded in the lysosomes to instead fuse with plasma membrane and release their content, i.e. exosomes and hydrolases.
Comment in
- SIRT1 Regulates Lysosome Function and Exosome Secretion.
McAndrews KM, LeBleu VS, Kalluri R. McAndrews KM, et al. Dev Cell. 2019 May 6;49(3):302-303. doi: 10.1016/j.devcel.2019.04.024. Dev Cell. 2019. PMID: 31063745
Similar articles
- IGF2BP2 promotes cancer progression by degrading the RNA transcript encoding a v-ATPase subunit.
Latifkar A, Wang F, Mullmann JJ, Panizza E, Fernandez IR, Ling L, Miller AD, Fischbach C, Weiss RS, Lin H, Cerione RA, Antonyak MA. Latifkar A, et al. Proc Natl Acad Sci U S A. 2022 Nov 8;119(45):e2200477119. doi: 10.1073/pnas.2200477119. Epub 2022 Nov 2. Proc Natl Acad Sci U S A. 2022. PMID: 36322753 Free PMC article. - Loss of Sirt1 promotes exosome secretion from podocytes by inhibiting lysosomal acidification in diabetic nephropathy.
Ding L, Li ZL, Zhou Y, Liu NC, Liu SS, Zhang XJ, Liu CC, Zhang DJ, Wang GH, Ma RX. Ding L, et al. Mol Cell Endocrinol. 2023 Jun 1;568-569:111913. doi: 10.1016/j.mce.2023.111913. Epub 2023 Mar 27. Mol Cell Endocrinol. 2023. PMID: 36990198 - Atg5 Disassociates the V1V0-ATPase to Promote Exosome Production and Tumor Metastasis Independent of Canonical Macroautophagy.
Guo H, Chitiprolu M, Roncevic L, Javalet C, Hemming FJ, Trung MT, Meng L, Latreille E, Tanese de Souza C, McCulloch D, Baldwin RM, Auer R, Côté J, Russell RC, Sadoul R, Gibbings D. Guo H, et al. Dev Cell. 2017 Dec 18;43(6):716-730.e7. doi: 10.1016/j.devcel.2017.11.018. Dev Cell. 2017. PMID: 29257951 - Vacuolar-type ATPase: A proton pump to lysosomal trafficking.
Futai M, Sun-Wada GH, Wada Y, Matsumoto N, Nakanishi-Matsui M. Futai M, et al. Proc Jpn Acad Ser B Phys Biol Sci. 2019;95(6):261-277. doi: 10.2183/pjab.95.018. Proc Jpn Acad Ser B Phys Biol Sci. 2019. PMID: 31189779 Free PMC article. Review. - Disorders of lysosomal acidification-The emerging role of v-ATPase in aging and neurodegenerative disease.
Colacurcio DJ, Nixon RA. Colacurcio DJ, et al. Ageing Res Rev. 2016 Dec;32:75-88. doi: 10.1016/j.arr.2016.05.004. Epub 2016 May 16. Ageing Res Rev. 2016. PMID: 27197071 Free PMC article. Review.
Cited by
- 27-Hydroxycholesterol Enhances Secretion of Extracellular Vesicles by ROS-Induced Dysregulation of Lysosomes.
Das Gupta A, Park J, Sorrells JE, Kim H, Krawczynska N, Pradeep D, Wang Y, Vidana Gamage HE, Nelczyk AT, Boppart SA, Boppart MD, Nelson ER. Das Gupta A, et al. Endocrinology. 2024 Sep 26;165(11):bqae127. doi: 10.1210/endocr/bqae127. Endocrinology. 2024. PMID: 39298675 - Targeting POLD1 to suppress the proliferation and migration of breast cancer MDA-MB-231 cell lines by downregulation of SIRT1.
Salih AI, Al-Sudani BT, Mshimesh BA. Salih AI, et al. Toxicol Res (Camb). 2024 Jul 18;13(4):tfae111. doi: 10.1093/toxres/tfae111. eCollection 2024 Aug. Toxicol Res (Camb). 2024. PMID: 39036524 - Metformin prevents the onset and progression of intervertebral disc degeneration: New insights and potential mechanisms (Review).
Yang W, Yang Y, Wang Y, Gao Z, Zhang J, Gao W, Chen Y, Lu Y, Wang H, Zhou L, Wang Y, Li J, Tao H. Yang W, et al. Int J Mol Med. 2024 Aug;54(2):71. doi: 10.3892/ijmm.2024.5395. Epub 2024 Jul 4. Int J Mol Med. 2024. PMID: 38963023 Free PMC article. Review. - Oxidative stress induces extracellular vesicle release by upregulation of HEXB to facilitate tumour growth in experimental hepatocellular carcinoma.
Duan J, Huang Z, Qin S, Li B, Zhang Z, Liu R, Wang K, Nice EC, Jiang J, Huang C. Duan J, et al. J Extracell Vesicles. 2024 Jul;13(7):e12468. doi: 10.1002/jev2.12468. J Extracell Vesicles. 2024. PMID: 38944674 Free PMC article. - Cholesterol Metabolite 27-Hydroxycholesterol Enhances the Secretion of Cancer Promoting Extracellular Vesicles by a Mitochondrial ROS-Induced Impairment of Lysosomal Function.
Das Gupta A, Park J, Sorrells JE, Kim H, Krawczynska N, Gamage HEV, Nelczyk AT, Boppart SA, Boppart MD, Nelson ER. Das Gupta A, et al. bioRxiv [Preprint]. 2024 May 1:2024.05.01.591500. doi: 10.1101/2024.05.01.591500. bioRxiv. 2024. PMID: 38746134 Free PMC article. Preprint.
References
Publication types
MeSH terms
Substances
Grants and funding
- P30 GM124166/GM/NIGMS NIH HHS/United States
- R01 CA201402/CA/NCI NIH HHS/United States
- U54 CA210184/CA/NCI NIH HHS/United States
- F99 CA234921/CA/NCI NIH HHS/United States
- R35 GM122575/GM/NIGMS NIH HHS/United States
LinkOut - more resources
Full Text Sources
Other Literature Sources
Medical
Research Materials
Miscellaneous


