Synaptic Vesicle Recycling Pathway Determines Neurotransmitter Content and Release Properties - PubMed (original) (raw)
Synaptic Vesicle Recycling Pathway Determines Neurotransmitter Content and Release Properties
Kätlin Silm et al. Neuron. 2019.
Abstract
In contrast to temporal coding by synaptically acting neurotransmitters such as glutamate, neuromodulators such as monoamines signal changes in firing rate. The two modes of signaling have been thought to reflect differences in release by different cells. We now find that midbrain dopamine neurons release glutamate and dopamine with different properties that reflect storage in different synaptic vesicles. The vesicles differ in release probability, coupling to presynaptic Ca2+ channels and frequency dependence. Although previous work has attributed variation in these properties to differences in location or cytoskeletal association of synaptic vesicles, the release of different transmitters shows that intrinsic differences in vesicle identity drive different modes of release. Indeed, dopamine but not glutamate vesicles depend on the adaptor protein AP-3, revealing an unrecognized linkage between the pathway of synaptic vesicle recycling and the properties of exocytosis. Storage of the two transmitters in different vesicles enables the transmission of distinct signals.
Keywords: AP-3; Ca++ channel coupling; VGLUT; VMAT; adaptor protein 3; dopamine; frequency dependence; glutamate; neurotransmitter corelease; release probability; synaptic vesicle; vesicular glutamate transporter; vesicular monoamoine transporter.
Copyright © 2019 Elsevier Inc. All rights reserved.
Conflict of interest statement
Declaration of interests
Authors declare no competing interests.
Figures
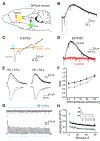
Figure 1.. Glutamate and dopamine release by dopamine neurons depress with different kinetics. See also Figure S1.
(A) DATiCre+/− mice were injected with AAV2/9.hSyn.tdTomato.T2A.GIRK2.WPRE into the medial shell of the NAc and AAV5-EF1α-DIO-hChR2-mCherry into the VTA. (B) Representative whole cell recording from a GIRK2-expressing SPN shows light-evoked EPSC (O-EPSC) and D2 dopamine receptor-mediated inhibitory current (D2-IPSC) in response to successive stimulation with blue light at 0.4 Hz (blue bar). (C) The AMPA receptor antagonist CNQX and NMDA receptor antagonist APV (orange) block the O-EPSC (gray). (D) The D2 receptor antagonist sulpiride (1 μM, red) eliminates the D2-IPSC (black). (E) Representative O-EPSC (gray) and D2-IPSC (black) responses to paired optogenetic stimulation at 2.5 s and 50 s inter-stimulus intervals (ISI). The overlapping traces show two successive responses, with the first represented by a thick line and second by a thin. (F) Quantification of the paired-pulse response for O-EPSC (gray) and D2-IPSC (black) at different ISI. p < 0.01 by two-way ANOVA; n = 5–10 cells for each interval (G) O-EPSCs and D2-IPSCs in response to repetitive optogenetic stimulation (60 pulses at 0.4 Hz). (H) Summary of O-EPSC and D2-IPSC amplitude in response to repetitive stimulation at 0.4 Hz. Amplitudes were normalized to the first response in each recording. p < 10−10 by one-way ANOVA; n = 19 cells for each
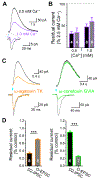
Figure 2.. Glutamate and dopamine release by dopamine neurons couple to different presynaptic Ca++ channels.
(A) Representative recordings show O-EPSCs and D2-IPSCs in control (2.5 mM, black) and low (1.0 mM, purple) extracellular Ca++. (B) Quantification of remaining current for the O-EPSC and D2-IPSC in 0.5 and 1.0 mM Ca++, relative to control (2.5 mM Ca++). The O-EPSC and D2-IPSC are reduced to a similar degree in both 0.5 and 1.0 mM Ca++. n = 4 for 0.5 mM Ca++ and 8 for 1.0 mM Ca++ (C) Representative recordings show O-EPSCs and D2-IPSCs recorded in control, the P/Q-type Ca++ channel blocker ω-agatoxin TK (300 nM, orange) or the N-type Ca++ channel blocker ω-conotoxin GVIA (200 nM, green). (D) Quantification shows the per cent residual O-EPSC and D2-IPSC in ω-agatoxin TK (orange) or ω-conotoxin GVIA (green) normalized to control without drug. *** p < 0.001 by student’s t-test. Bar graphs indicate mean ± SEM. n = 8 for ω-agatoxin TK, 6–7 for ω-conotoxin GVIA
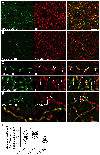
Figure 3.. Epitope-tagged VGLUT2 expressed specifically in DAT+ neurons partially colocalizes with proteins involved in dopamine release. See also Figures S2 and S3.
The ventral tegmental area (VTA) of DATicre (A,C) or DATicre;HA-VMAT2 BAC transgenic mice (B,E) was injected with recombinant AAV encoding cre-dependent HA-tagged VGLUT2 (AAV-DiO-HA-VGLUT2) (a,c) or cre-dependent pHluorin-tagged VGLUT2 (AAV-DiO-VGLUT2-pH) (B,E). Four weeks later, sections through the ventral striatum were double stained for HA and TH (A,C,D) or GFP and HA (B,E). (A) Representative confocal image of the ventral striatum from DATicre mice injected with AAV-DiO-HA-VGLUT2 and double stained for the conditional HA-VGLUT2 (green) and TH (red). (B) Representative confocal image of DAT iCre;VMAT2-HA mice injected with AAV-DIO-VGLUT2-pHluorin and double stained for GFP and HA-VMAT2. Scale bars in A and B indicate 10 μm. (C) Representative image acquired by structured illumination microscopy (SIM) of ventral striatum double stained for conditional HA-VGLUT2 and TH. (D) SIM image of the ventral striatum from HA-VMAT2 BAC transgenic mice double stained for HA and TH. Filled arrowheads in C and D indicate HA immunoreactivity alone, open arrowheads TH alone and arrows double labeled punctae. (E) Image of the ventral striatum from DATiCre/VMAT2-HA mice injected with AAV-DIO-VGLUT2-pHluorin double stained for GFP and HA-VMAT2. Filled arrowheads indicate GFP alone, open arrowheads HA alone and arrows double labeling for both. Scale bar indicates 2 μm (C-E). (F) Colocalization was quantified by Manders coefficient (fraction X colocalizing with Y for X/Y = VGLUT2/VMAT2, VGLUT2/SV2 and VMAT2/SV2). *, p < 0.05, ***, p < 0.001 by one-way ANOVA with post hoc Bonferroni’s test. In 3 mice, n = 21 fields for VGLUT2/VMAT2, 22 for VGLUT2/SV2 and 17 for VMAT2/SV2.
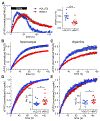
Figure 4.. VGLUT2 and VMAT2 differ in response to stimulation in hippocampal as well as dopamine neurons.
(A) Mean response of VGLUT2-pHluorin (blue) and VMAT2-pHluorin (red) to 10 Hz stimulation for 60 s in hippocampal neurons from wild type mice (left panel). The fluorescence is normalized to that observed after alkalinization in 50 mM NH4Cl. The right panel shows the average initial slope for each coverslip. ***, p = 0.0003 by Mann-Whitney test. n = 9 coverslips for VGLUT2 and 13 coverslips for VMAT2 (B,C) Mean response of VGLUT2- and VMAT2-pHluorin in hippocampal (B) and dopamine (C) neurons to 10 Hz stimulation for 3 minutes in 600 nM bafliomycin, normalized to fluorescence in NH4Cl. (D,E) Mean response of VGLUT2- and VMAT2-pHluorin to 10 Hz stimulation for 3 minutes in bafilomycin, normalized to the peak response at the end of stimulation in hippocampal (D) and dopamine (E) neurons. Insets show the quantification of exocytic time constant per coverslip. Data in all panels indicate mean ± SEM. n = 15 coverslips for VGLUT2 and 16 coverslips for VMAT2 in hippocampal neurons. *, p = 0.0208 by Mann-Whitney test. n = 10 coverslips for VGLUT2 and 13 for VMAT2 in dopamine neurons. *, p = 0.0453 by student’s t-test.
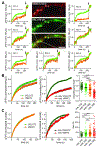
Figure 5.. The exocytosis of VGLUT2 and VMAT2 differs at individual boutons. See also Figure S4.
(A) Representative image from a hippocampal culture transduced with lentiviruses encoding VGLUT2-pHluorin (VGLUT2-pH, green) and VMAT2-mOrange2 (VMAT2-mOr2, red) and incubated in NH4Cl (50 mM) to alkalinize acidic intracellular compartments. Circles indicate individual boutons expressing variable amounts of the two fluorescent proteins and corresponding curves the fluorescence response to 10 Hz stimulation for 3 minutes in bafilomycin (600 nM). Horizontal lines indicate 10 Hz stimulation and the arrows indicate addition of 50 mM NH4Cl. (B) VGLUT2-pH and VMAT2-mOr2 exhibit a similar recycling pool size when analyzed at boutons expressing both proteins but differ at boutons that express only one of the two fluorescent transporters (p < 0.0001 by Kruskal-Wallis one-way ANOVA with Dunn’s post hoc test). **, p < 0.01; ***, p < 0.001 (C) Normalization to the peak response shows a similar rate of fluorescence increase for VGLUT2-pH and VMAT2-mOr2 at boutons expressing both proteins but an increased rate for VGLUT2 and a reduced rate for VMAT2 when comparing boutons that express only one of the transporters (p < 0.0001 by Kruskal-Wallis one-way ANOVA with Dunn’s post hoc test). **, p < 0.01; ***, p < 0.001 Data in panels B and C indicate mean ± SEM. n = 104 VGLUT2+/VMAT2+, 83 VGLUT2+ and 75 VMAT2+ boutons from 10 coverslips and 3 independent cultures.
Figure 6.. Exocytosis of VMAT2 and VGLUT2 differ in frequency dependence. See also Figure S5.
Dopamine neuron cultures from DATiCre/B6;129S6-Gt(ROSA)26Sortm9(CAG-tdTomato)Hze/J mice were stimulated with 900 action potentials (APs) at either 5 or 25 Hz in the presence of bafilomycin, and the fluorescence normalized to that in the presence of NH4Cl. (A) Fitting the response to a single exponential, VMAT2-pH fluorescence reaches a slightly lower plateau after 900 AP stimulation at 25 Hz than after the same number of APs at 5 Hz (*, p = 0.0294 by Mann-Whitney test). VGLUT2-pH reaches a substantially lower plateau at 25 Hz relative to 5 Hz (**, p = 0.0044 by unpaired t-test). (B) Comparison of the two reporters stimulated at 5 Hz shows a faster response for VGLUT2-pH than VMAT2-pH (*, p = 0.0437 by unpaired t-test). At 25 Hz, the rate of response is similar for VGLUT2- and VMAT2-pH (p = 0.1643 by unpaired t-test). Data show mean ± SEM. n = 22 coverslips for VGLUT2-pH at 5 Hz and 17 coverslips at 25 Hz; for VMAT2-pH, n = 20 coverslips for both 5 and 25 Hz stimulation.
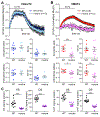
Figure 7.. Loss of AP-3 impairs the response of VMAT2-pHluorin to stimulation without affecting VGLUT2-pHluorin. See also Figure S6.
Dopamine neurons were identified using the fluorescent cocaine analog JHC 1–64 (30 nM), the cultures stimulated at 10 Hz for 60 s, and the fluorescence normalized to that observed after alkalinization in NH4Cl. (A) Mean response of VGLUT2-pH in dopamine neurons from wild type (dark blue) and mocha mice (light blue). The rate of fluorescence increase (p = 0.6676 by unpaired t-test) and peak fluorescence (p = 0.5920 by unpaired t-test) during stimulation as well as the rate of fluorescence decline (p = 0.4278 by unpaired t-test) and plateau (p = 0.9136 by unpaired t-test) after stimulation show no difference between wild type and mocha neurons. Data indicate mean ± SEM. n = 10 coverslips for wild type and 6 coverslips for mocha neurons (B) Mean response of VMAT2-pH in dopamine neurons from wild type (red) and mocha mice (pink). The peak fluorescence response shows a substantial reduction in mocha neurons relative to wild type (***, p = 0.0001 by unpaired t-test) whereas exocytosis kinetics do not differ (p = 0.7747 by unpaired t-test). Compensatory endocytosis reaches a lower plateau (*, p = 0.0180 by unpaired t-test) with faster kinetics (**, p = 0.0032 by unpaired t-test) in neurons from mocha mice relative to wild type. Data indicate mean ± SEM. n = 8 coverslips for wild type and 12 coverslips for mocha neurons (C) The mocha mutation greatly reduces dopamine (DA) and serotonin (5-HT) levels in the ventral striatum (VS) and dorsal striatum (DS). ***, p < 0.001 by unpaired t-test. n = 12 for WT and 10 for mocha
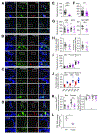
Figure 8.. Loss of AP3 reduces VMAT2 localization to dopamine neuron release sites.
(A-D) Confocal images of midbrain cultures from HA-VMAT2/WT mice (above) and HA-VMAT2/mocha mice (below). (A) TH+ neurons label for AP-3 in WT but not mocha cultures (quantified in E). (B) VGLUT2 and VMAT2 colocalize in a subset of TH+ boutons in both wild type and mocha cultures (quantified in H). (C) Piccolo colocalizes with VMAT2 in a subset of TH+ boutons in both WT and mocha cultures. The mocha mutation reduces the colocalization of piccolo and VMAT2 (quantified in K). (D) Piccolo colocalizes with VGLUT2 in a subset of TH+ boutons from wild type and mocha mice (quantified in K). Outlined areas are magnified below. Scale bar, 5 um. (E-K) Quantitation of the results shown in (A-D), with WT in black and mocha in magenta. The mocha mutation eliminates immunolabeling for AP3 (p < 0.0001 by Mann-Whitney) (E) (n = 34 images for WT and 16 images for mocha from 3 coverslips of each), and does not affect immunofluorescence intensity for TH (p = 0.4756 by Mann-Whitney) (F) (n = 90 images for WT and 79 images for mocha from 9 coverslips of each). (G) The boutons of mocha neurons show reduced labeling intensity for both VGLUT2 and VMAT2 but not SV2. p = 0.0227 by Mann-Whitney for VGLUT2 (n = 38 for WT and 47 for mocha from 6 coverslips of each), p = 0.0017 by Mann-Whitney for VMAT2 (n = 13 images for WT and 14 for mocha from 3 coverslips of each) and p = 0.3865 by Mann-Whitney for SV2 (n = 18 images for WT and 15 for mocha from three coverslips of each). (H) Colocalization in TH+ neurons of VGLUT2 and HA-VMAT2 (Manders coefficients) is unaffected by the loss of AP3. p = 0.1555 by unpaired t-test for HA-VMAT2/VGLUT2 (left) and p = 0.7220 by Mann-Whitney for VGLUT2/HA-VMAT2 (right). n = 22 images for WT and 15 for mocha. (I) The intensity of labeling for active zone proteins bassoon (Bsn), piccolo and munc13 is unaffected by the mocha mutation. p = 0.1094 for bassoon (n = 35 images for WT and 27 for mocha from 3 coverslips of each), p = 0.3369 for piccolo (n = 23 images for WT and 35 for mocha from 3 coverslips of each) and p = 0.2759 for munc13 (n = 23 images for WT and 15 for mocha from 3 coverslips of each), all by unpaired t-test. (J) VGLUT2+ punctae show greater colocalization than HA-VMAT2+ punctae with active zone proteins bassoon, piccolo and munc13. p < 0.0001 by unpaired t-test for bassoon, piccolo and munc13. n = 17 images for bassoon/VM2, 11 for bassoon/VG2, 16 for piccolo/VM2, 10 for piccolo/VG2, 31 for munc13/VM2 and 35 for munc13/VG2 (K) The mocha mutation reduces the fraction of VMAT2+ boutons colocalizing with piccolo (p = 0.0004, n = 15 images for WT, 16 for mocha) but not bassoon (p = 0.1454, n = 17 images for WT, 11 for mocha) or the fraction of VGLUT2+ boutons with either active zone protein (p = 0.1386 for VGLUT2/bassoon, n = 11 images for WT and 10 for mocha and p = 0.3983 for VGLUT2/piccolo (n = 9 images for WT and 15 for mocha), all by unpaired t-test. (L) Specific [3H]-tetrabenazine binding is severely reduced in the striatal homogenates of mocha mice relative to WT (*, p < 0.05 by two-way ANOVA). n = 3 mice/genotype. Scatterplots show mean ± SEM. *, p < 0.05; **, p < 0.01; ***, p < 0.001; ****, p < 0.0001
Similar articles
- Vesicular monoamine and glutamate transporters select distinct synaptic vesicle recycling pathways.
Onoa B, Li H, Gagnon-Bartsch JA, Elias LA, Edwards RH. Onoa B, et al. J Neurosci. 2010 Jun 9;30(23):7917-27. doi: 10.1523/JNEUROSCI.5298-09.2010. J Neurosci. 2010. PMID: 20534840 Free PMC article. - A Stem Cell-Derived Platform for Studying Single Synaptic Vesicles in Dopaminergic Synapses.
Gu H, Lazarenko RM, Koktysh D, Iacovitti L, Zhang Q. Gu H, et al. Stem Cells Transl Med. 2015 Aug;4(8):887-93. doi: 10.5966/sctm.2015-0005. Epub 2015 May 29. Stem Cells Transl Med. 2015. PMID: 26025981 Free PMC article. - Neuronal Depolarization Drives Increased Dopamine Synaptic Vesicle Loading via VGLUT.
Aguilar JI, Dunn M, Mingote S, Karam CS, Farino ZJ, Sonders MS, Choi SJ, Grygoruk A, Zhang Y, Cela C, Choi BJ, Flores J, Freyberg RJ, McCabe BD, Mosharov EV, Krantz DE, Javitch JA, Sulzer D, Sames D, Rayport S, Freyberg Z. Aguilar JI, et al. Neuron. 2017 Aug 30;95(5):1074-1088.e7. doi: 10.1016/j.neuron.2017.07.038. Epub 2017 Aug 17. Neuron. 2017. PMID: 28823729 Free PMC article. - Rustling synaptic vesicle cargo after exocytosis.
Grabner C, Zenisek D. Grabner C, et al. Neuron. 2006 Jul 6;51(1):3-5. doi: 10.1016/j.neuron.2006.06.015. Neuron. 2006. PMID: 16815324 Review. - Synaptic vesicle protein trafficking at the glutamate synapse.
Santos MS, Li H, Voglmaier SM. Santos MS, et al. Neuroscience. 2009 Jan 12;158(1):189-203. doi: 10.1016/j.neuroscience.2008.03.029. Epub 2008 Mar 22. Neuroscience. 2009. PMID: 18472224 Free PMC article. Review.
Cited by
- Protein composition of axonal dopamine release sites in the striatum.
Kershberg L, Banerjee A, Kaeser PS. Kershberg L, et al. Elife. 2022 Dec 29;11:e83018. doi: 10.7554/eLife.83018. Elife. 2022. PMID: 36579890 Free PMC article. - Novel genetically encoded tools for imaging or silencing neuropeptide release from presynaptic terminals in vivo.
Kim DI, Park S, Ye M, Chen JY, Jhang J, Hunker AC, Zweifel LS, Palmiter RD, Han S. Kim DI, et al. bioRxiv [Preprint]. 2023 Jan 20:2023.01.19.524797. doi: 10.1101/2023.01.19.524797. bioRxiv. 2023. PMID: 36712060 Free PMC article. Preprint. - Prevalent co-release of glutamate and GABA throughout the mouse brain.
Ceballos CC, Ma L, Qin M, Zhong H. Ceballos CC, et al. bioRxiv [Preprint]. 2024 Mar 29:2024.03.27.587069. doi: 10.1101/2024.03.27.587069. bioRxiv. 2024. PMID: 38585864 Free PMC article. Updated. Preprint. - Unveiling the LncRNA-miRNA-mRNA Regulatory Network in Arsenic-Induced Nerve Injury in Rats through High-Throughput Sequencing.
Chu F, Lu C, Jiao Z, Yang W, Yang X, Ma H, Yu H, Wang S, Li Y, Sun D, Sun H. Chu F, et al. Toxics. 2023 Nov 22;11(12):953. doi: 10.3390/toxics11120953. Toxics. 2023. PMID: 38133354 Free PMC article. - Neurodevelopmental and synaptic defects in DNAJC6 parkinsonism, amenable to gene therapy.
Abela L, Gianfrancesco L, Tagliatti E, Rossignoli G, Barwick K, Zourray C, Reid KM, Budinger D, Ng J, Counsell J, Simpson A, Pearson TS, Edvardson S, Elpeleg O, Brodsky FM, Lignani G, Barral S, Kurian MA. Abela L, et al. Brain. 2024 Jun 3;147(6):2023-2037. doi: 10.1093/brain/awae020. Brain. 2024. PMID: 38242634 Free PMC article.
References
Publication types
MeSH terms
Substances
Grants and funding
- P01 DA010154/DA/NIDA NIH HHS/United States
- F30 DA040996/DA/NIDA NIH HHS/United States
- R01 NS109295/NS/NINDS NIH HHS/United States
- R01 NS095809/NS/NINDS NIH HHS/United States
- R01 NS103938/NS/NINDS NIH HHS/United States
- R01 MH050712/MH/NIMH NIH HHS/United States
- R01 DA035821/DA/NIDA NIH HHS/United States
LinkOut - more resources
Full Text Sources
Other Literature Sources
Molecular Biology Databases
Research Materials
Miscellaneous
